

Target expression details
| Target's General Information | |||||
|---|---|---|---|---|---|
| Target ID | T59328 | ||||
| Target Name | Epidermal growth factor receptor (EGFR) | ||||
| Synonyms | Receptor tyrosine-protein kinase erbB-1; Proto-oncogene c-ErbB-1; HER1; ERBB1; ERBB | ||||
| Target Type | Successful | ||||
| Gene Name | EGFR | ||||
| Biochemical Class | Kinase | ||||
| UniProt ID | EGFR_HUMAN | ||||
| Target's Expression Profile in Disease Related Tissue between Patients and Normal People | |||||
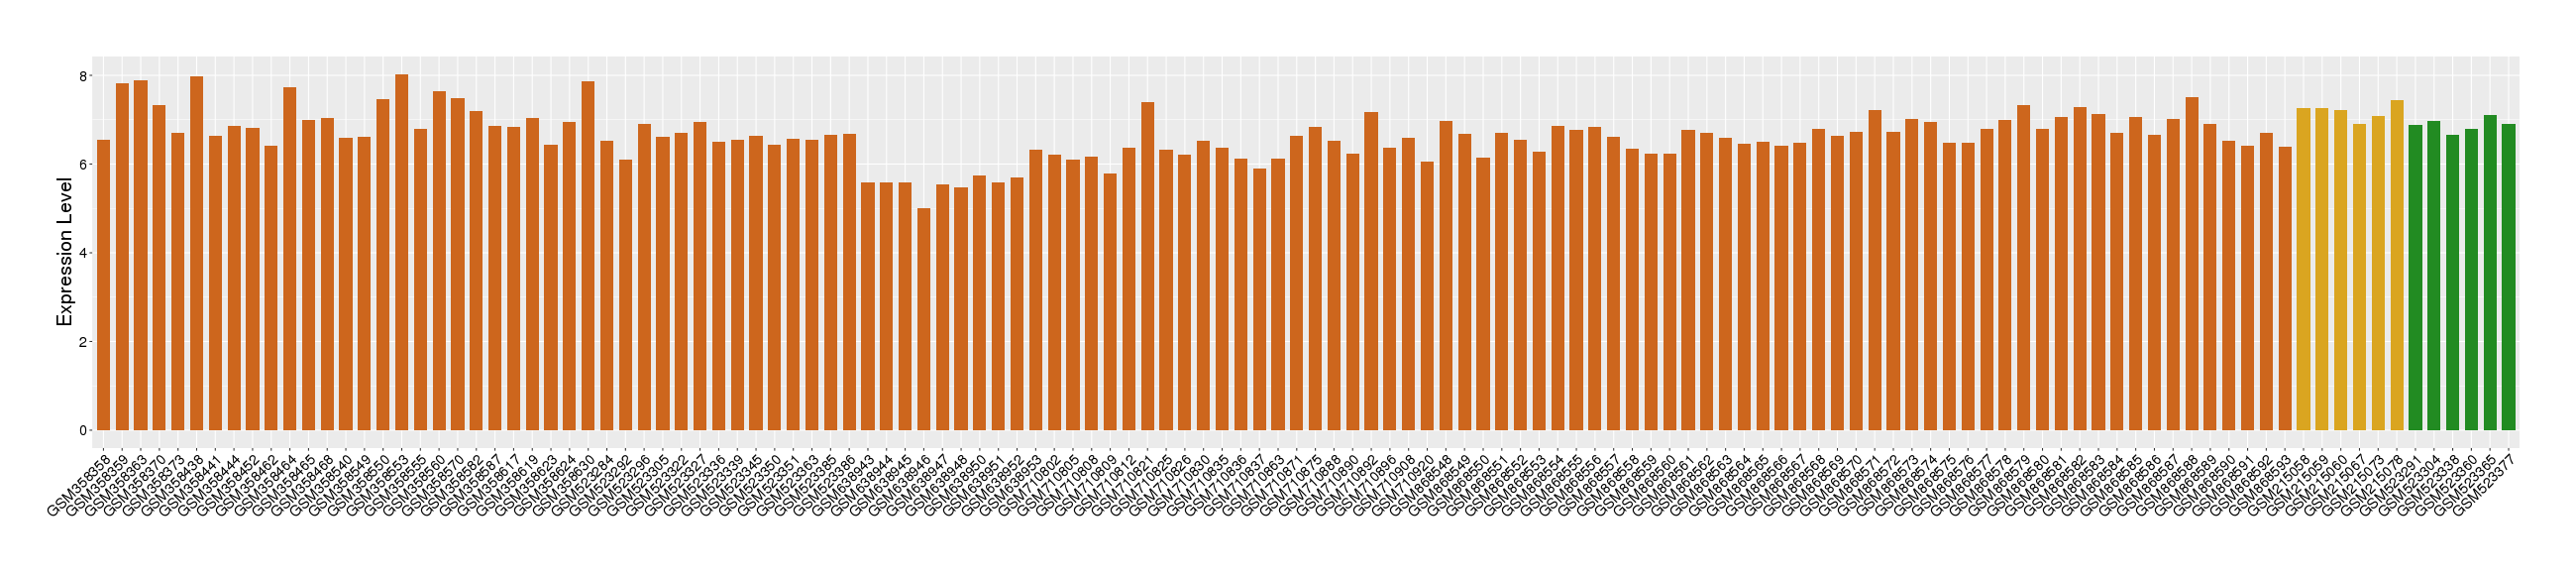
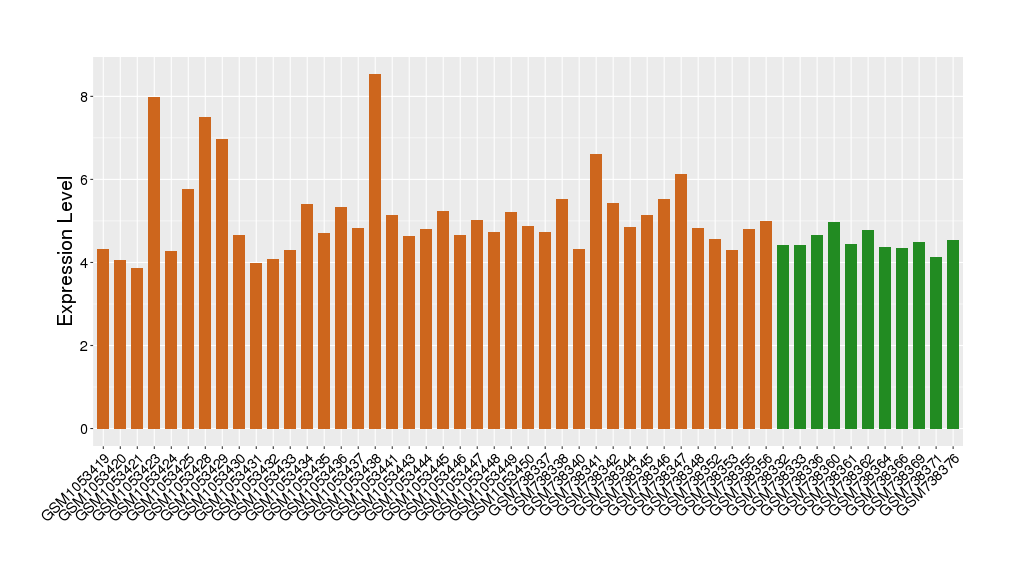
| Disease | Breast cancer | ||||
| Example drug | Lapatinib | Approved | [1], [2], [3] | ||
| Tissue | Breast tissue | ||||
| Level of differential expression between the patients in the disease section of the tissue and the tissues of healthy individual |
Fold-change: -0.89 Z-score: -1.53 P-value: 1.04E-65 |
||||
| Level of differential expression between the patients in the disease section of the tissue section of the tissue adjacent to the disease section |
Fold-change: -0.95 Z-score: -1.79 P-value: 2.77E-16 |
||||
|
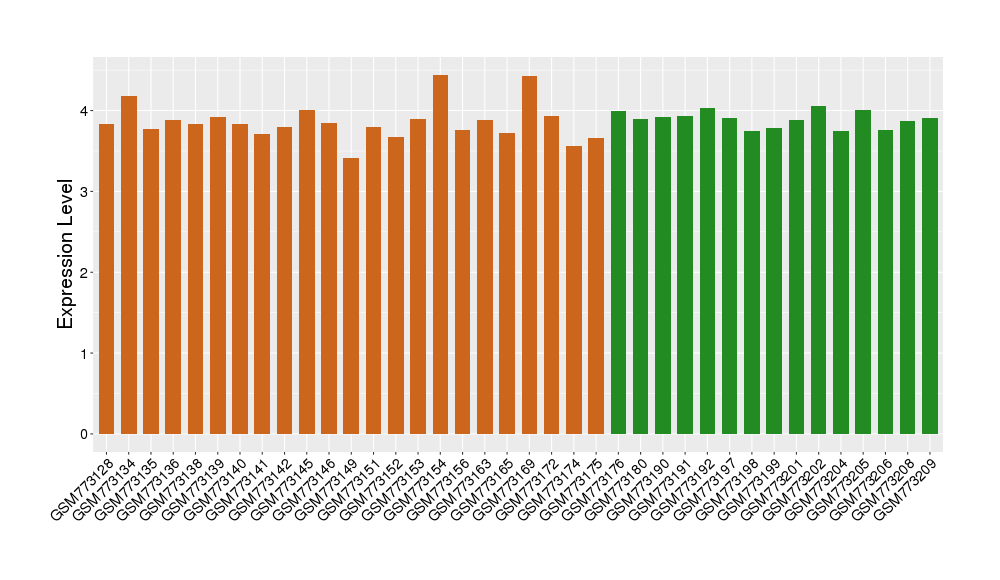
Target gene expression profiles of the patients in the disease section of the tissue
Target gene expression profiles of the patients in the normal section of the tissue adjacent to the disease section
Target gene expression profiles in the tissue of healthy individual

|
|||||
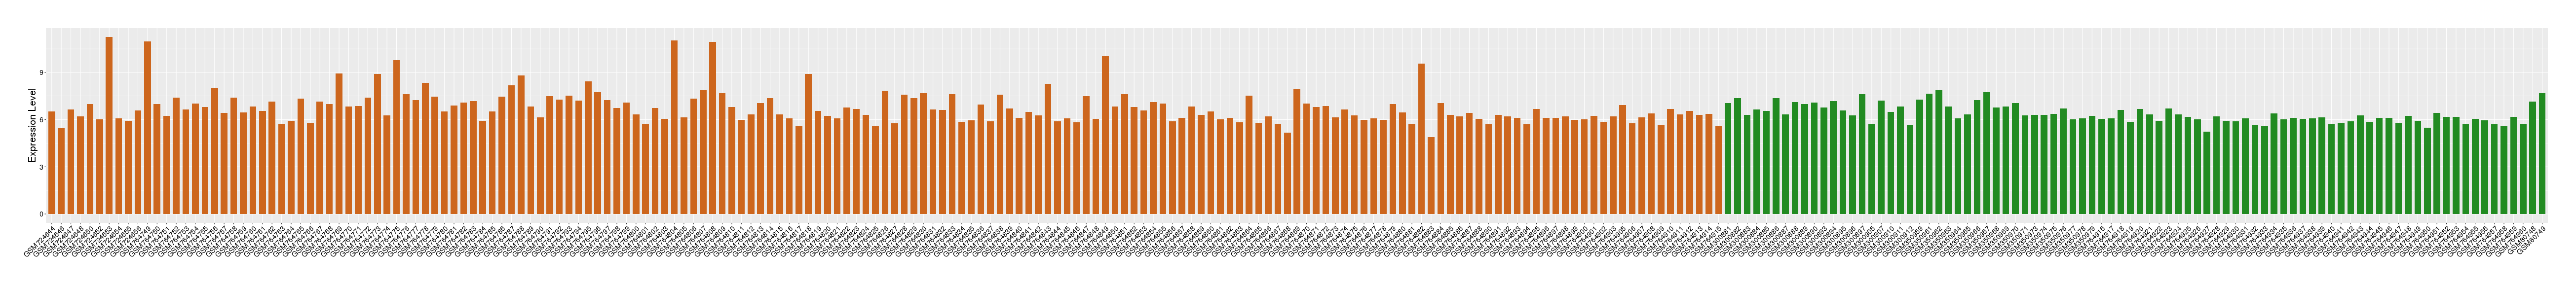
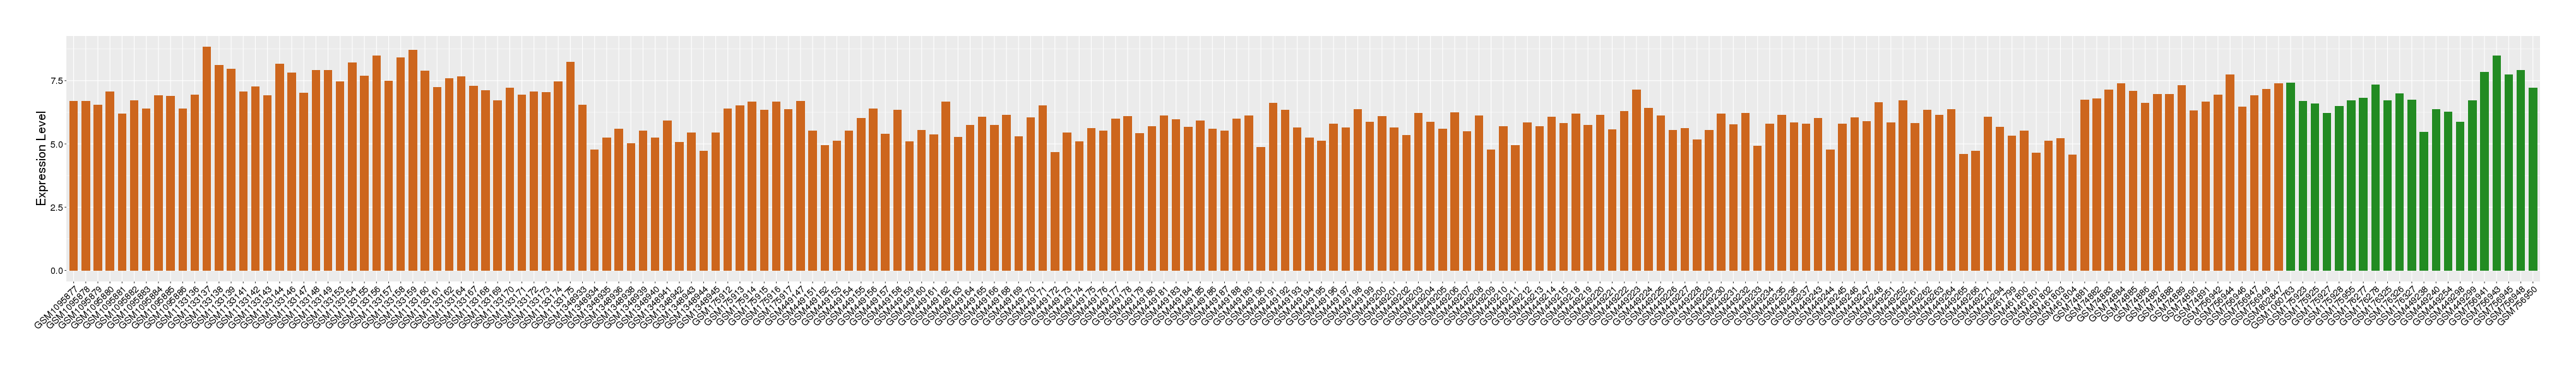
| Disease | Lung cancer | ||||
| Example drug | Erlotinib | Approved | [2], [3], [4], [5] | ||
| Tissue | Lung tissue | ||||
| Level of differential expression between the patients in the disease section of the tissue and the tissues of healthy individual |
Fold-change: -0.04 Z-score: -0.09 P-value: 1.65E-01 |
||||
| Level of differential expression between the patients in the disease section of the tissue section of the tissue adjacent to the disease section |
Fold-change: -0.21 Z-score: -0.35 P-value: 1.58E-03 |
||||
|
Target gene expression profiles of the patients in the disease section of the tissue
Target gene expression profiles of the patients in the normal section of the tissue adjacent to the disease section
Target gene expression profiles in the tissue of healthy individual

|
|||||
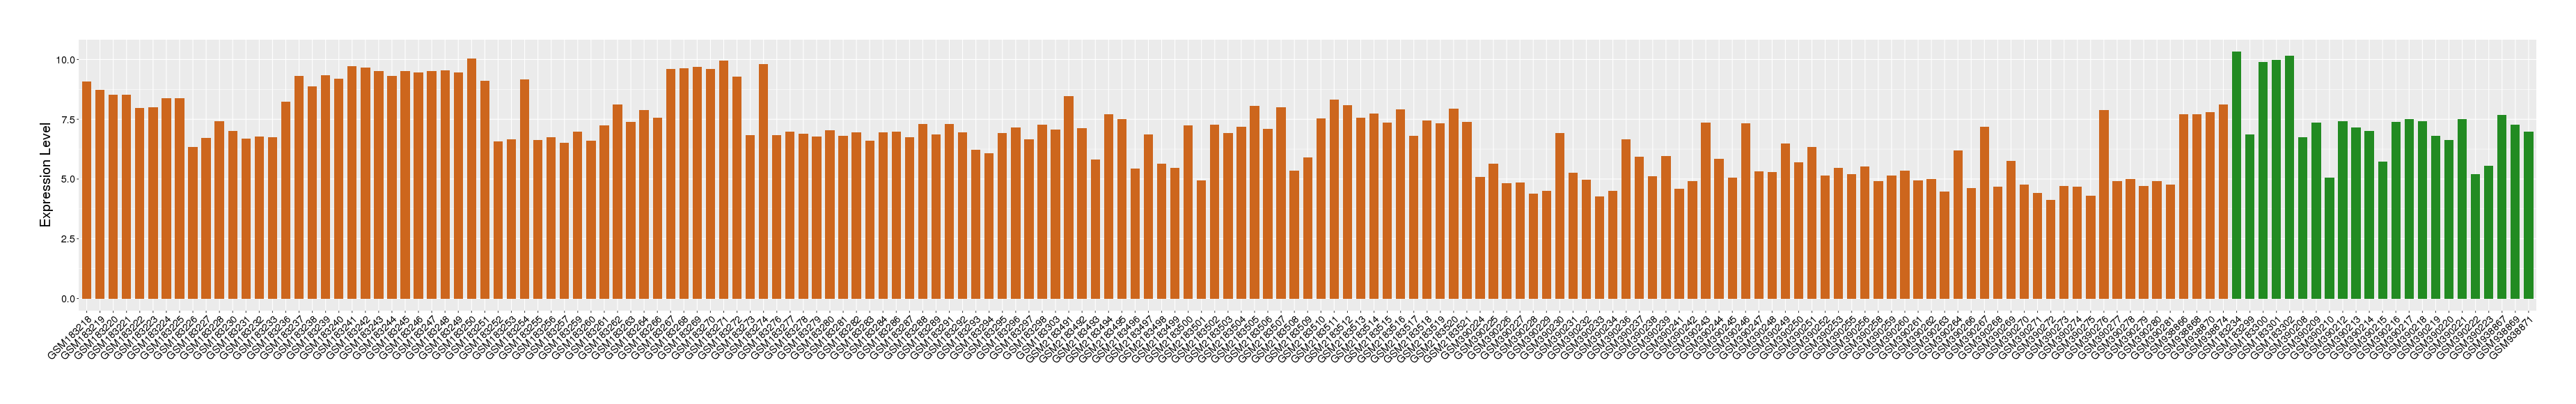
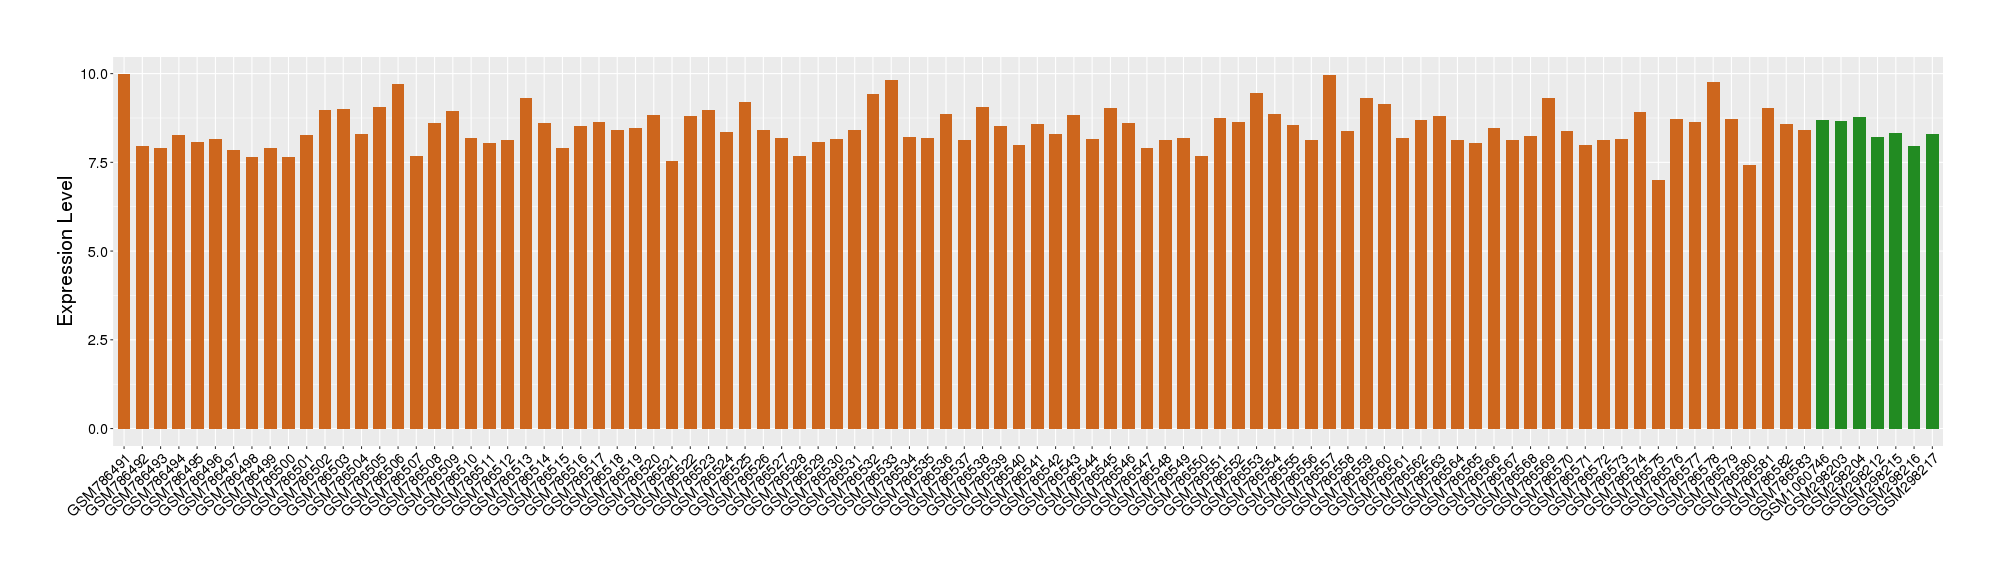
| Disease | Rectal cancer | ||||
| Example drug | Cetuximab | Approved | [2], [3], [5], [6] | ||
| Tissue | Rectal colon tissue | ||||
| Level of differential expression between the patients in the disease section of the tissue and the tissues of healthy individual |
Fold-change: -0.25 Z-score: -1.63 P-value: 1.07E-02 |
||||
| Level of differential expression between the patients in the disease section of the tissue section of the tissue adjacent to the disease section |
Fold-change: -0.59 Z-score: -3.17 P-value: 1.24E-04 |
||||
|
Target gene expression profiles of the patients in the disease section of the tissue
Target gene expression profiles of the patients in the normal section of the tissue adjacent to the disease section
Target gene expression profiles in the tissue of healthy individual
|
|||||
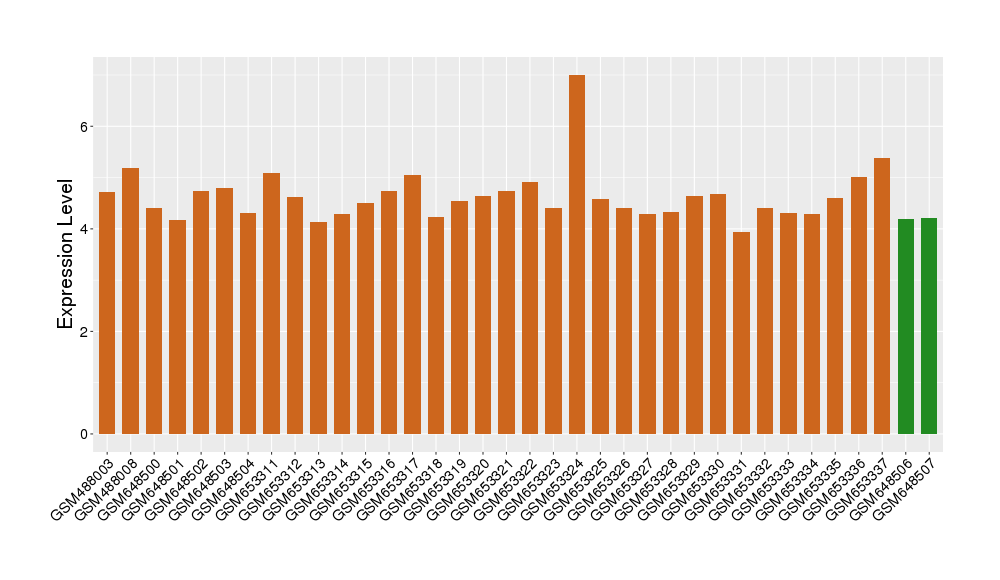
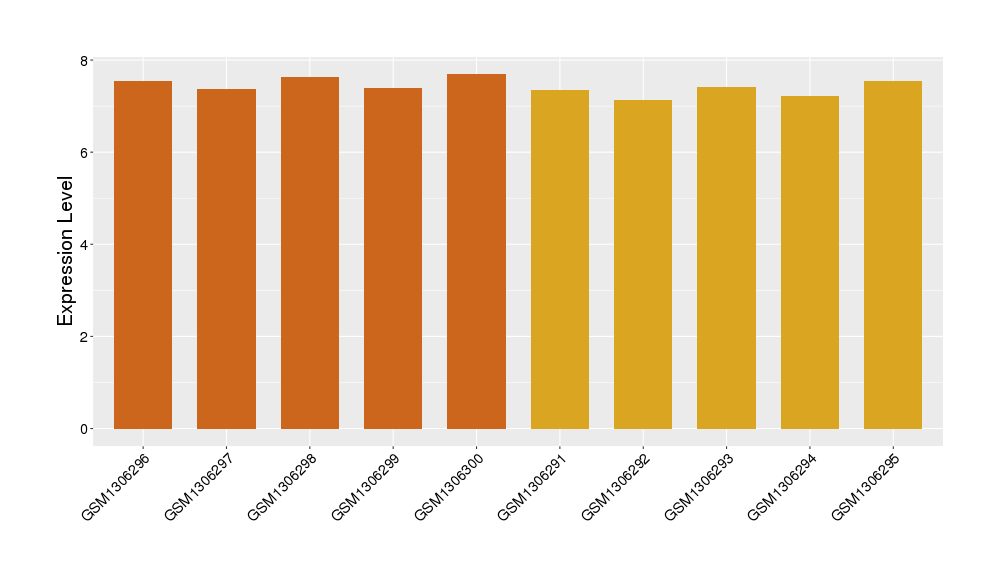
| Disease | Psoriasis | ||||
| Example drug | PD-153035 | Discontinued in Phase 1 | [7], [2], [3] | ||
| Tissue | Skin | ||||
| Level of differential expression between the patients in the disease section of the tissue and the tissues of healthy individual |
Fold-change: -0.27 Z-score: -0.42 P-value: 1.86E-07 |
||||
| Level of differential expression between the patients in the disease section of the tissue section of the tissue adjacent to the disease section |
Fold-change: 1.02 Z-score: 1.93 P-value: 1.31E-21 |
||||
|
Target gene expression profiles of the patients in the disease section of the tissue
Target gene expression profiles of the patients in the normal section of the tissue adjacent to the disease section
Target gene expression profiles in the tissue of healthy individual

|
|||||
| Disease | Brain cancer | ||||
| Example drug | Rindopepimut | Phase 3 | [8], [2], [3] | ||
| Tissue | Nervous tissue | ||||
| Level of differential expression between the patients in the disease section of the tissue and the tissues of healthy individual |
Fold-change: 0.06 Z-score: 0.13 P-value: 8.30E-26 |
||||
|
Target gene expression profiles of the patients in the disease section of the tissue
Target gene expression profiles in the tissue of healthy individual

|
|||||
| Disease | Gastric cancer | ||||
| Example drug | DE-766 | Phase 3 | [2], [3], [9], [10] | ||
| Tissue | Gastric tissue | ||||
| Level of differential expression between the patients in the disease section of the tissue and the tissues of healthy individual |
Fold-change: -0.42 Z-score: -2.17 P-value: 2.52E-01 |
||||
| Level of differential expression between the patients in the disease section of the tissue section of the tissue adjacent to the disease section |
Fold-change: 0.31 Z-score: 0.57 P-value: 2.59E-02 |
||||
|
Target gene expression profiles of the patients in the disease section of the tissue
Target gene expression profiles of the patients in the normal section of the tissue adjacent to the disease section
Target gene expression profiles in the tissue of healthy individual

|
|||||
| Disease | Head and neck cancer | ||||
| Example drug | Zalutumumab | Phase 3 | [11], [2], [3] | ||
| Tissue | Head and neck tissue | ||||
| Level of differential expression between the patients in the disease section of the tissue and the tissues of healthy individual |
Fold-change: 0.32 Z-score: 0.55 P-value: 5.84E-05 |
||||
|
Target gene expression profiles of the patients in the disease section of the tissue
Target gene expression profiles in the tissue of healthy individual
|
|||||
| Disease | Melanoma | ||||
| Example drug | AZD9291 | Phase 3 | [2], [3], [12], [13] | ||
| Tissue | Skin | ||||
| Level of differential expression between the patients in the disease section of the tissue and the tissues of healthy individual |
Fold-change: -0.34 Z-score: -0.23 P-value: 1.60E-01 |
||||
|
Target gene expression profiles of the patients in the disease section of the tissue
Target gene expression profiles in the tissue of healthy individual
|
|||||
| Disease | Glioma | ||||
| Example drug | Erlotinib | Phase 2 | [2], [3], [4], [5] | ||
| Tissue | Brainstem tissue | ||||
| Level of differential expression between the patients in the disease section of the tissue and the tissues of healthy individual |
Fold-change: 0.4 Z-score: 190.08 P-value: 2.09E-05 |
||||
|
Target gene expression profiles of the patients in the disease section of the tissue
Target gene expression profiles in the tissue of healthy individual
|
|||||
| Disease | Glioma | ||||
| Example drug | Erlotinib | Phase 2 | [2], [3], [4], [5] | ||
| Tissue | White matter | ||||
| Level of differential expression between the patients in the disease section of the tissue and the tissues of healthy individual |
Fold-change: 0.39 Z-score: 1.69 P-value: 6.32E-04 |
||||
|
Target gene expression profiles of the patients in the disease section of the tissue
Target gene expression profiles in the tissue of healthy individual
|
|||||
| Disease | Ovarian cancer | ||||
| Example drug | Gefitinib | Phase 2 | [2], [3], [14], [15] | ||
| Tissue | Ovarian tissue | ||||
| Level of differential expression between the patients in the disease section of the tissue and the tissues of healthy individual |
Fold-change: -0.01 Z-score: -0.03 P-value: 9.25E-01 |
||||
| Level of differential expression between the patients in the disease section of the tissue section of the tissue adjacent to the disease section |
Fold-change: -1.28 Z-score: -2.32 P-value: 6.76E-06 |
||||
|
Target gene expression profiles of the patients in the disease section of the tissue
Target gene expression profiles of the patients in the normal section of the tissue adjacent to the disease section
Target gene expression profiles in the tissue of healthy individual

|
|||||
| Disease | Prostate cancer | ||||
| Example drug | Gefitinib | Phase 2 | [2], [3], [14], [15] | ||
| Tissue | Prostate | ||||
| Level of differential expression between the patients in the disease section of the tissue and the tissues of healthy individual |
Fold-change: -0.59 Z-score: -0.82 P-value: 7.43E-04 |
||||
|
Target gene expression profiles of the patients in the disease section of the tissue
Target gene expression profiles in the tissue of healthy individual
|
|||||
| Disease | Bladder cancer | ||||
| Example drug | Gefitinib | Phase 2 | [2], [3], [14], [15] | ||
| Tissue | Bladder tissue | ||||
| Level of differential expression between the patients in the disease section of the tissue and the tissues of healthy individual |
Fold-change: 0.09 Z-score: 0.29 P-value: 5.87E-01 |
||||
|
Target gene expression profiles of the patients in the disease section of the tissue
Target gene expression profiles in the tissue of healthy individual
|
|||||
| Disease | Eosinophilic gastritis | ||||
| Example drug | Heparin-EGF-like factor | Terminated | [2], [3], [16], [17] | ||
| Tissue | Gastric antrum tissue | ||||
| Level of differential expression between the patients in the disease section of the tissue section of the tissue adjacent to the disease section |
Fold-change: 0.21 Z-score: 1.3 P-value: 7.00E-02 |
||||
|
Target gene expression profiles of the patients in the disease section of the tissue
Target gene expression profiles of the patients in the normal section of the tissue adjacent to the disease section
Target gene expression profiles in the tissue of healthy individual
|
|||||
| Disease | Ureter cancer | ||||
| Tissue | Urothelium | ||||
| Level of differential expression between the patients in the disease section of the tissue and the tissues of healthy individual |
Fold-change: -0.07 Z-score: -0.71 P-value: 5.34E-01 |
||||
|
Target gene expression profiles of the patients in the disease section of the tissue
Target gene expression profiles in the tissue of healthy individual
|
|||||
| Target's Expression Profile across Various Tissues of Healthy Individual | |||||
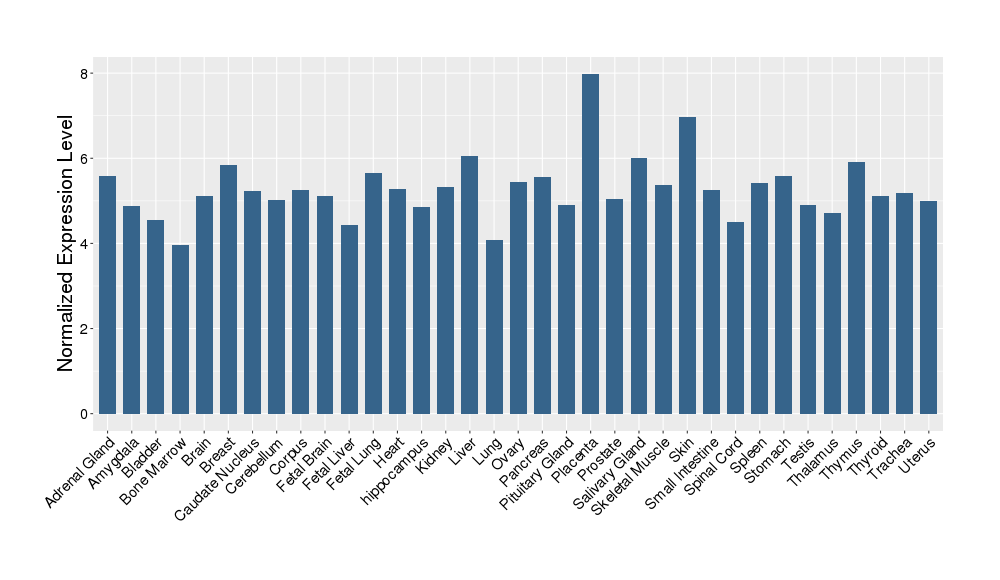
|
|||||
| References | |||||
| REF 1 | FDA Approved Drug Products from FDA Official Website. 2009. Application Number: (NDA) 022059. | ||||
| REF 2 | Interpreting expression profiles of cancers by genome-wide survey of breadth of expression in normal tissues. Genomics 2005 Aug;86(2):127-41. | ||||
| REF 3 | NCBI GEO: archive for functional genomics data sets--update. Nucleic Acids Res. 2013 Jan;41(Database issue):D991-5. | ||||
| REF 4 | URL: http://www.guidetopharmacology.org Nucleic Acids Res. 2015 Oct 12. pii: gkv1037. The IUPHAR/BPS Guide to PHARMACOLOGY in 2016: towards curated quantitative interactions between 1300 protein targets and 6000 ligands. (Ligand id: 4920). | ||||
| REF 5 | 2004 approvals: the demise of the blockbuster. Nat Rev Drug Discov. 2005 Feb;4(2):93-4. | ||||
| REF 6 | URL: http://www.guidetopharmacology.org Nucleic Acids Res. 2015 Oct 12. pii: gkv1037. The IUPHAR/BPS Guide to PHARMACOLOGY in 2016: towards curated quantitative interactions between 1300 protein targets and 6000 ligands. (Ligand id: 6882). | ||||
| REF 7 | Trusted, scientifically sound profiles of drug programs, clinical trials, safety reports, and company deals, written by scientists. Springer. 2015. Adis Insight (drug id 800005268) | ||||
| REF 8 | ClinicalTrials.gov (NCT01480479) Phase III Study of Rindopepimut/GM-CSF in Patients With Newly Diagnosed Glioblastoma. U.S. National Institutes of Health. | ||||
| REF 9 | Clinical pipeline report, company report or official report of Daiichi Sankyo. | ||||
| REF 10 | Clinical pipeline report, company report or official report of Daiichi Sankyo. | ||||
| REF 11 | ClinicalTrials.gov (NCT00382031) Zalutumumab in Patients With Non-curable Head and Neck Cancer. U.S. National Institutes of Health. | ||||
| REF 12 | URL: http://www.guidetopharmacology.org Nucleic Acids Res. 2015 Oct 12. pii: gkv1037. The IUPHAR/BPS Guide to PHARMACOLOGY in 2016: towards curated quantitative interactions between 1300 protein targets and 6000 ligands. (Ligand id: 7719). | ||||
| REF 13 | ClinicalTrials.gov (NCT02511106) AZD9291 Versus Placebo in Patients With Stage IB-IIIA Non-small Cell Lung Carcinoma, Following Complete Tumour Resection With or Without Adjuvant Chemotherapy. | ||||
| REF 14 | URL: http://www.guidetopharmacology.org Nucleic Acids Res. 2015 Oct 12. pii: gkv1037. The IUPHAR/BPS Guide to PHARMACOLOGY in 2016: towards curated quantitative interactions between 1300 protein targets and 6000 ligands. (Ligand id: 4941). | ||||
| REF 15 | Emerging drugs for the treatment of chronic obstructive pulmonary disease. Expert Opin Emerg Drugs. 2006 May;11(2):275-91. | ||||
| REF 16 | The heparin-binding domain of heparin-binding EGF-like growth factor can target Pseudomonas exotoxin to kill cells exclusively through heparan sulfate proteoglycans. J Cell Sci. 1994 Sep;107 ( Pt 9):2599-608. | ||||
| REF 17 | Heparin-binding epidermal growth factor-like growth factor is an autocrine growth factor for human keratinocytes. J Biol Chem. 1994 Aug 5;269(31):20060-6. | ||||
If You Find Any Error in Data or Bug in Web Service, Please Kindly Report It to Dr. Zhou and Dr. Zhang.