

Target expression details
| Target's General Information | |||||
|---|---|---|---|---|---|
| Target ID | T86385 | ||||
| Target Name | Cathepsin G (CTSG) | ||||
| Synonyms | CG | ||||
| Target Type | Clinical trial | ||||
| Gene Name | CTSG | ||||
| Biochemical Class | Peptidase | ||||
| UniProt ID | CATG_HUMAN | ||||
| Target's Expression Profile in Disease Related Tissue between Patients and Normal People | |||||
| Disease | Atopic dermatitis | ||||
| Example drug | Dermolastin | Discontinued in Phase 2 | [1], [2], [3] | ||
| Tissue | Skin | ||||
| Level of differential expression between the patients in the disease section of the tissue and the tissues of healthy individual |
Fold-change: -0.87 Z-score: -1.12 P-value: 1.39E-04 |
||||
|
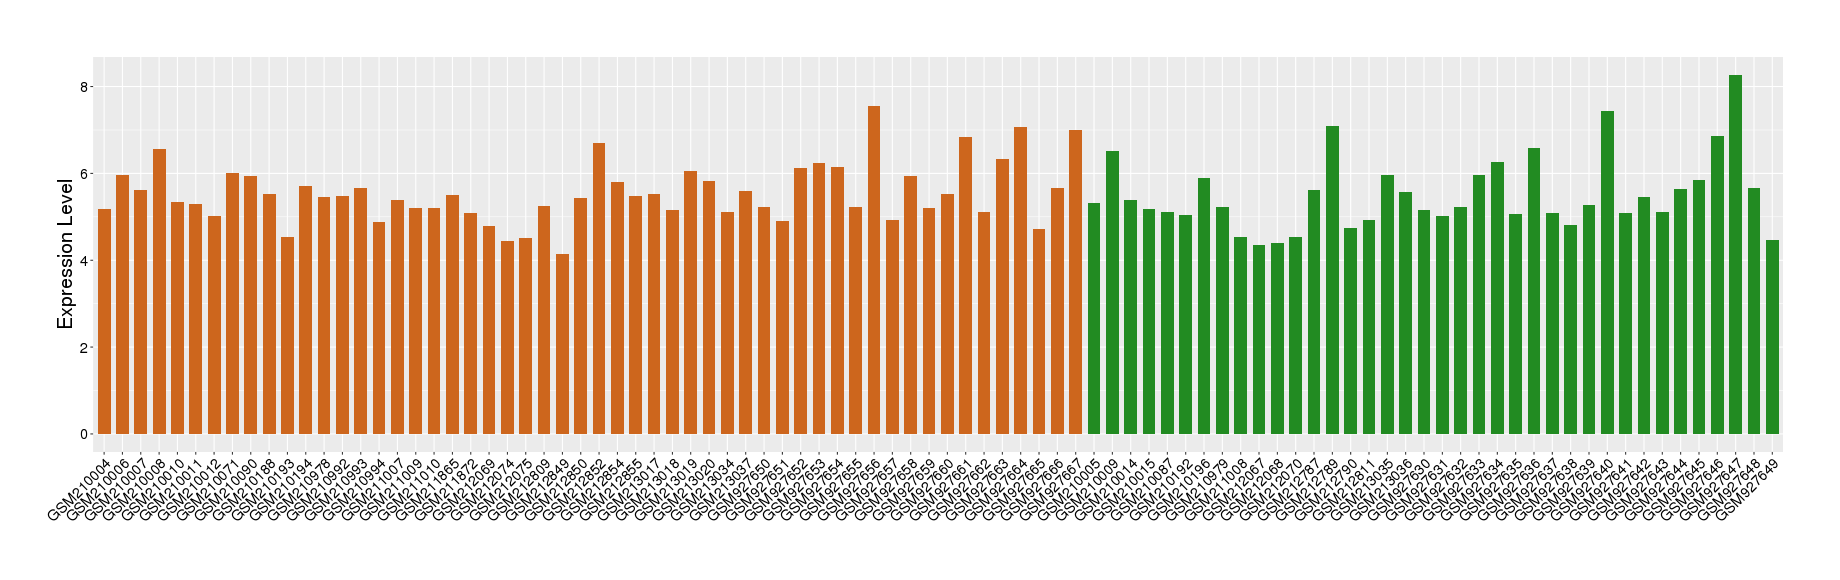
Target gene expression profiles of the patients in the disease section of the tissue
Target gene expression profiles in the tissue of healthy individual

|
|||||
| Disease | Asthma | ||||
| Example drug | JNJ-10311795 | Phase 2 | [2], [3], [4] | ||
| Tissue | Nasal and bronchial airway | ||||
| Level of differential expression between the patients in the disease section of the tissue and the tissues of healthy individual |
Fold-change: 0.08 Z-score: 0.16 P-value: 3.71E-02 |
||||
|
Target gene expression profiles of the patients in the disease section of the tissue
Target gene expression profiles in the tissue of healthy individual

|
|||||
| Disease | Chronic obstructive pulmonary disease | ||||
| Example drug | JNJ-10311795 | Phase 2 | [2], [3], [4] | ||
| Tissue | Lung tissue | ||||
| Level of differential expression between the patients in the disease section of the tissue and the tissues of healthy individual |
Fold-change: 0.23 Z-score: 0.26 P-value: 8.23E-01 |
||||
|
Target gene expression profiles of the patients in the disease section of the tissue
Target gene expression profiles in the tissue of healthy individual
|
|||||
| Disease | Chronic obstructive pulmonary disease | ||||
| Example drug | JNJ-10311795 | Phase 2 | [2], [3], [4] | ||
| Tissue | Small airway epithelium | ||||
| Level of differential expression between the patients in the disease section of the tissue and the tissues of healthy individual |
Fold-change: 0.05 Z-score: 0.19 P-value: 5.14E-01 |
||||
|
Target gene expression profiles of the patients in the disease section of the tissue
Target gene expression profiles in the tissue of healthy individual

|
|||||
| Disease | Myeloma | ||||
| Tissue | Bone marrow | ||||
| Level of differential expression between the patients in the disease section of the tissue and the tissues of healthy individual |
Fold-change: -0.43 Z-score: -1.03 P-value: 1.80E-01 |
||||
|
Target gene expression profiles of the patients in the disease section of the tissue
Target gene expression profiles in the tissue of healthy individual

|
|||||
| Target's Expression Profile across Various Tissues of Healthy Individual | |||||
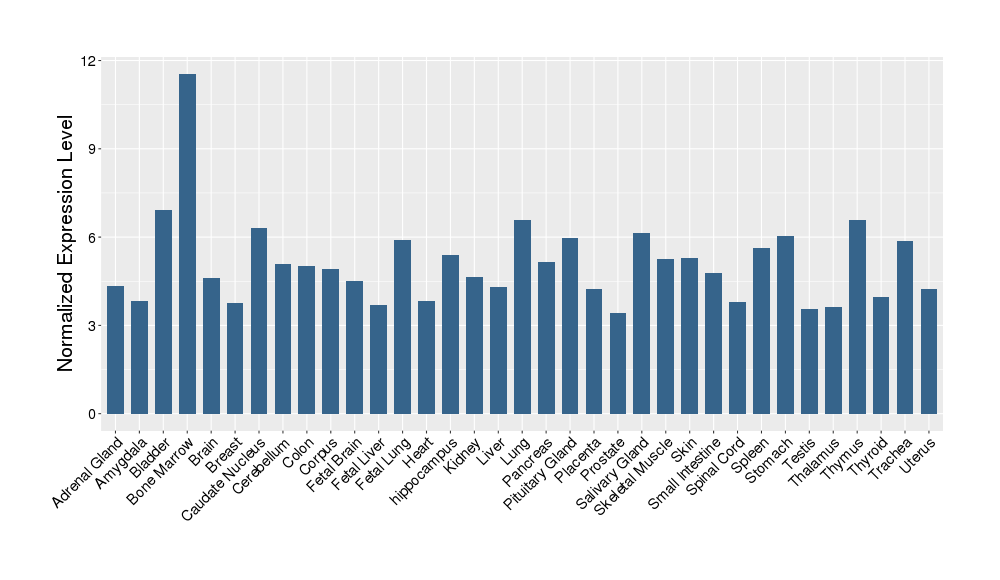
|
|||||
| References | |||||
| REF 1 | Trusted, scientifically sound profiles of drug programs, clinical trials, safety reports, and company deals, written by scientists. Springer. 2015. Adis Insight (drug id 800018071) | ||||
| REF 2 | Interpreting expression profiles of cancers by genome-wide survey of breadth of expression in normal tissues. Genomics 2005 Aug;86(2):127-41. | ||||
| REF 3 | NCBI GEO: archive for functional genomics data sets--update. Nucleic Acids Res. 2013 Jan;41(Database issue):D991-5. | ||||
| REF 4 | URL: http://www.guidetopharmacology.org Nucleic Acids Res. 2015 Oct 12. pii: gkv1037. The IUPHAR/BPS Guide to PHARMACOLOGY in 2016: towards curated quantitative interactions between 1300 protein targets and 6000 ligands. (Ligand id: 6563). | ||||
If You Find Any Error in Data or Bug in Web Service, Please Kindly Report It to Dr. Zhou and Dr. Zhang.