

Target Information
| Target General Infomation | Top | ||||
|---|---|---|---|---|---|
| Target ID |
T99685
|
||||
| Target Name |
HUMAN mammalian target of rapamycin (mTOR)
|
||||
| Synonyms |
Target of rapamycin; TOR kinase; Rapamycin target protein 1; Rapamycin target protein; Rapamycin and FKBP12 target 1; RAPT1; RAFT1; Mechanistic target of rapamycin; Mammalian target of rapamycin; FRAP2; FRAP1; FRAP; FKBP12-rapamycin complex-associated protein; FKBP-rapamycin associated protein; FK506-binding protein 12-rapamycin complex-associated protein 1
|
||||
| Gene Name |
MTOR
|
||||
| Target Status |
Target in Phase 2 Trial
|
[1] | |||
| Disease | [+] 3 Target-related Diseases | + | |||
| 1 | COVID-19 [ICD-11: 1D6Y] | ||||
| 2 | Middle East Respiratory Syndrome [ICD-11: 1D64] | ||||
| 3 | Severe acute respiratory syndrome [ICD-11: 1D65] | ||||
| Function |
MTOR directly or indirectly regulates the phosphorylation of at least 800 proteins. Functions as part of 2 structurally and functionally distinct signaling complexes mTORC1 and mTORC2 (mTOR complex 1 and 2). Activated mTORC1 up-regulates protein synthesis by phosphorylating key regulators of mRNA translation and ribosome synthesis. This includes phosphorylation of EIF4EBP1 and release of its inhibition toward the elongation initiation factor 4E (eiF4E). Moreover, phosphorylates and activates RPS6KB1 and RPS6KB2 that promote protein synthesis by modulating the activity of their downstream targets including ribosomal protein S6, eukaryotic translation initiation factor EIF4B, and the inhibitor of translation initiation PDCD4. Stimulates the pyrimidine biosynthesis pathway, both by acute regulation through RPS6KB1-mediated phosphorylation of the biosynthetic enzyme CAD, and delayed regulation, through transcriptional enhancement of the pentose phosphate pathway which produces 5-phosphoribosyl-1-pyrophosphate (PRPP), an allosteric activator of CAD at a later step in synthesis, this function is dependent on the mTORC1 complex. Regulates ribosome synthesis by activating RNA polymerase III-dependent transcription through phosphorylation and inhibition of MAF1 an RNA polymerase III-repressor. In parallel to protein synthesis, also regulates lipid synthesis through SREBF1/SREBP1 and LPIN1. To maintain energy homeostasis mTORC1 may also regulate mitochondrial biogenesis through regulation of PPARGC1A. mTORC1 also negatively regulates autophagy through phosphorylation of ULK1. Under nutrient sufficiency, phosphorylates ULK1 at 'Ser-758', disrupting the interaction with AMPK and preventing activation of ULK1. Also prevents autophagy through phosphorylation of the autophagy inhibitor DAP. Also prevents autophagy by phosphorylating RUBCNL/Pacer under nutrient-rich conditions. mTORC1 exerts a feedback control on upstream growth factor signaling that includes phosphorylation and activation of GRB10 a INSR-dependent signaling suppressor. Among other potential targets mTORC1 may phosphorylate CLIP1 and regulate microtubules. As part of the mTORC2 complex MTOR may regulate other cellular processes including survival and organization of the cytoskeleton. Plays a critical role in the phosphorylation at 'Ser-473' of AKT1, a pro-survival effector of phosphoinositide 3-kinase, facilitating its activation by PDK1. mTORC2 may regulate the actin cytoskeleton, through phosphorylation of PRKCA, PXN and activation of the Rho-type guanine nucleotide exchange factors RHOA and RAC1A or RAC1B. mTORC2 also regulates the phosphorylation of SGK1 at 'Ser-422'. Regulates osteoclastogenesis by adjusting the expression of CEBPB isoforms. Plays an important regulatory role in the circadian clock function; regulates period length and rhythm amplitude of the suprachiasmatic nucleus (SCN) and liver clocks. Serine/threonine protein kinase which is a central regulator of cellular metabolism, growth and survival in response to hormones, growth factors, nutrients, energy and stress signals.
|
||||
| BioChemical Class |
Kinase
|
||||
| UniProt ID | |||||
| EC Number |
EC 2.7.11.1
|
||||
| Sequence |
MLGTGPAAATTAATTSSNVSVLQQFASGLKSRNEETRAKAAKELQHYVTMELREMSQEES
TRFYDQLNHHIFELVSSSDANERKGGILAIASLIGVEGGNATRIGRFANYLRNLLPSNDP VVMEMASKAIGRLAMAGDTFTAEYVEFEVKRALEWLGADRNEGRRHAAVLVLRELAISVP TFFFQQVQPFFDNIFVAVWDPKQAIREGAVAALRACLILTTQREPKEMQKPQWYRHTFEE AEKGFDETLAKEKGMNRDDRIHGALLILNELVRISSMEGERLREEMEEITQQQLVHDKYC KDLMGFGTKPRHITPFTSFQAVQPQQSNALVGLLGYSSHQGLMGFGTSPSPAKSTLVESR CCRDLMEEKFDQVCQWVLKCRNSKNSLIQMTILNLLPRLAAFRPSAFTDTQYLQDTMNHV LSCVKKEKERTAAFQALGLLSVAVRSEFKVYLPRVLDIIRAALPPKDFAHKRQKAMQVDA TVFTCISMLARAMGPGIQQDIKELLEPMLAVGLSPALTAVLYDLSRQIPQLKKDIQDGLL KMLSLVLMHKPLRHPGMPKGLAHQLASPGLTTLPEASDVGSITLALRTLGSFEFEGHSLT QFVRHCADHFLNSEHKEIRMEAARTCSRLLTPSIHLISGHAHVVSQTAVQVVADVLSKLL VVGITDPDPDIRYCVLASLDERFDAHLAQAENLQALFVALNDQVFEIRELAICTVGRLSS MNPAFVMPFLRKMLIQILTELEHSGIGRIKEQSARMLGHLVSNAPRLIRPYMEPILKALI LKLKDPDPDPNPGVINNVLATIGELAQVSGLEMRKWVDELFIIIMDMLQDSSLLAKRQVA LWTLGQLVASTGYVVEPYRKYPTLLEVLLNFLKTEQNQGTRREAIRVLGLLGALDPYKHK VNIGMIDQSRDASAVSLSESKSSQDSSDYSTSEMLVNMGNLPLDEFYPAVSMVALMRIFR DQSLSHHHTMVVQAITFIFKSLGLKCVQFLPQVMPTFLNVIRVCDGAIREFLFQQLGMLV SFVKSHIRPYMDEIVTLMREFWVMNTSIQSTIILLIEQIVVALGGEFKLYLPQLIPHMLR VFMHDNSPGRIVSIKLLAAIQLFGANLDDYLHLLLPPIVKLFDAPEAPLPSRKAALETVD RLTESLDFTDYASRIIHPIVRTLDQSPELRSTAMDTLSSLVFQLGKKYQIFIPMVNKVLV RHRINHQRYDVLICRIVKGYTLADEEEDPLIYQHRMLRSGQGDALASGPVETGPMKKLHV STINLQKAWGAARRVSKDDWLEWLRRLSLELLKDSSSPSLRSCWALAQAYNPMARDLFNA AFVSCWSELNEDQQDELIRSIELALTSQDIAEVTQTLLNLAEFMEHSDKGPLPLRDDNGI VLLGERAAKCRAYAKALHYKELEFQKGPTPAILESLISINNKLQQPEAAAGVLEYAMKHF GELEIQATWYEKLHEWEDALVAYDKKMDTNKDDPELMLGRMRCLEALGEWGQLHQQCCEK WTLVNDETQAKMARMAAAAAWGLGQWDSMEEYTCMIPRDTHDGAFYRAVLALHQDLFSLA QQCIDKARDLLDAELTAMAGESYSRAYGAMVSCHMLSELEEVIQYKLVPERREIIRQIWW ERLQGCQRIVEDWQKILMVRSLVVSPHEDMRTWLKYASLCGKSGRLALAHKTLVLLLGVD PSRQLDHPLPTVHPQVTYAYMKNMWKSARKIDAFQHMQHFVQTMQQQAQHAIATEDQQHK QELHKLMARCFLKLGEWQLNLQGINESTIPKVLQYYSAATEHDRSWYKAWHAWAVMNFEA VLHYKHQNQARDEKKKLRHASGANITNATTAATTAATATTTASTEGSNSESEAESTENSP TPSPLQKKVTEDLSKTLLMYTVPAVQGFFRSISLSRGNNLQDTLRVLTLWFDYGHWPDVN EALVEGVKAIQIDTWLQVIPQLIARIDTPRPLVGRLIHQLLTDIGRYHPQALIYPLTVAS KSTTTARHNAANKILKNMCEHSNTLVQQAMMVSEELIRVAILWHEMWHEGLEEASRLYFG ERNVKGMFEVLEPLHAMMERGPQTLKETSFNQAYGRDLMEAQEWCRKYMKSGNVKDLTQA WDLYYHVFRRISKQLPQLTSLELQYVSPKLLMCRDLELAVPGTYDPNQPIIRIQSIAPSL QVITSKQRPRKLTLMGSNGHEFVFLLKGHEDLRQDERVMQLFGLVNTLLANDPTSLRKNL SIQRYAVIPLSTNSGLIGWVPHCDTLHALIRDYREKKKILLNIEHRIMLRMAPDYDHLTL MQKVEVFEHAVNNTAGDDLAKLLWLKSPSSEVWFDRRTNYTRSLAVMSMVGYILGLGDRH PSNLMLDRLSGKILHIDFGDCFEVAMTREKFPEKIPFRLTRMLTNAMEVTGLDGNYRITC HTVMEVLREHKDSVMAVLEAFVYDPLLNWRLMDTNTKGNKRSRTRTDSYSAGQSVEILDG VELGEPAHKKTGTTVPESIHSFIGDGLVKPEALNKKAIQIINRVRDKLTGRDFSHDDTLD VPTQVELLIKQATSHENLCQCYIGWCPFW |
||||
| Drugs and Modes of Action | Top | ||||
|---|---|---|---|---|---|
| Drugs in Phase 2 Trial | [+] 1 Drugs in Phase 2 Trial | + | |||
| 1 | Sirolimus | Drug Info | Phase 2 Trial | COVID-19 | [2] |
| Investigative agents | [+] 3 Investigative agents | + | |||
| 1 | Sapanisertib | Drug Info | Investigative | COVID-19 | [3] |
| 2 | Rapamycin | Drug Info | Investigative | MERS | [1] |
| 3 | Everolimus | Drug Info | Investigative | MERS | [1] |
| Mode of Action | [+] 1 Modes of Action | + | |||
| Inhibitor | [+] 4 Inhibitor drugs | + | |||
| 1 | Sirolimus | Drug Info | [4] | ||
| 2 | Everolimus | Drug Info | [1] | ||
| 3 | Rapamycin | Drug Info | [1] | ||
| 4 | Sapanisertib | Drug Info | [3] | ||
| Tissue/Disease-Specific Protein Abundances of This Target | Top | ||||
|---|---|---|---|---|---|
| Tissue-specific Protein Abundances in Healthy Individuals | Click to Show/Hide | ||||
|
|||||
| ICD Disease Classification 01 | Certain infectious or parasitic disease | Click to Show/Hide | |||
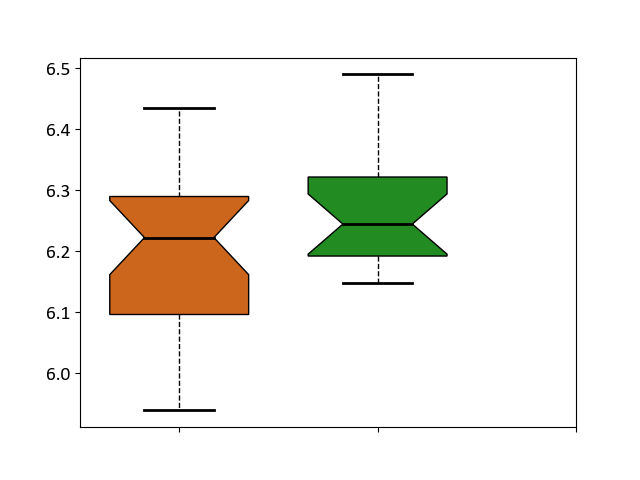
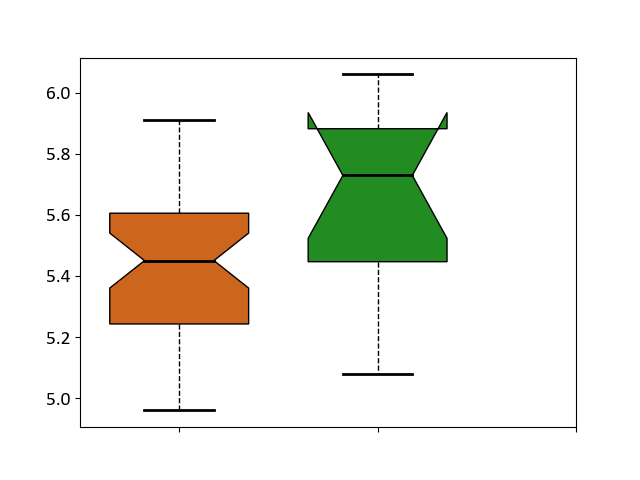
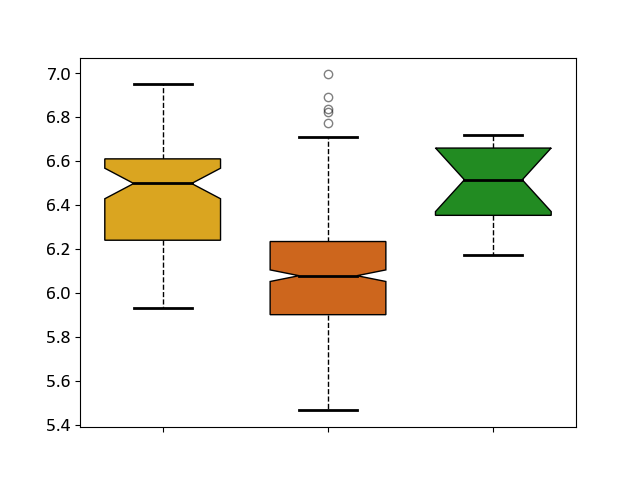
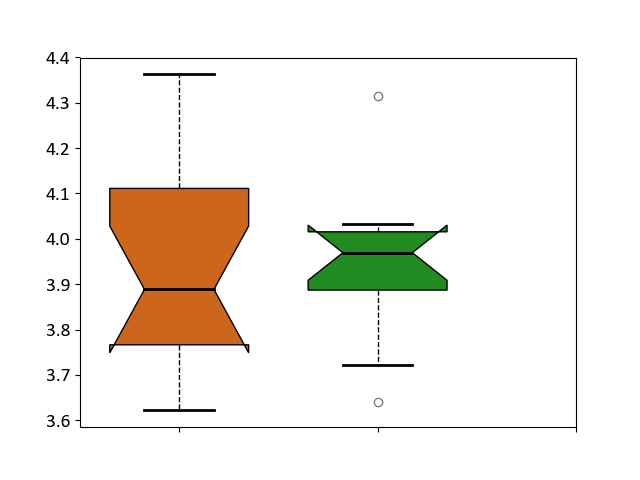
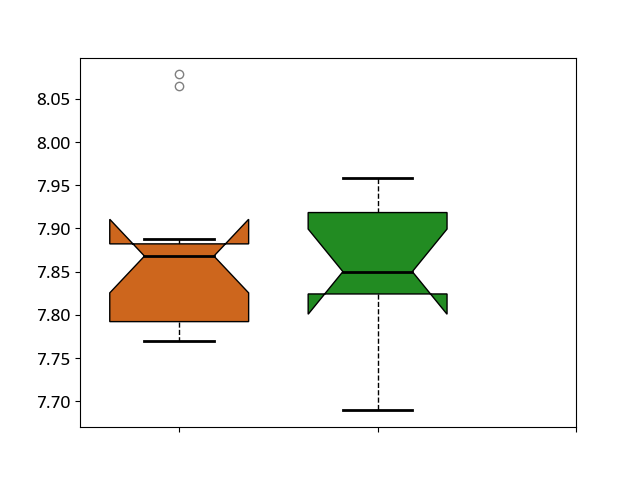
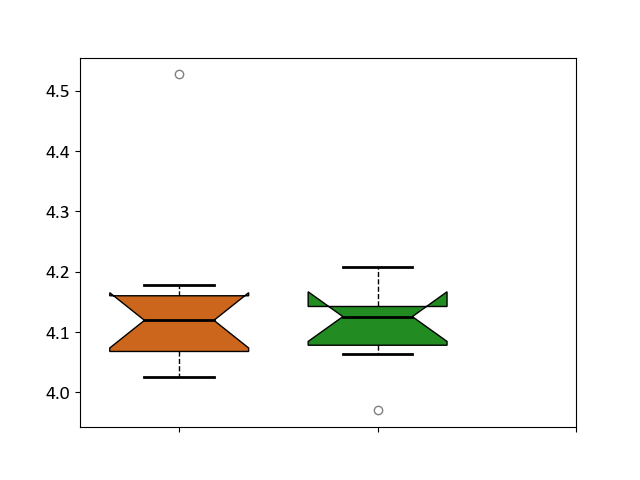
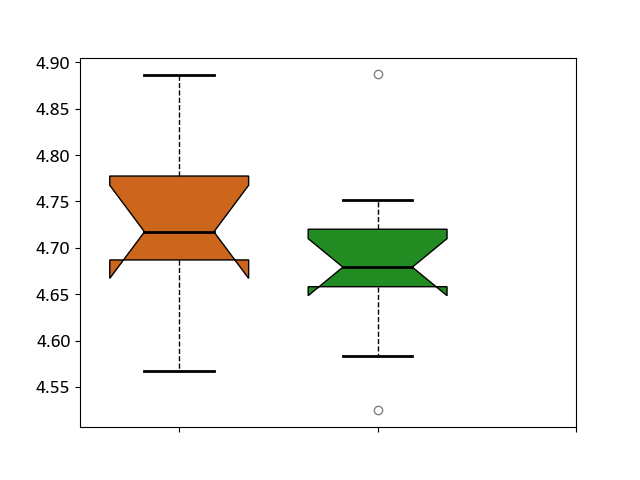
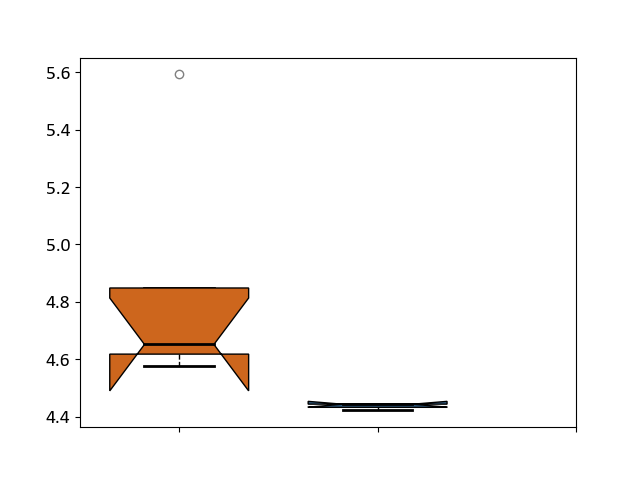
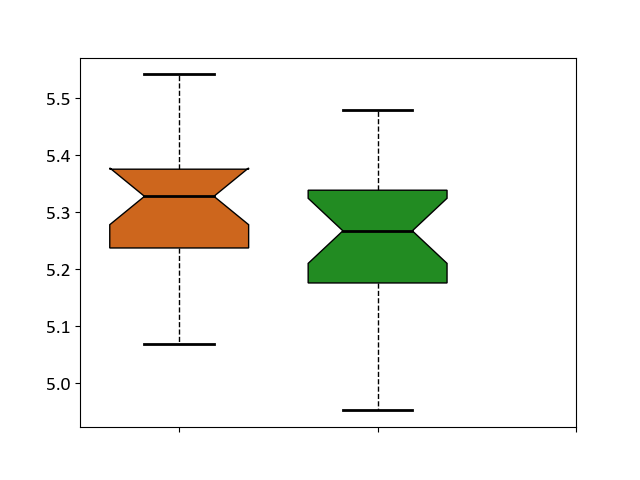
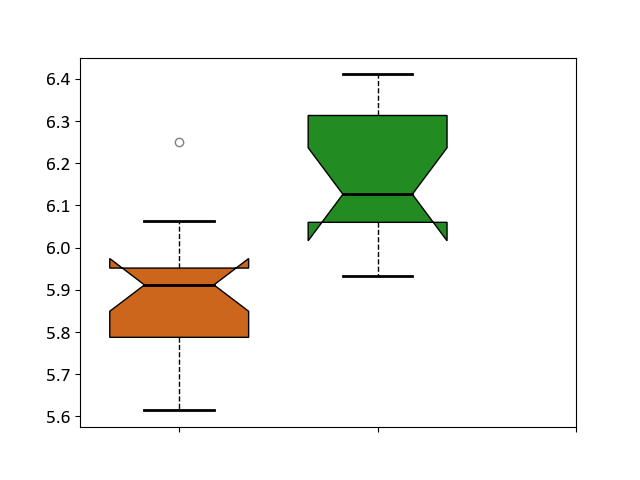
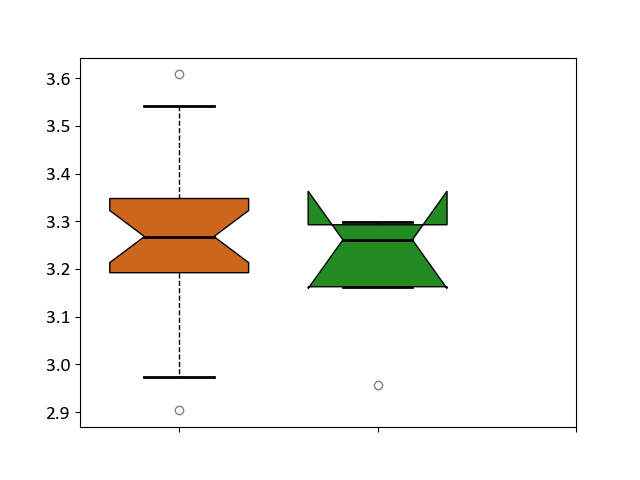
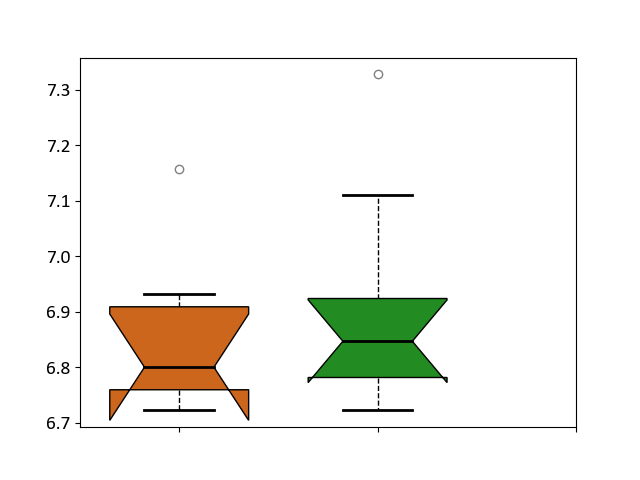
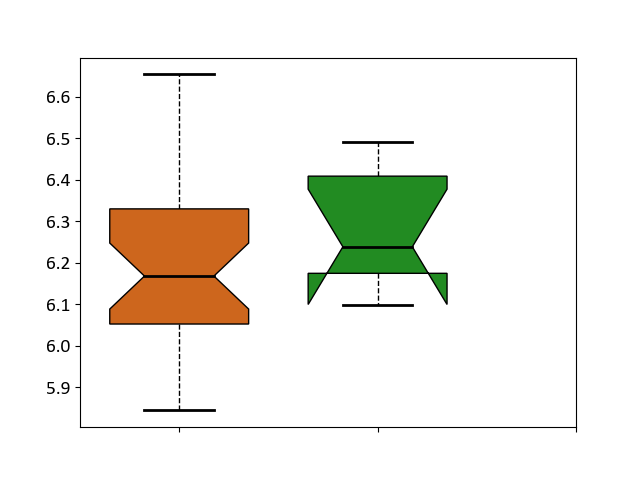
| ICD-11: 1C1H | Necrotising ulcerative gingivitis | Click to Show/Hide | |||
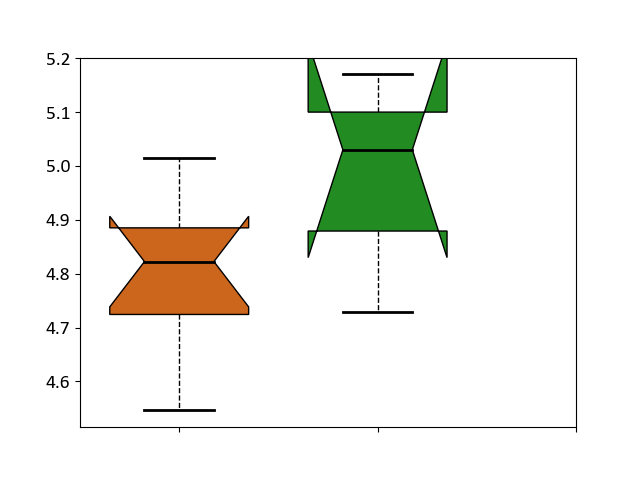
| The Studied Tissue | Gingival tissue | ||||
| The Specified Disease | Bacterial infection of gingival [ICD-11:1C1H] | ||||
| The Expression Level of Disease Section Compare with the Healthy Individual Tissue | p-value: 0.987234744; Fold-change: 0.023285812; Z-score: 0.120692987 | ||||
|
Target expression in the diseased tissue of patients
Target expression in the normal tissue of healthy individuals
|
|||||
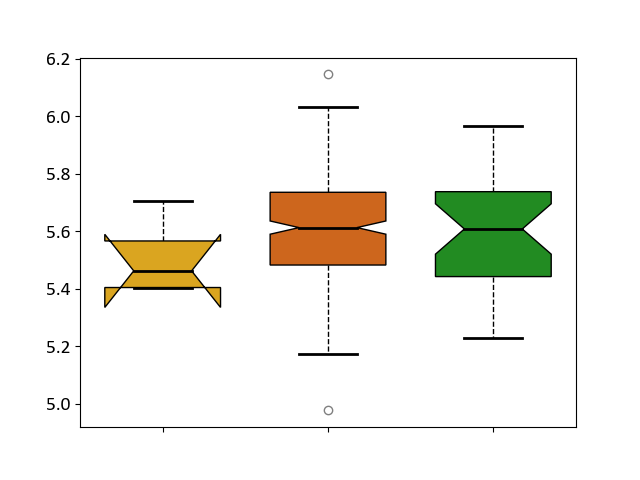
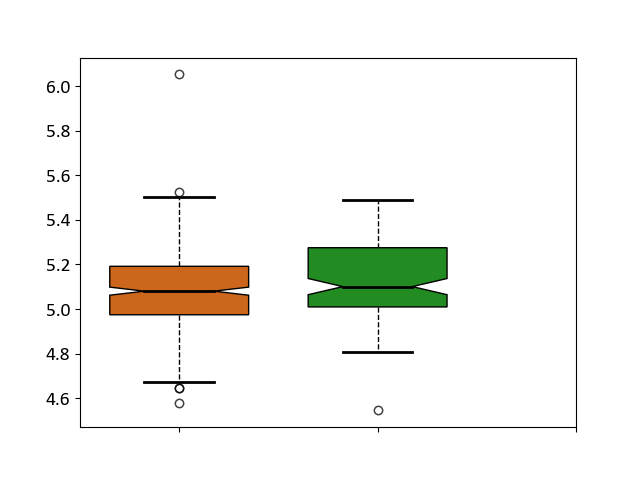
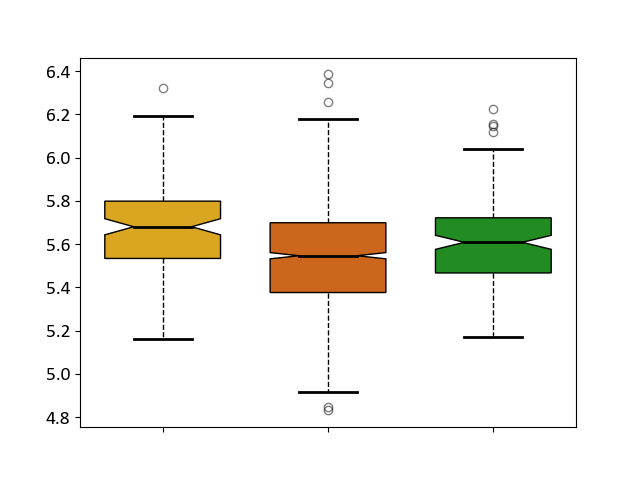
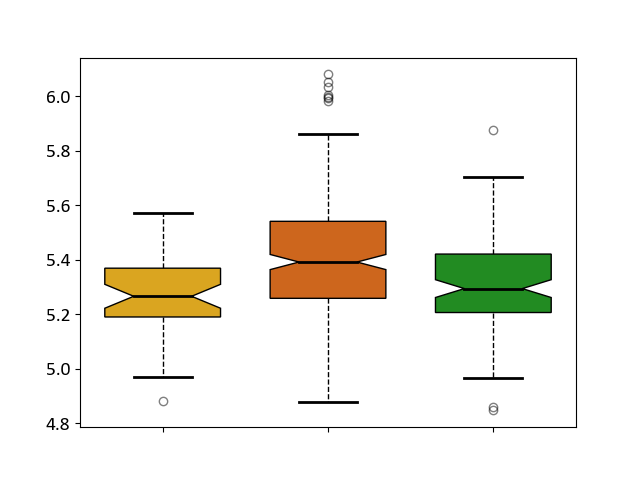
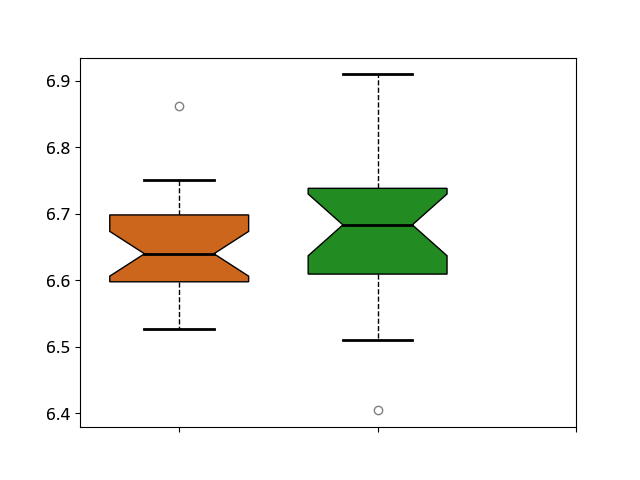
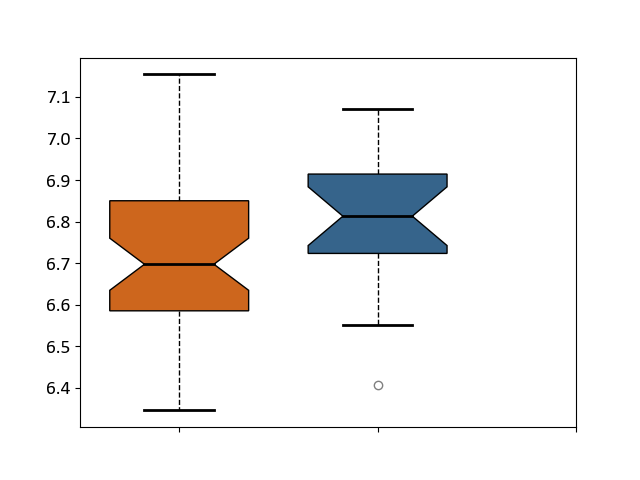
| Boxplot of Target Disease-specific Protein Abundances |

|
Click to View the Clearer Original Diagram | |||
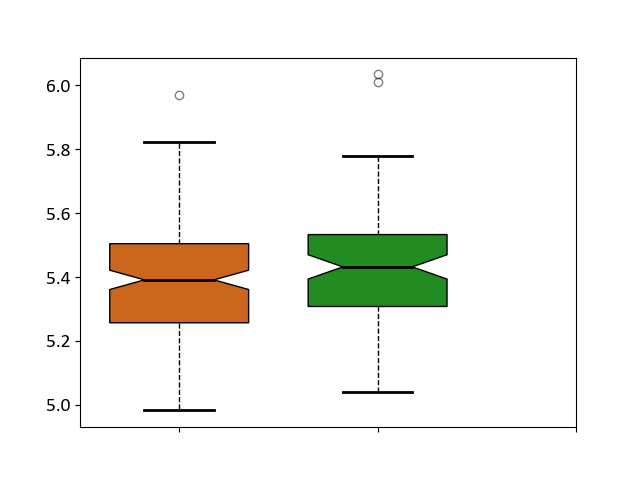
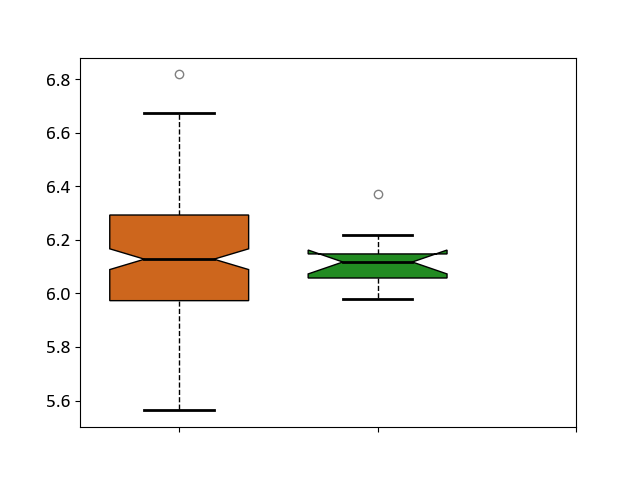
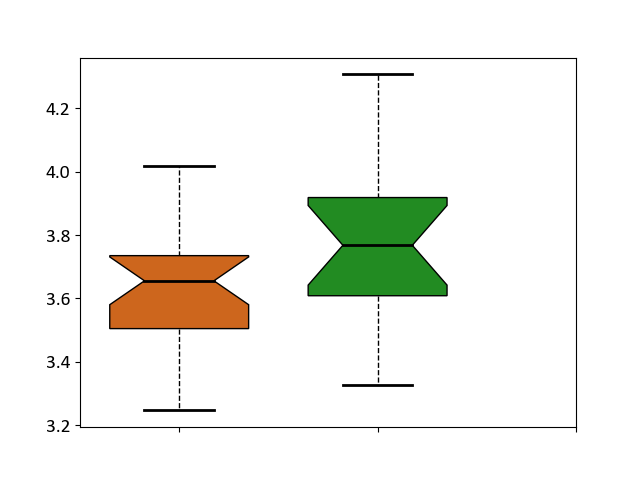
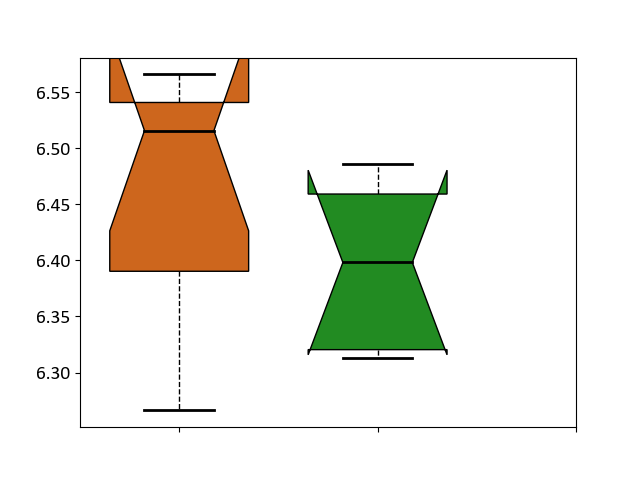
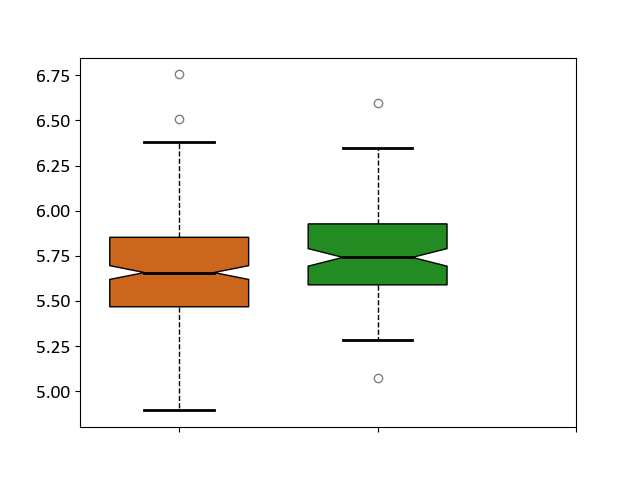
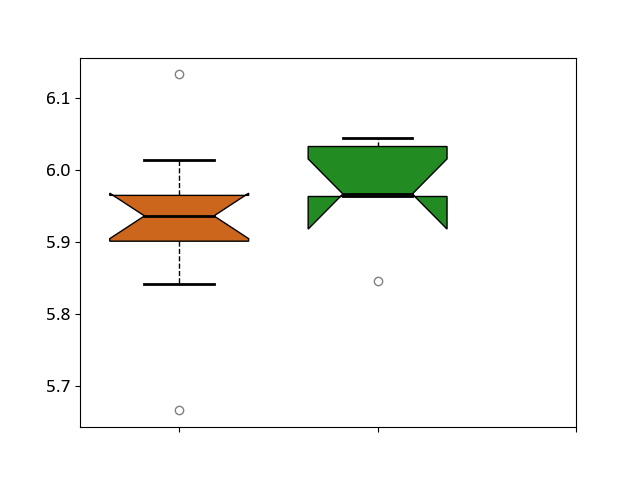
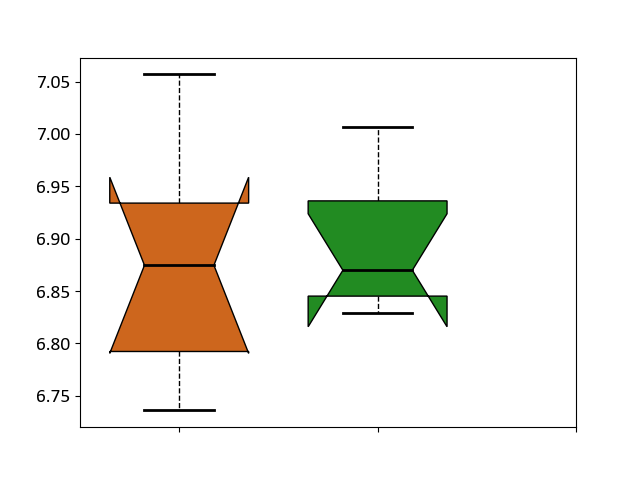
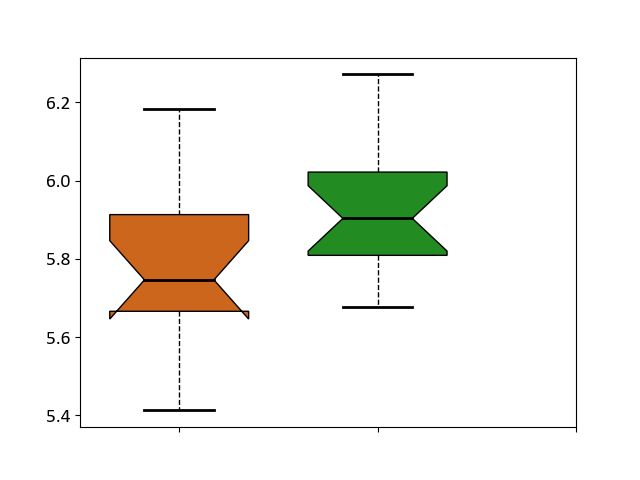
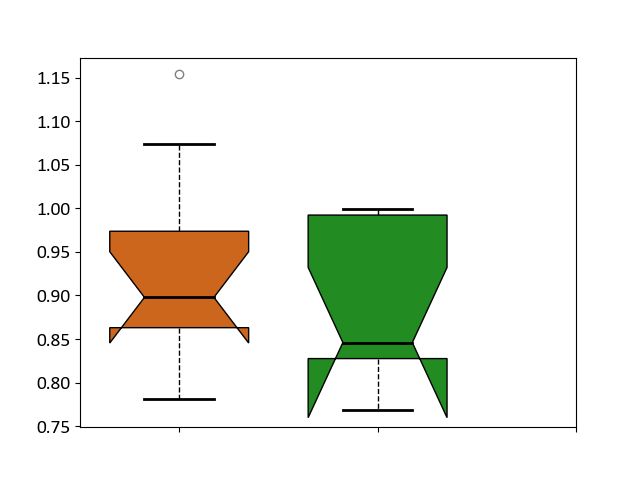
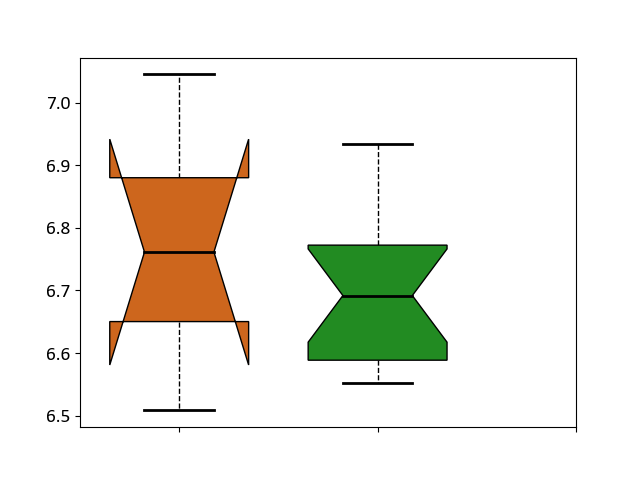
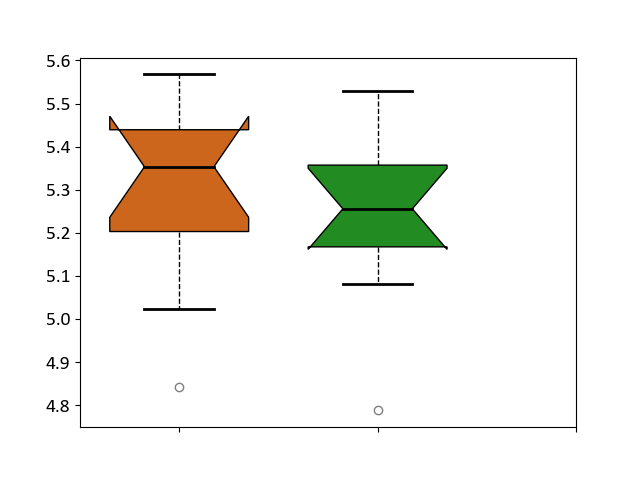
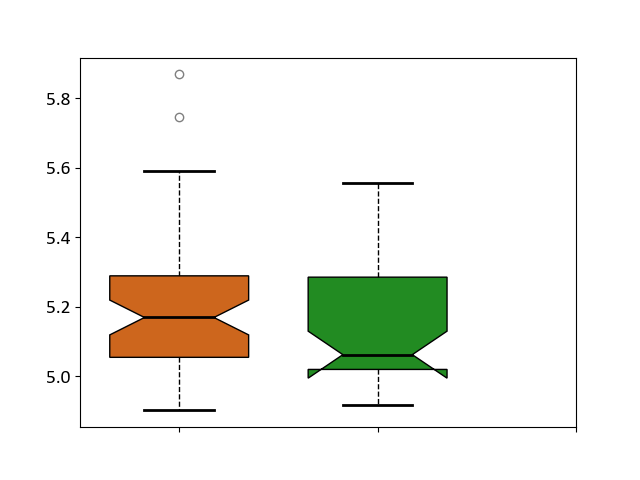
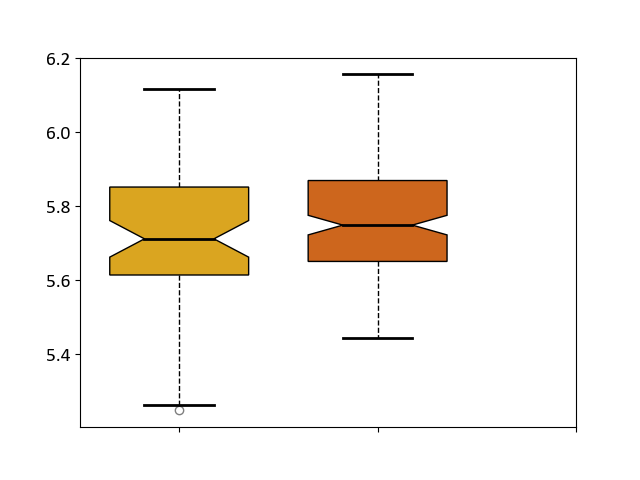
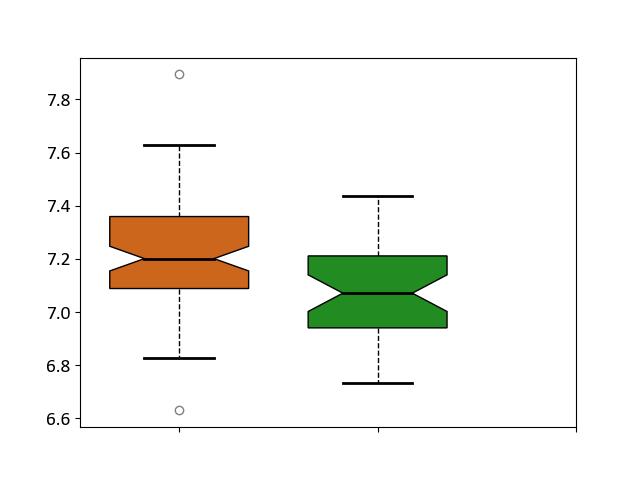
| ICD-11: 1E30 | Influenza | Click to Show/Hide | |||
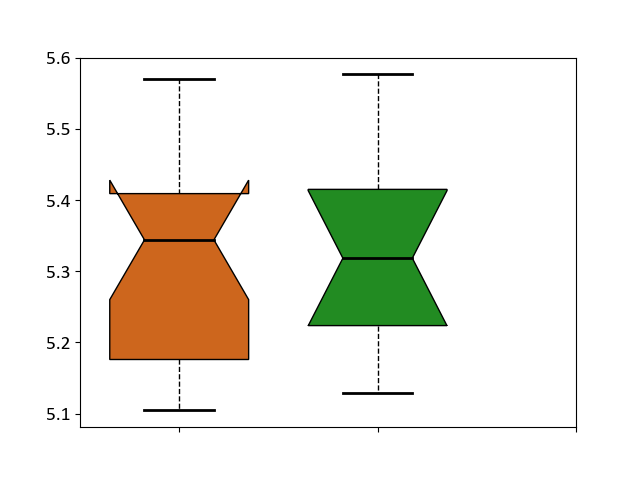
| The Studied Tissue | Whole blood | ||||
| The Specified Disease | Influenza [ICD-11:1.00E+30] | ||||
| The Expression Level of Disease Section Compare with the Healthy Individual Tissue | p-value: 0.325831682; Fold-change: -0.207431489; Z-score: -0.91949824 | ||||
|
Target expression in the diseased tissue of patients
Target expression in the normal tissue of healthy individuals
|
|||||
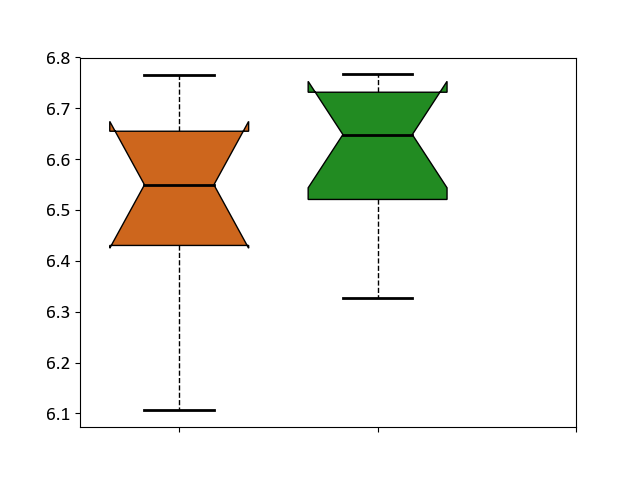
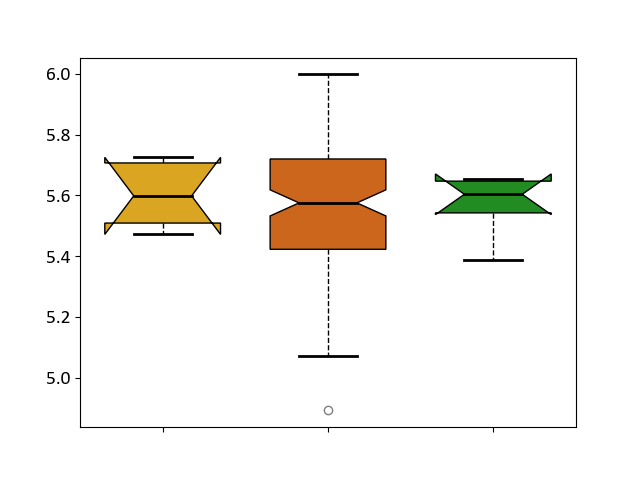
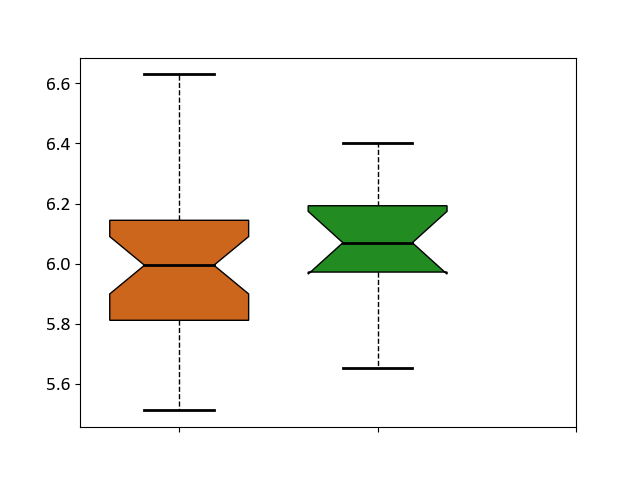
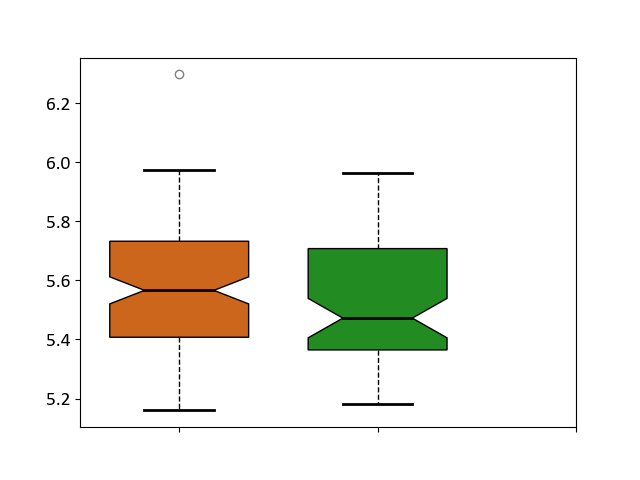
| Boxplot of Target Disease-specific Protein Abundances |
|
Click to View the Clearer Original Diagram | |||
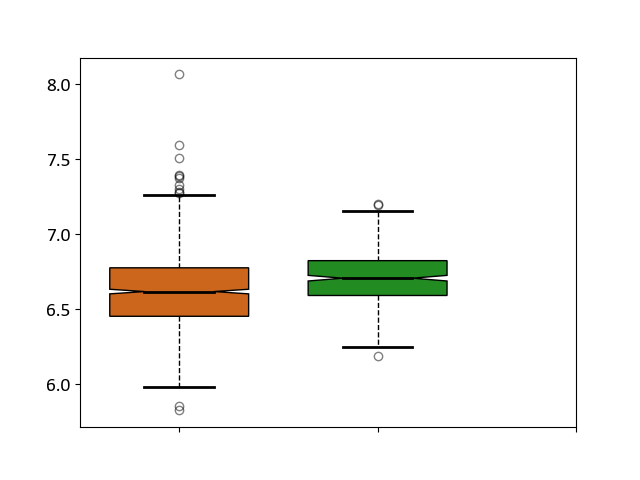
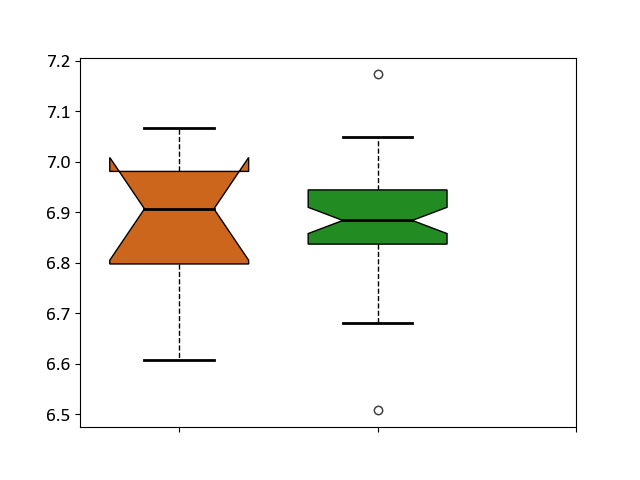
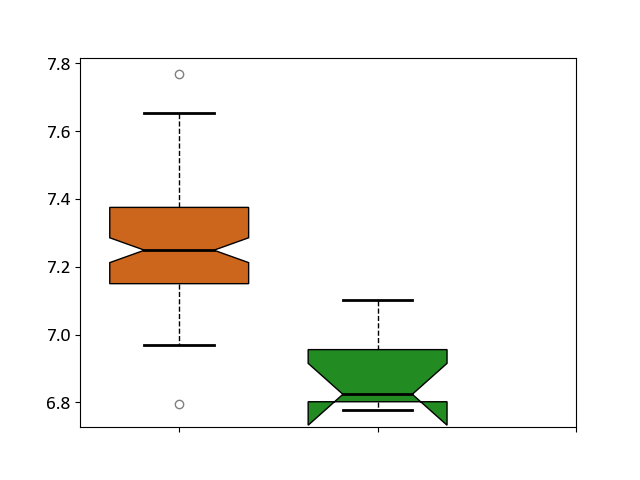
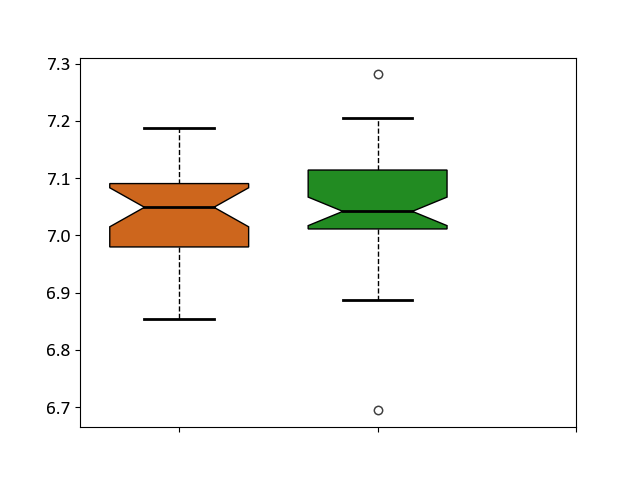
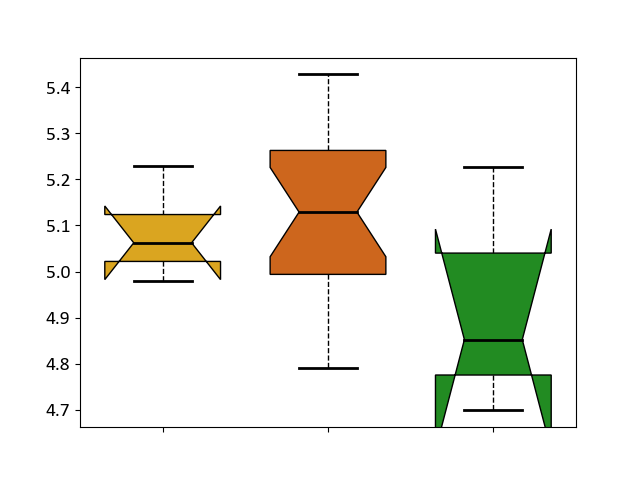
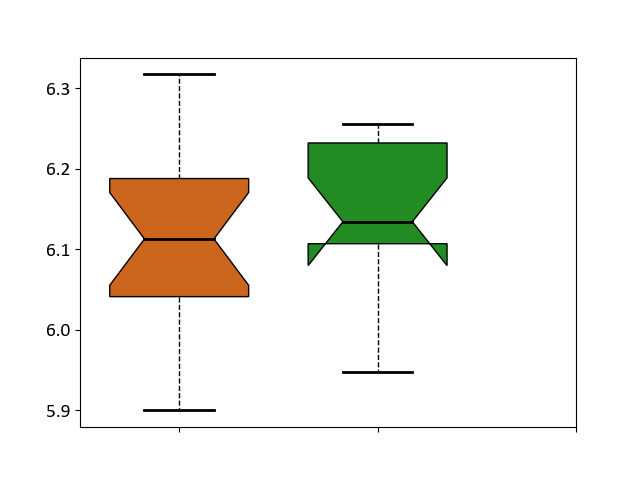
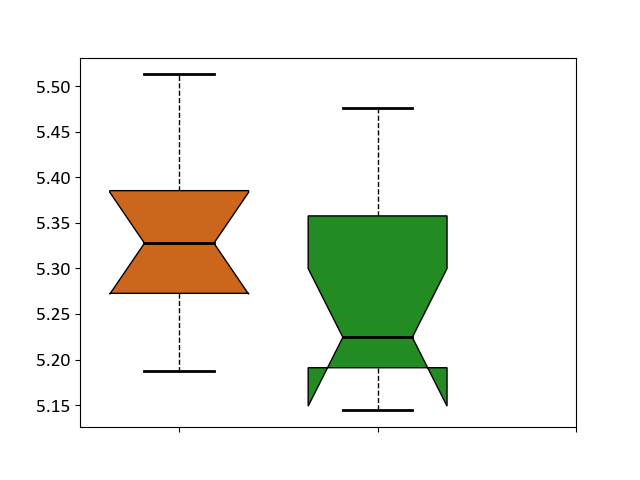
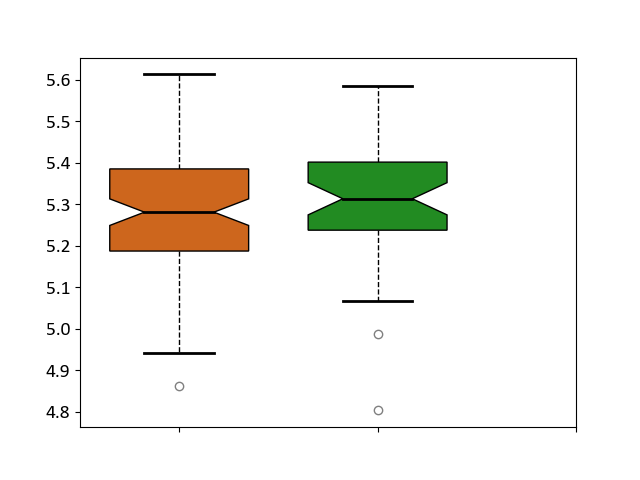
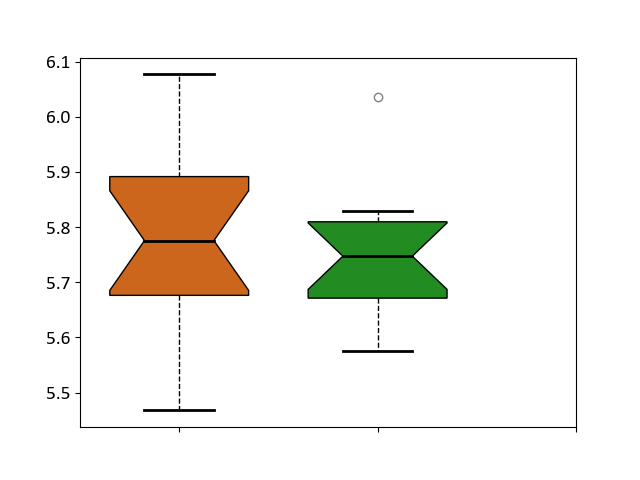
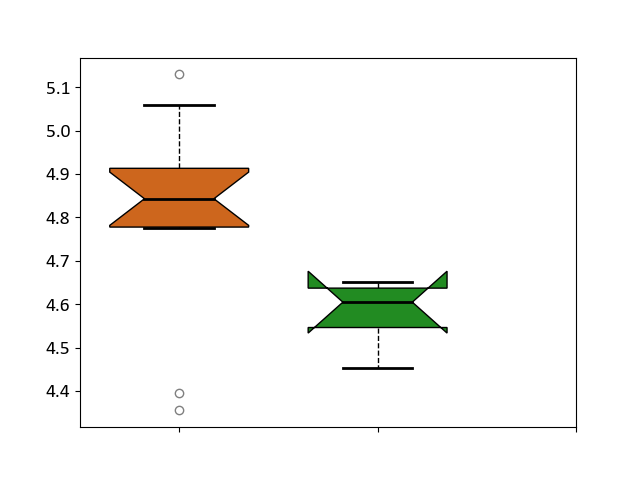
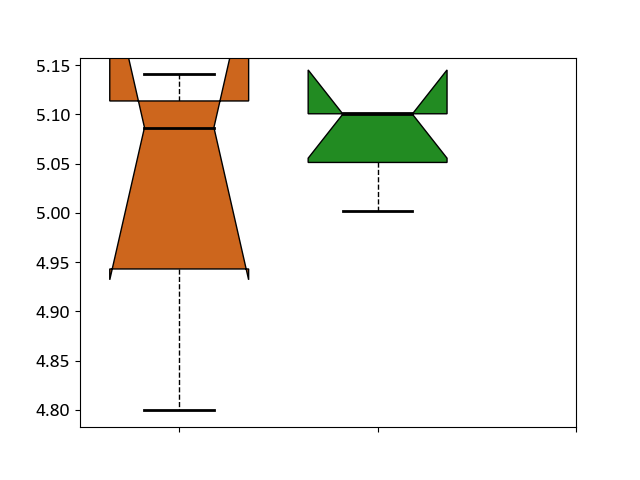
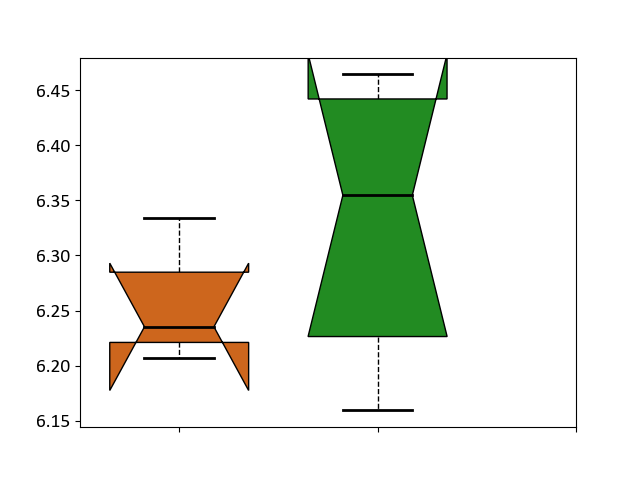
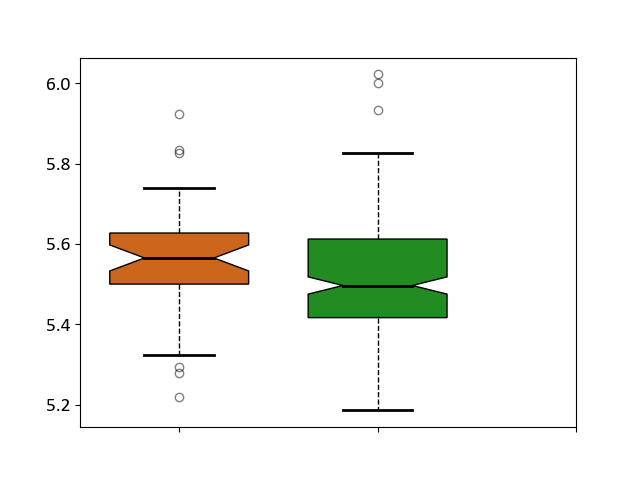
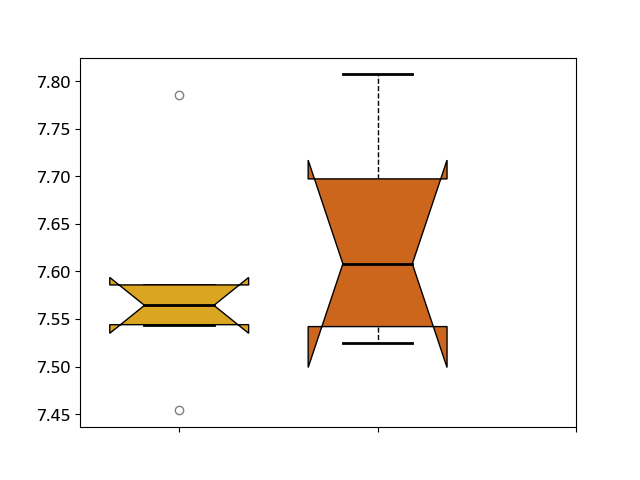
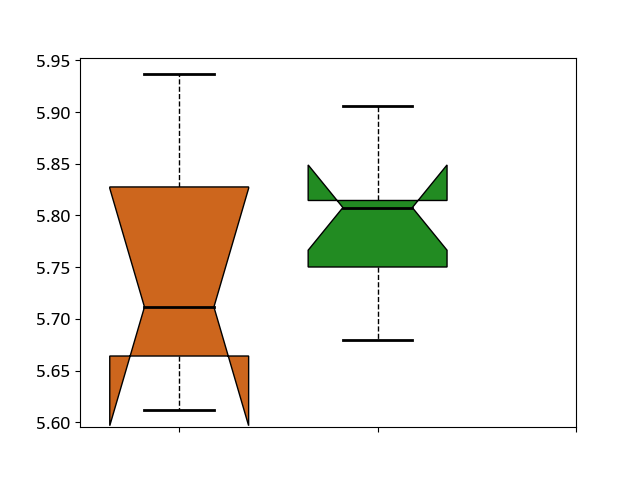
| ICD-11: 1E51 | Chronic viral hepatitis | Click to Show/Hide | |||
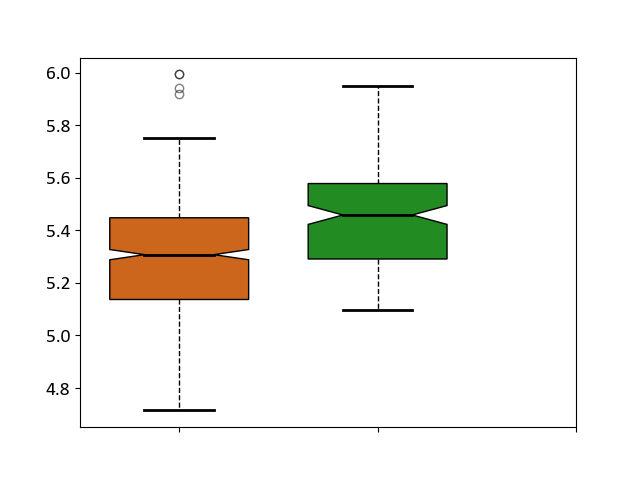
| The Studied Tissue | Whole blood | ||||
| The Specified Disease | Chronic hepatitis C [ICD-11:1E51.1] | ||||
| The Expression Level of Disease Section Compare with the Healthy Individual Tissue | p-value: 0.644029455; Fold-change: 0.025703196; Z-score: 0.18979333 | ||||
|
Target expression in the diseased tissue of patients
Target expression in the normal tissue of healthy individuals
|
|||||
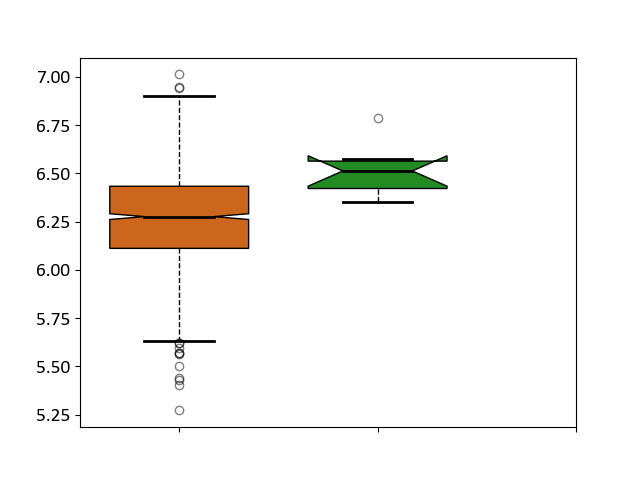
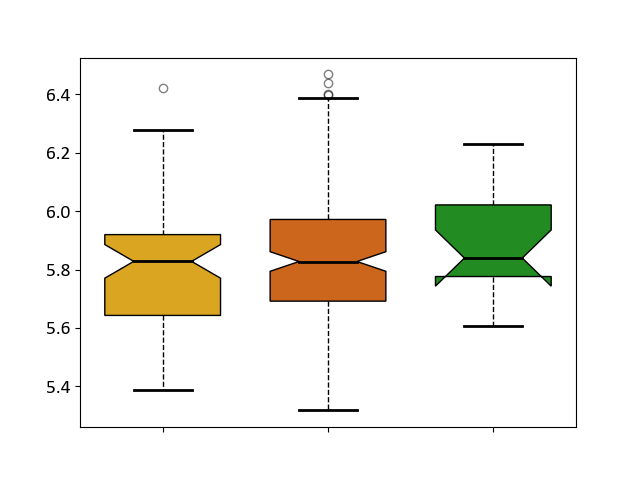
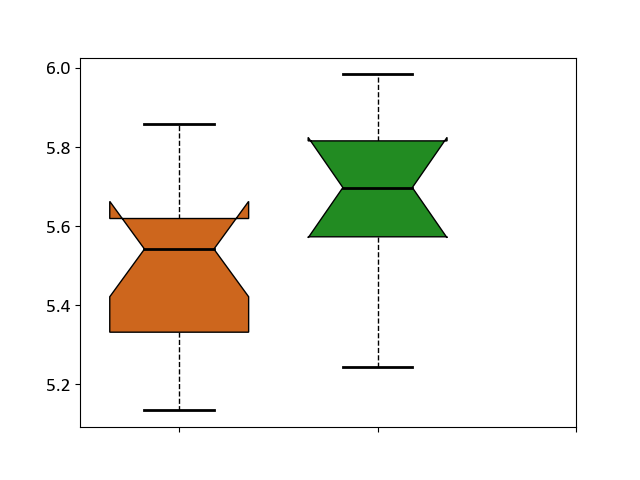
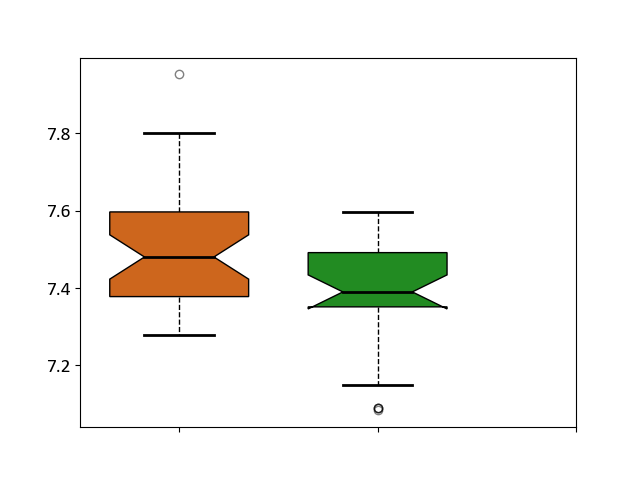
| Boxplot of Target Disease-specific Protein Abundances |
|
Click to View the Clearer Original Diagram | |||
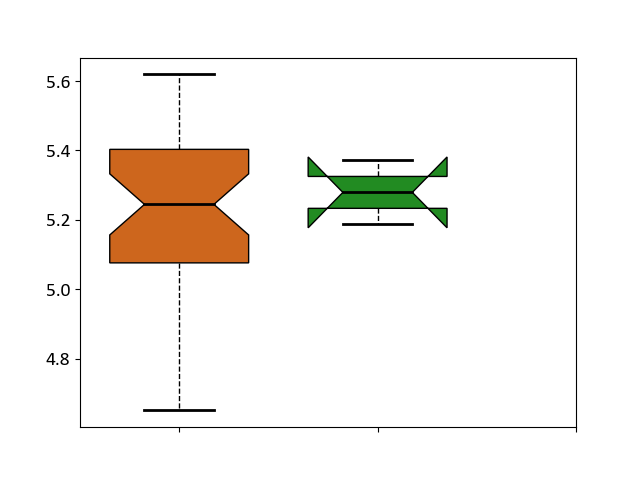
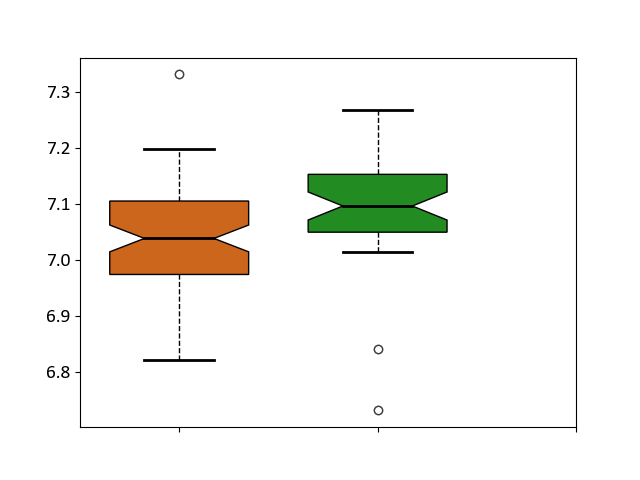
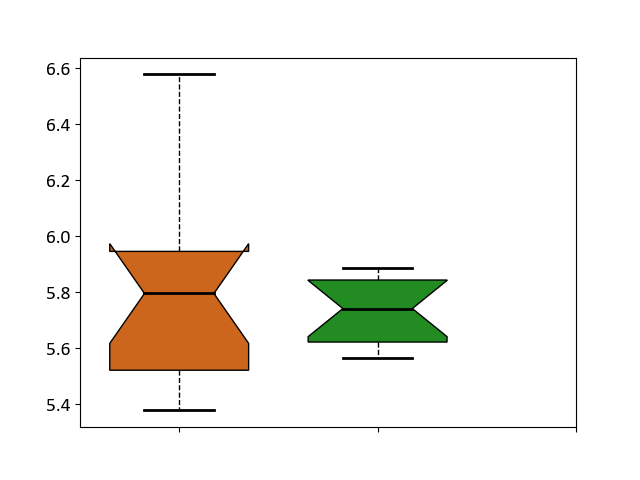
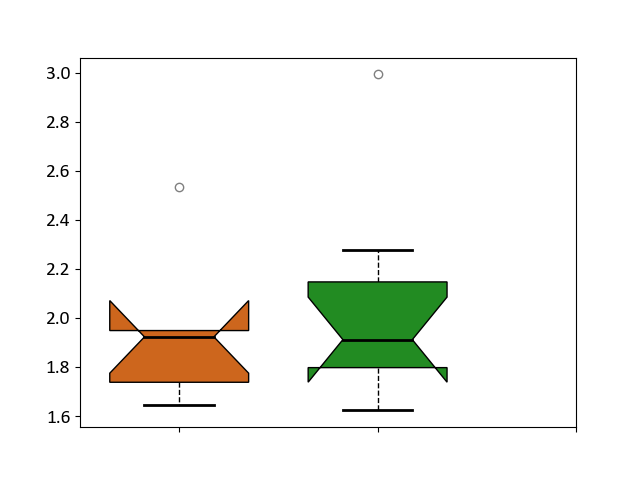
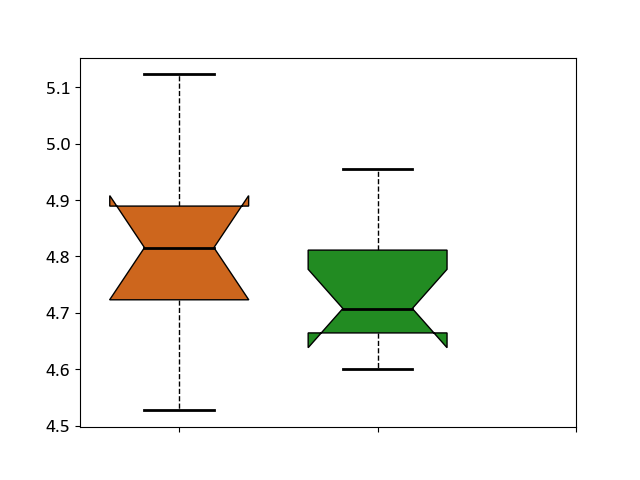
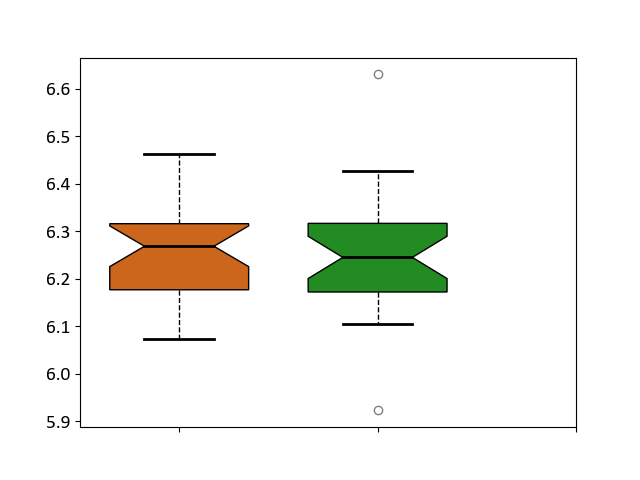
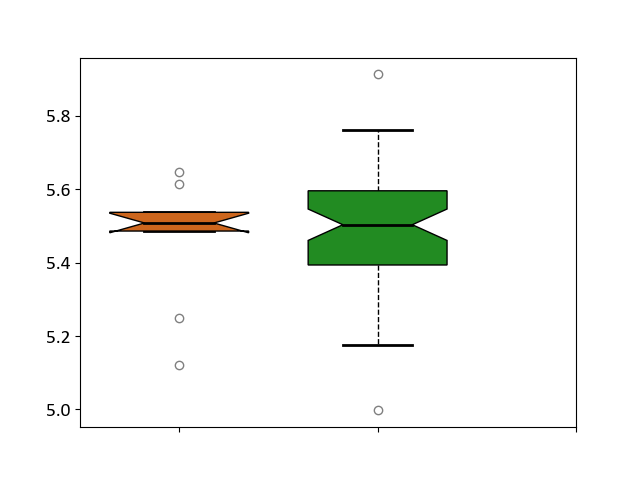
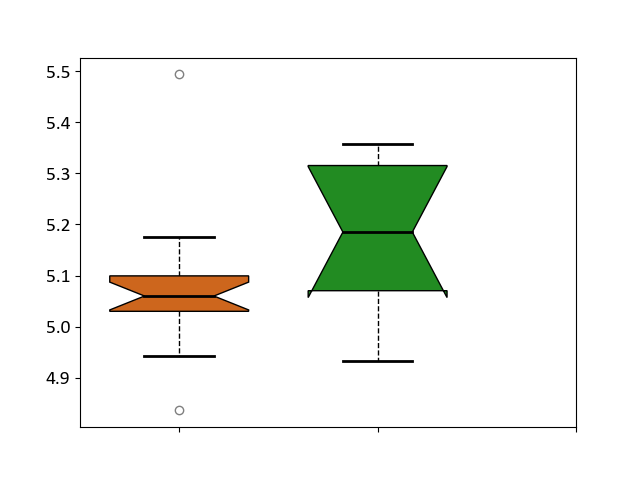
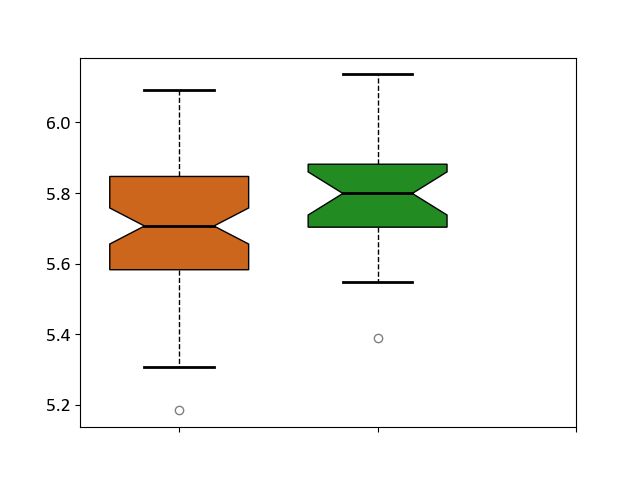
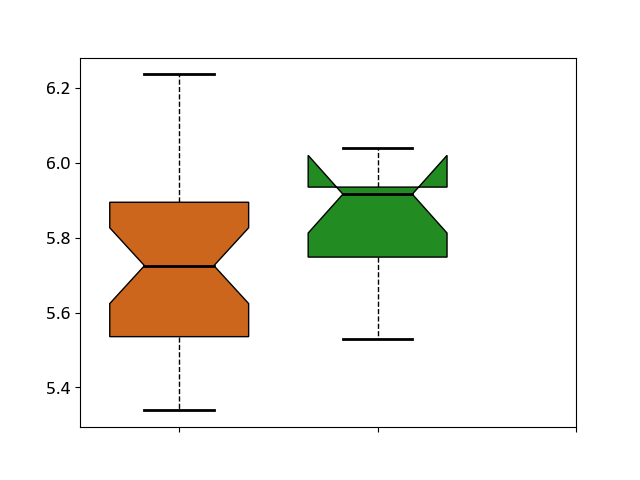
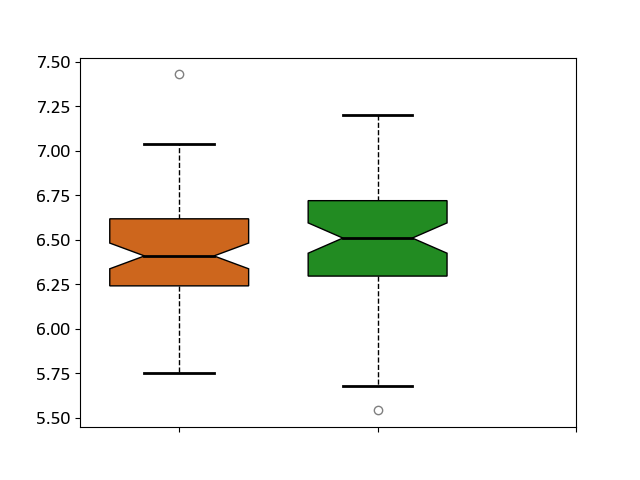
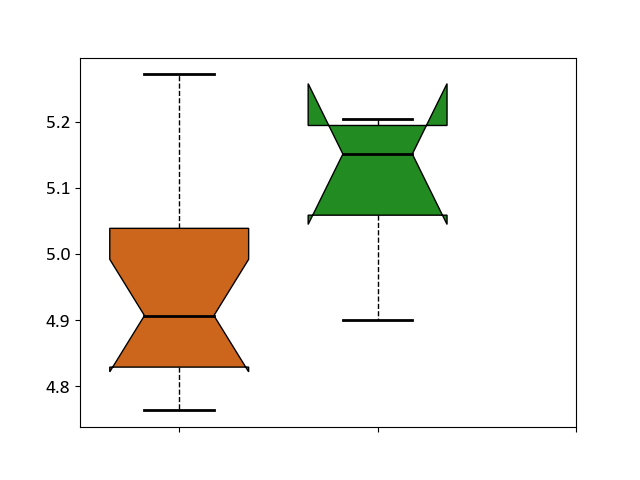
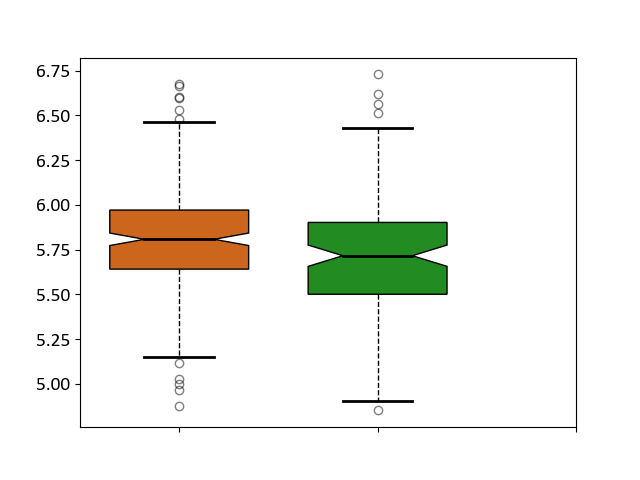
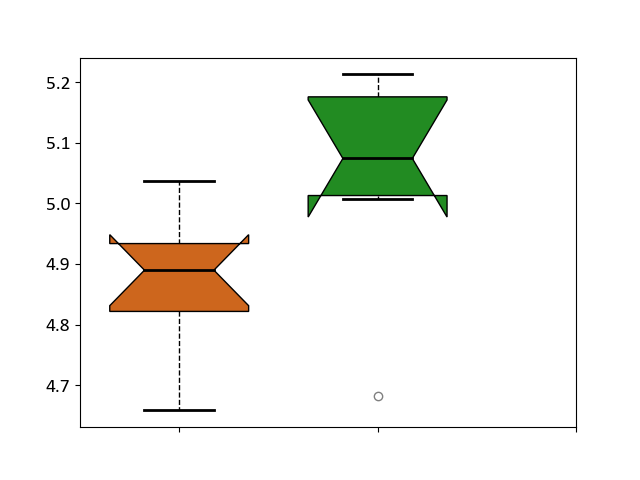
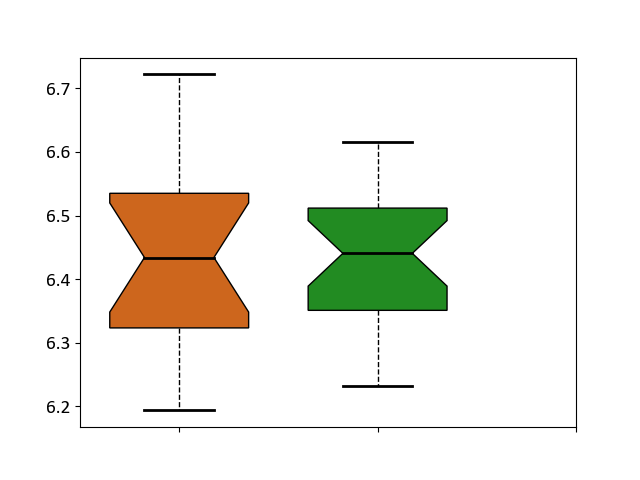
| ICD-11: 1G41 | Sepsis with septic shock | Click to Show/Hide | |||
| The Studied Tissue | Whole blood | ||||
| The Specified Disease | Sepsis with septic shock [ICD-11:1G41] | ||||
| The Expression Level of Disease Section Compare with the Healthy Individual Tissue | p-value: 7.56E-15; Fold-change: -0.150850668; Z-score: -0.712854246 | ||||
|
Target expression in the diseased tissue of patients
Target expression in the normal tissue of healthy individuals
|
|||||
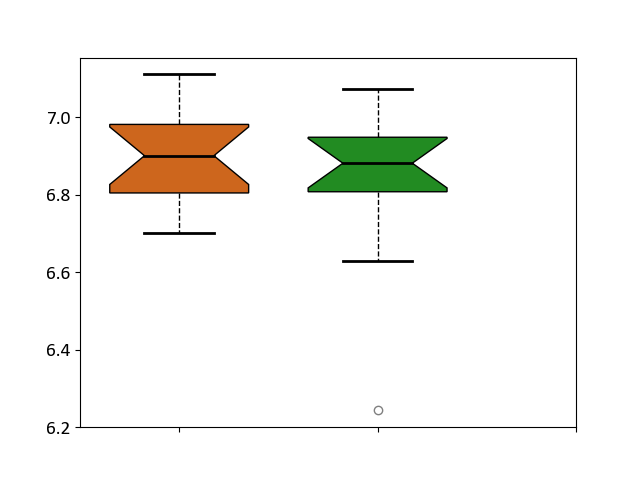
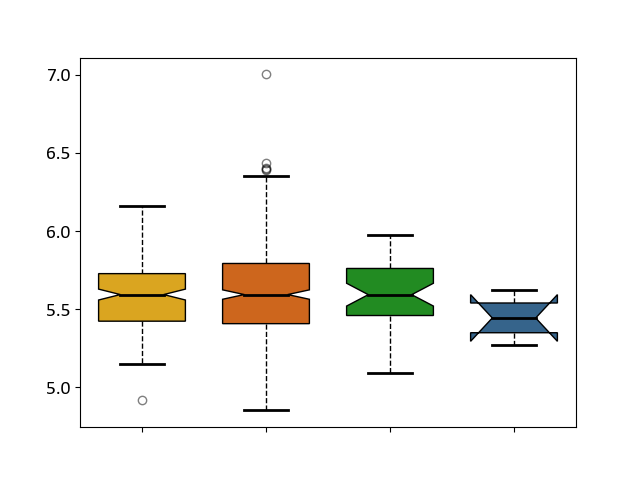
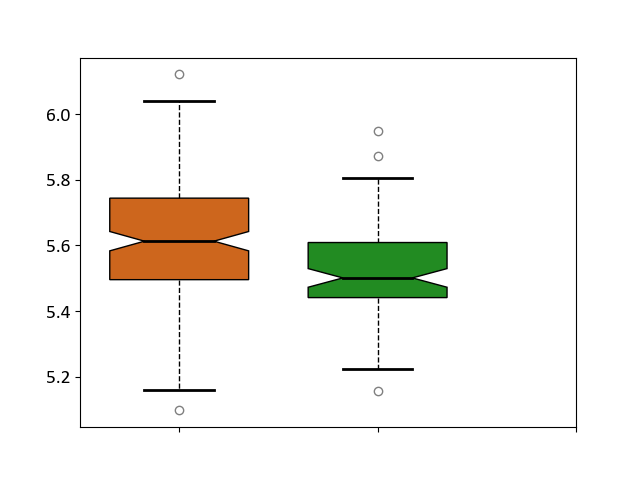
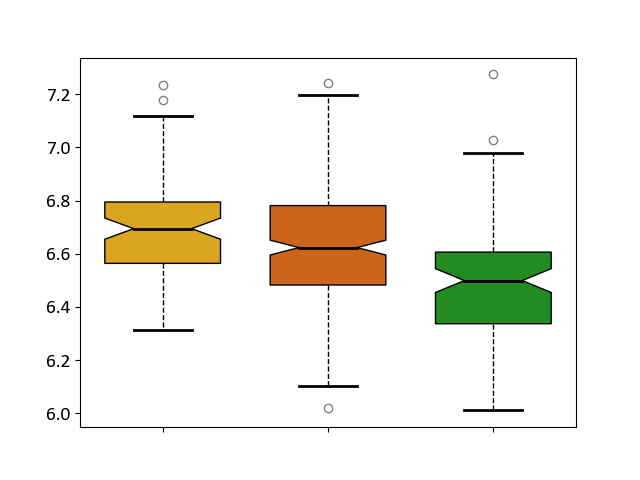
| Boxplot of Target Disease-specific Protein Abundances |
|
Click to View the Clearer Original Diagram | |||
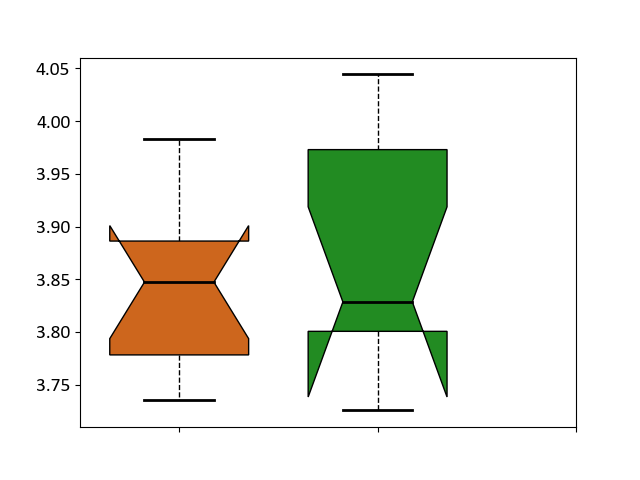
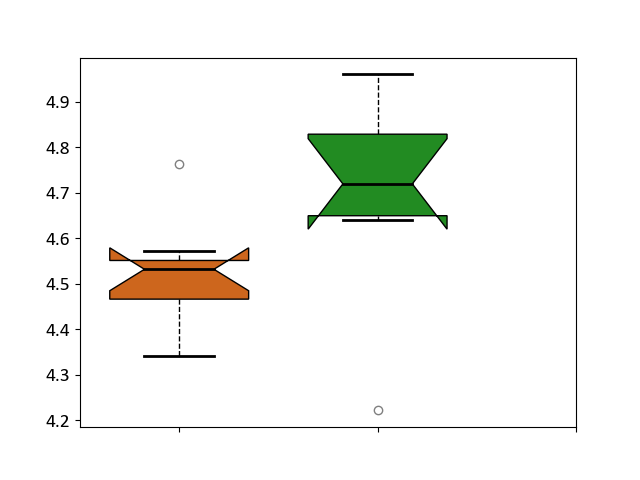
| ICD-11: CA40 | Respiratory syncytial virus infection | Click to Show/Hide | |||
| The Studied Tissue | Peripheral blood | ||||
| The Specified Disease | Pediatric respiratory syncytial virus infection [ICD-11:CA40.11] | ||||
| The Expression Level of Disease Section Compare with the Healthy Individual Tissue | p-value: 0.100938908; Fold-change: -0.022139561; Z-score: -0.226148663 | ||||
|
Target expression in the diseased tissue of patients
Target expression in the normal tissue of healthy individuals
|
|||||
| Boxplot of Target Disease-specific Protein Abundances |
|
Click to View the Clearer Original Diagram | |||
| ICD-11: CA42 | Rhinovirus infection | Click to Show/Hide | |||
| The Studied Tissue | Nasal epithelium tissue | ||||
| The Specified Disease | Rhinovirus infection [ICD-11:CA42.1] | ||||
| The Expression Level of Disease Section Compare with the Healthy Individual Tissue | p-value: 0.85697789; Fold-change: 0.008266855; Z-score: 0.085772295 | ||||
|
Target expression in the diseased tissue of patients
Target expression in the normal tissue of healthy individuals
|
|||||
| Boxplot of Target Disease-specific Protein Abundances |

|
Click to View the Clearer Original Diagram | |||
| ICD-11: KA60 | Neonatal sepsis | Click to Show/Hide | |||
| The Studied Tissue | Whole blood | ||||
| The Specified Disease | Neonatal sepsis [ICD-11:KA60] | ||||
| The Expression Level of Disease Section Compare with the Healthy Individual Tissue | p-value: 0.068037459; Fold-change: -0.040591301; Z-score: -0.212445212 | ||||
|
Target expression in the diseased tissue of patients
Target expression in the normal tissue of healthy individuals
|
|||||
| Boxplot of Target Disease-specific Protein Abundances |
|
Click to View the Clearer Original Diagram | |||
| ICD Disease Classification 02 | Neoplasm | Click to Show/Hide | |||
| ICD-11: 2A00 | Brain cancer | Click to Show/Hide | |||
| The Studied Tissue | Nervous tissue | ||||
| The Specified Disease | Glioblastopma [ICD-11:2A00.00] | ||||
| The Expression Level of Disease Section Compare with the Healthy Individual Tissue | p-value: 3.79E-15; Fold-change: -0.089239207; Z-score: -0.501295354 | ||||
|
Target expression in the diseased tissue of patients
Target expression in the normal tissue of healthy individuals
|
|||||
| Boxplot of Target Disease-specific Protein Abundances |
|
Click to View the Clearer Original Diagram | |||
| The Studied Tissue | Brain stem tissue | ||||
| The Specified Disease | Glioma [ICD-11:2A00.0Y-2A00.0Z] | ||||
| The Expression Level of Disease Section Compare with the Healthy Individual Tissue | p-value: 0.661790582; Fold-change: -0.034617651; Z-score: -0.266089457 | ||||
|
Target expression in the diseased tissue of patients
Target expression in the normal tissue of healthy individuals
|
|||||
| Boxplot of Target Disease-specific Protein Abundances |
|
Click to View the Clearer Original Diagram | |||
| The Studied Tissue | White matter tissue | ||||
| The Specified Disease | Glioma [ICD-11:2A00.0Y-2A00.0Z] | ||||
| The Expression Level of Disease Section Compare with the Healthy Individual Tissue | p-value: 0.046386748; Fold-change: -0.278528412; Z-score: -0.919312759 | ||||
|
Target expression in the diseased tissue of patients
Target expression in the normal tissue of healthy individuals
|
|||||
| Boxplot of Target Disease-specific Protein Abundances |
|
Click to View the Clearer Original Diagram | |||
| The Studied Tissue | Brain stem tissue | ||||
| The Specified Disease | Neuroectodermal tumour [ICD-11:2A00.11] | ||||
| The Expression Level of Disease Section Compare with the Healthy Individual Tissue | p-value: 0.818233128; Fold-change: 0.010486566; Z-score: 0.092404103 | ||||
|
Target expression in the diseased tissue of patients
Target expression in the normal tissue of healthy individuals
|
|||||
| Boxplot of Target Disease-specific Protein Abundances |
|
Click to View the Clearer Original Diagram | |||
| ICD-11: 2A20 | Myeloproliferative neoplasm | Click to Show/Hide | |||
| The Studied Tissue | Whole blood | ||||
| The Specified Disease | Myelofibrosis [ICD-11:2A20.2] | ||||
| The Expression Level of Disease Section Compare with the Healthy Individual Tissue | p-value: 0.84633504; Fold-change: 0.022961119; Z-score: 0.178479125 | ||||
|
Target expression in the diseased tissue of patients
Target expression in the normal tissue of healthy individuals
|
|||||
| Boxplot of Target Disease-specific Protein Abundances |
|
Click to View the Clearer Original Diagram | |||
| The Studied Tissue | Whole blood | ||||
| The Specified Disease | Polycythemia vera [ICD-11:2A20.4] | ||||
| The Expression Level of Disease Section Compare with the Healthy Individual Tissue | p-value: 0.056415357; Fold-change: -0.057915887; Z-score: -0.47418832 | ||||
|
Target expression in the diseased tissue of patients
Target expression in the normal tissue of healthy individuals
|
|||||
| Boxplot of Target Disease-specific Protein Abundances |
|
Click to View the Clearer Original Diagram | |||
| ICD-11: 2A36 | Myelodysplastic syndrome | Click to Show/Hide | |||
| The Studied Tissue | Bone marrow | ||||
| The Specified Disease | Myelodysplastic syndrome [ICD-11:2A36-2A3Z] | ||||
| The Expression Level of Disease Section Compare with the Healthy Individual Tissue | p-value: 0.747685948; Fold-change: 0.004771232; Z-score: 0.023876183 | ||||
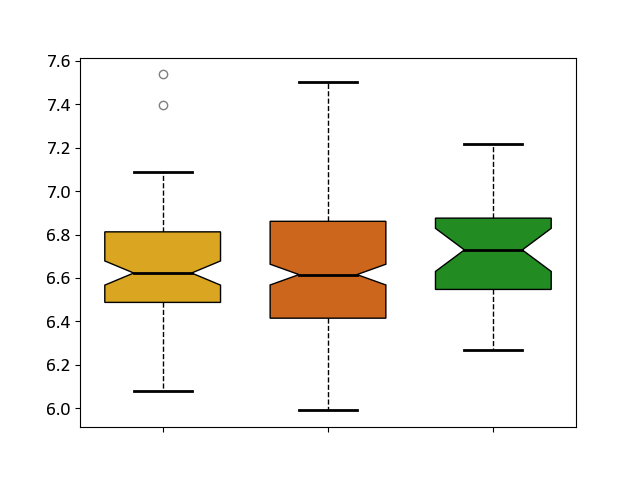
| The Expression Level of Disease Section Compare with the Adjacent Tissue | p-value: 0.238626441; Fold-change: 0.1504796; Z-score: 1.061290192 | ||||
|
Target expression in the diseased tissue of patients
Target expression in the normal tissue adjacent to the diseased tissue of patients
Target expression in the normal tissue of healthy individuals
|
|||||
| Boxplot of Target Disease-specific Protein Abundances |
|
Click to View the Clearer Original Diagram | |||
| ICD-11: 2A81 | Diffuse large B-cell lymphoma | Click to Show/Hide | |||
| The Studied Tissue | Tonsil tissue | ||||
| The Specified Disease | Diffuse large B-cell lymphoma [ICD-11:2A81] | ||||
| The Expression Level of Disease Section Compare with the Healthy Individual Tissue | p-value: 0.306646817; Fold-change: -0.098741456; Z-score: -0.667132494 | ||||
|
Target expression in the diseased tissue of patients
Target expression in the normal tissue of healthy individuals
|
|||||
| Boxplot of Target Disease-specific Protein Abundances |
|
Click to View the Clearer Original Diagram | |||
| ICD-11: 2A83 | Plasma cell neoplasm | Click to Show/Hide | |||
| The Studied Tissue | Bone marrow | ||||
| The Specified Disease | Multiple myeloma [ICD-11:2A83.1] | ||||
| The Expression Level of Disease Section Compare with the Healthy Individual Tissue | p-value: 0.001206004; Fold-change: -0.236535074; Z-score: -1.747377697 | ||||
|
Target expression in the diseased tissue of patients
Target expression in the normal tissue of healthy individuals
|
|||||
| Boxplot of Target Disease-specific Protein Abundances |
|
Click to View the Clearer Original Diagram | |||
| The Studied Tissue | Peripheral blood | ||||
| The Specified Disease | Multiple myeloma [ICD-11:2A83.1] | ||||
| The Expression Level of Disease Section Compare with the Healthy Individual Tissue | p-value: 0.306998484; Fold-change: 0.019360812; Z-score: 0.088618414 | ||||
|
Target expression in the diseased tissue of patients
Target expression in the normal tissue of healthy individuals
|
|||||
| Boxplot of Target Disease-specific Protein Abundances |
|
Click to View the Clearer Original Diagram | |||
| ICD-11: 2B33 | Leukaemia | Click to Show/Hide | |||
| The Studied Tissue | Bone marrow | ||||
| The Specified Disease | Acute myelocytic leukaemia [ICD-11:2B33.1] | ||||
| The Expression Level of Disease Section Compare with the Healthy Individual Tissue | p-value: 0.046530148; Fold-change: -0.020464447; Z-score: -0.114057216 | ||||
|
Target expression in the diseased tissue of patients
Target expression in the normal tissue of healthy individuals
|
|||||
| Boxplot of Target Disease-specific Protein Abundances |
|
Click to View the Clearer Original Diagram | |||
| ICD-11: 2B6E | Oral cancer | Click to Show/Hide | |||
| The Studied Tissue | Oral tissue | ||||
| The Specified Disease | Oral cancer [ICD-11:2B6E] | ||||
| The Expression Level of Disease Section Compare with the Healthy Individual Tissue | p-value: 0.119873737; Fold-change: -0.113799548; Z-score: -0.434277444 | ||||
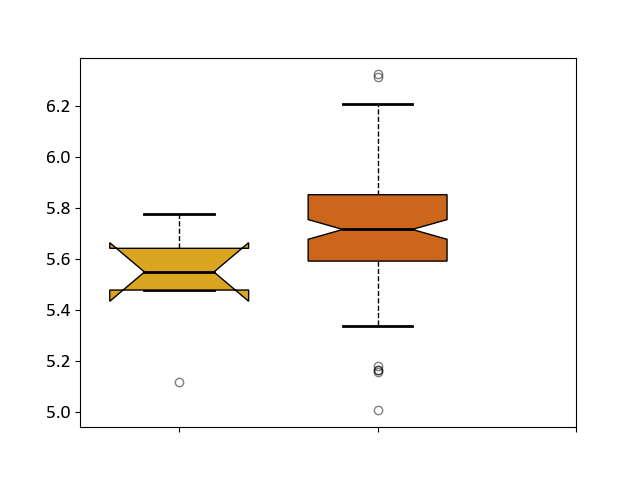
| The Expression Level of Disease Section Compare with the Adjacent Tissue | p-value: 0.987012735; Fold-change: -0.007213532; Z-score: -0.029992985 | ||||
|
Target expression in the diseased tissue of patients
Target expression in the normal tissue adjacent to the diseased tissue of patients
Target expression in the normal tissue of healthy individuals
|
|||||
| Boxplot of Target Disease-specific Protein Abundances |
|
Click to View the Clearer Original Diagram | |||
| ICD-11: 2B70 | Esophageal cancer | Click to Show/Hide | |||
| The Studied Tissue | Esophagus | ||||
| The Specified Disease | Esophagal cancer [ICD-11:2B70] | ||||
| The Expression Level of Disease Section Compare with the Adjacent Tissue | p-value: 0.130349484; Fold-change: 0.166859156; Z-score: 0.672881356 | ||||
|
Target expression in the diseased tissue of patients
Target expression in the normal tissue adjacent to the diseased tissue of patients
|
|||||
| Boxplot of Target Disease-specific Protein Abundances |
|
Click to View the Clearer Original Diagram | |||
| ICD-11: 2B72 | Stomach cancer | Click to Show/Hide | |||
| The Studied Tissue | Gastric tissue | ||||
| The Specified Disease | Gastric cancer [ICD-11:2B72] | ||||
| The Expression Level of Disease Section Compare with the Healthy Individual Tissue | p-value: 0.379554235; Fold-change: 0.117112651; Z-score: 0.859918881 | ||||
| The Expression Level of Disease Section Compare with the Adjacent Tissue | p-value: 0.795828147; Fold-change: 0.000427923; Z-score: 0.002396239 | ||||
|
Target expression in the diseased tissue of patients
Target expression in the normal tissue adjacent to the diseased tissue of patients
Target expression in the normal tissue of healthy individuals
|
|||||
| Boxplot of Target Disease-specific Protein Abundances |
|
Click to View the Clearer Original Diagram | |||
| ICD-11: 2B90 | Colon cancer | Click to Show/Hide | |||
| The Studied Tissue | Colon tissue | ||||
| The Specified Disease | Colon cancer [ICD-11:2B90] | ||||
| The Expression Level of Disease Section Compare with the Healthy Individual Tissue | p-value: 0.00053809; Fold-change: -0.061924416; Z-score: -0.314399851 | ||||
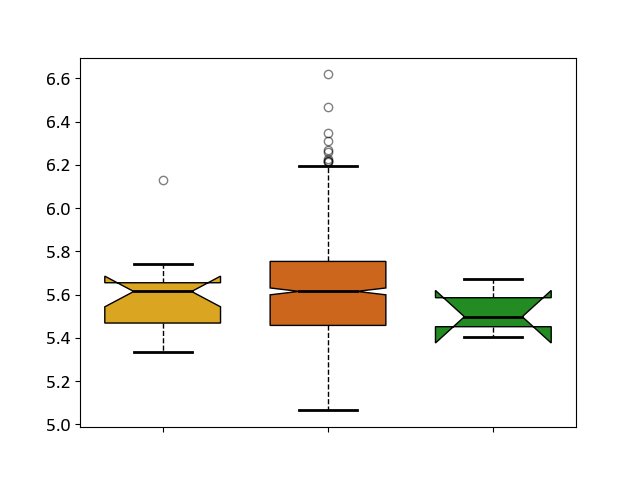
| The Expression Level of Disease Section Compare with the Adjacent Tissue | p-value: 2.90E-10; Fold-change: -0.134000812; Z-score: -0.65033825 | ||||
|
Target expression in the diseased tissue of patients
Target expression in the normal tissue adjacent to the diseased tissue of patients
Target expression in the normal tissue of healthy individuals
|
|||||
| Boxplot of Target Disease-specific Protein Abundances |
|
Click to View the Clearer Original Diagram | |||
| ICD-11: 2B92 | Rectal cancer | Click to Show/Hide | |||
| The Studied Tissue | Rectal colon tissue | ||||
| The Specified Disease | Rectal cancer [ICD-11:2B92] | ||||
| The Expression Level of Disease Section Compare with the Healthy Individual Tissue | p-value: 0.874765513; Fold-change: -0.028364914; Z-score: -0.275774729 | ||||
| The Expression Level of Disease Section Compare with the Adjacent Tissue | p-value: 0.654225151; Fold-change: -0.023122233; Z-score: -0.204956442 | ||||
|
Target expression in the diseased tissue of patients
Target expression in the normal tissue adjacent to the diseased tissue of patients
Target expression in the normal tissue of healthy individuals
|
|||||
| Boxplot of Target Disease-specific Protein Abundances |
|
Click to View the Clearer Original Diagram | |||
| ICD-11: 2C10 | Pancreatic cancer | Click to Show/Hide | |||
| The Studied Tissue | Pancreas | ||||
| The Specified Disease | Pancreatic cancer [ICD-11:2C10] | ||||
| The Expression Level of Disease Section Compare with the Healthy Individual Tissue | p-value: 0.342571502; Fold-change: -0.011838541; Z-score: -0.069134896 | ||||
| The Expression Level of Disease Section Compare with the Adjacent Tissue | p-value: 0.205726687; Fold-change: -0.000429127; Z-score: -0.001937147 | ||||
|
Target expression in the diseased tissue of patients
Target expression in the normal tissue adjacent to the diseased tissue of patients
Target expression in the normal tissue of healthy individuals
|
|||||
| Boxplot of Target Disease-specific Protein Abundances |
|
Click to View the Clearer Original Diagram | |||
| ICD-11: 2C12 | Liver cancer | Click to Show/Hide | |||
| The Studied Tissue | Liver tissue | ||||
| The Specified Disease | Liver cancer [ICD-11:2C12.0] | ||||
| The Expression Level of Disease Section Compare with the Healthy Individual Tissue | p-value: 0.403321984; Fold-change: 0.000664885; Z-score: 0.002966915 | ||||
| The Expression Level of Disease Section Compare with the Adjacent Tissue | p-value: 0.046147085; Fold-change: 2.81E-06; Z-score: 1.35E-05 | ||||
| The Expression Level of Disease Section Compare with the Other Disease Section | p-value: 0.104845732; Fold-change: 0.149905111; Z-score: 0.966082966 | ||||
|
Target expression in the diseased tissue of patients
Target expression in the normal tissue adjacent to the diseased tissue of patients
Target expression in the normal tissue of healthy individuals
Target expression in tissue other than the diseased tissue of patients
|
|||||
| Boxplot of Target Disease-specific Protein Abundances |
|
Click to View the Clearer Original Diagram | |||
| ICD-11: 2C25 | Lung cancer | Click to Show/Hide | |||
| The Studied Tissue | Lung tissue | ||||
| The Specified Disease | Lung cancer [ICD-11:2C25] | ||||
| The Expression Level of Disease Section Compare with the Healthy Individual Tissue | p-value: 3.07E-13; Fold-change: 0.16828425; Z-score: 0.707304198 | ||||
| The Expression Level of Disease Section Compare with the Adjacent Tissue | p-value: 8.18E-15; Fold-change: 0.158566028; Z-score: 0.875250128 | ||||
|
Target expression in the diseased tissue of patients
Target expression in the normal tissue adjacent to the diseased tissue of patients
Target expression in the normal tissue of healthy individuals
|
|||||
| Boxplot of Target Disease-specific Protein Abundances |
|
Click to View the Clearer Original Diagram | |||
| ICD-11: 2C30 | Skin cancer | Click to Show/Hide | |||
| The Studied Tissue | Skin | ||||
| The Specified Disease | Melanoma [ICD-11:2C30] | ||||
| The Expression Level of Disease Section Compare with the Healthy Individual Tissue | p-value: 0.045144001; Fold-change: -0.095527589; Z-score: -0.446752684 | ||||
|
Target expression in the diseased tissue of patients
Target expression in the normal tissue of healthy individuals
|
|||||
| Boxplot of Target Disease-specific Protein Abundances |
|
Click to View the Clearer Original Diagram | |||
| The Studied Tissue | Skin | ||||
| The Specified Disease | Skin cancer [ICD-11:2C30-2C3Z] | ||||
| The Expression Level of Disease Section Compare with the Healthy Individual Tissue | p-value: 2.35E-16; Fold-change: 0.179935699; Z-score: 0.757028132 | ||||
| The Expression Level of Disease Section Compare with the Adjacent Tissue | p-value: 0.018912808; Fold-change: 0.076226744; Z-score: 0.316801844 | ||||
|
Target expression in the diseased tissue of patients
Target expression in the normal tissue adjacent to the diseased tissue of patients
Target expression in the normal tissue of healthy individuals
|
|||||
| Boxplot of Target Disease-specific Protein Abundances |
|
Click to View the Clearer Original Diagram | |||
| ICD-11: 2C6Z | Breast cancer | Click to Show/Hide | |||
| The Studied Tissue | Breast tissue | ||||
| The Specified Disease | Breast cancer [ICD-11:2C60-2C6Z] | ||||
| The Expression Level of Disease Section Compare with the Healthy Individual Tissue | p-value: 0.151516656; Fold-change: 0.025255114; Z-score: 0.126370229 | ||||
| The Expression Level of Disease Section Compare with the Adjacent Tissue | p-value: 0.619670224; Fold-change: 0.017082134; Z-score: 0.056300669 | ||||
|
Target expression in the diseased tissue of patients
Target expression in the normal tissue adjacent to the diseased tissue of patients
Target expression in the normal tissue of healthy individuals
|
|||||
| Boxplot of Target Disease-specific Protein Abundances |
|
Click to View the Clearer Original Diagram | |||
| ICD-11: 2C73 | Ovarian cancer | Click to Show/Hide | |||
| The Studied Tissue | Ovarian tissue | ||||
| The Specified Disease | Ovarian cancer [ICD-11:2C73] | ||||
| The Expression Level of Disease Section Compare with the Healthy Individual Tissue | p-value: 0.00488827; Fold-change: 0.306790589; Z-score: 1.239941032 | ||||
| The Expression Level of Disease Section Compare with the Adjacent Tissue | p-value: 0.000655663; Fold-change: 0.196435885; Z-score: 1.459477757 | ||||
|
Target expression in the diseased tissue of patients
Target expression in the normal tissue adjacent to the diseased tissue of patients
Target expression in the normal tissue of healthy individuals
|
|||||
| Boxplot of Target Disease-specific Protein Abundances |
|
Click to View the Clearer Original Diagram | |||
| ICD-11: 2C77 | Cervical cancer | Click to Show/Hide | |||
| The Studied Tissue | Cervical tissue | ||||
| The Specified Disease | Cervical cancer [ICD-11:2C77] | ||||
| The Expression Level of Disease Section Compare with the Healthy Individual Tissue | p-value: 0.494032169; Fold-change: 0.000608022; Z-score: 0.004033267 | ||||
|
Target expression in the diseased tissue of patients
Target expression in the normal tissue of healthy individuals
|
|||||
| Boxplot of Target Disease-specific Protein Abundances |
|
Click to View the Clearer Original Diagram | |||
| ICD-11: 2C78 | Uterine cancer | Click to Show/Hide | |||
| The Studied Tissue | Endometrium tissue | ||||
| The Specified Disease | Uterine cancer [ICD-11:2C78] | ||||
| The Expression Level of Disease Section Compare with the Healthy Individual Tissue | p-value: 1.14E-06; Fold-change: 0.12088635; Z-score: 0.547149478 | ||||
| The Expression Level of Disease Section Compare with the Adjacent Tissue | p-value: 0.089096001; Fold-change: -0.219821012; Z-score: -1.628310901 | ||||
|
Target expression in the diseased tissue of patients
Target expression in the normal tissue adjacent to the diseased tissue of patients
Target expression in the normal tissue of healthy individuals
|
|||||
| Boxplot of Target Disease-specific Protein Abundances |
|
Click to View the Clearer Original Diagram | |||
| ICD-11: 2C82 | Prostate cancer | Click to Show/Hide | |||
| The Studied Tissue | Prostate | ||||
| The Specified Disease | Prostate cancer [ICD-11:2C82] | ||||
| The Expression Level of Disease Section Compare with the Healthy Individual Tissue | p-value: 0.811652861; Fold-change: -0.151273273; Z-score: -0.37514147 | ||||
|
Target expression in the diseased tissue of patients
Target expression in the normal tissue of healthy individuals
|
|||||
| Boxplot of Target Disease-specific Protein Abundances |
|
Click to View the Clearer Original Diagram | |||
| ICD-11: 2C90 | Renal cancer | Click to Show/Hide | |||
| The Studied Tissue | Kidney | ||||
| The Specified Disease | Renal cancer [ICD-11:2C90-2C91] | ||||
| The Expression Level of Disease Section Compare with the Healthy Individual Tissue | p-value: 2.16E-05; Fold-change: -0.436011051; Z-score: -2.302224225 | ||||
| The Expression Level of Disease Section Compare with the Adjacent Tissue | p-value: 4.45E-17; Fold-change: -0.419150605; Z-score: -1.637190012 | ||||
|
Target expression in the diseased tissue of patients
Target expression in the normal tissue adjacent to the diseased tissue of patients
Target expression in the normal tissue of healthy individuals
|
|||||
| Boxplot of Target Disease-specific Protein Abundances |
|
Click to View the Clearer Original Diagram | |||
| ICD-11: 2C92 | Ureter cancer | Click to Show/Hide | |||
| The Studied Tissue | Urothelium | ||||
| The Specified Disease | Ureter cancer [ICD-11:2C92] | ||||
| The Expression Level of Disease Section Compare with the Healthy Individual Tissue | p-value: 0.080864505; Fold-change: -0.112073593; Z-score: -0.418326925 | ||||
|
Target expression in the diseased tissue of patients
Target expression in the normal tissue of healthy individuals
|
|||||
| Boxplot of Target Disease-specific Protein Abundances |
|
Click to View the Clearer Original Diagram | |||
| ICD-11: 2C94 | Bladder cancer | Click to Show/Hide | |||
| The Studied Tissue | Bladder tissue | ||||
| The Specified Disease | Bladder cancer [ICD-11:2C94] | ||||
| The Expression Level of Disease Section Compare with the Healthy Individual Tissue | p-value: 0.000172342; Fold-change: 0.424802599; Z-score: 3.188559607 | ||||
|
Target expression in the diseased tissue of patients
Target expression in the normal tissue of healthy individuals
|
|||||
| Boxplot of Target Disease-specific Protein Abundances |
|
Click to View the Clearer Original Diagram | |||
| ICD-11: 2D02 | Retinal cancer | Click to Show/Hide | |||
| The Studied Tissue | Uvea | ||||
| The Specified Disease | Retinoblastoma [ICD-11:2D02.2] | ||||
| The Expression Level of Disease Section Compare with the Healthy Individual Tissue | p-value: 0.597779415; Fold-change: 0.05379107; Z-score: 0.45224536 | ||||
|
Target expression in the diseased tissue of patients
Target expression in the normal tissue of healthy individuals
|
|||||
| Boxplot of Target Disease-specific Protein Abundances |
|
Click to View the Clearer Original Diagram | |||
| ICD-11: 2D10 | Thyroid cancer | Click to Show/Hide | |||
| The Studied Tissue | Thyroid | ||||
| The Specified Disease | Thyroid cancer [ICD-11:2D10] | ||||
| The Expression Level of Disease Section Compare with the Healthy Individual Tissue | p-value: 2.00E-07; Fold-change: 0.097387634; Z-score: 0.571483916 | ||||
| The Expression Level of Disease Section Compare with the Adjacent Tissue | p-value: 2.18E-06; Fold-change: 0.125575735; Z-score: 0.745969975 | ||||
|
Target expression in the diseased tissue of patients
Target expression in the normal tissue adjacent to the diseased tissue of patients
Target expression in the normal tissue of healthy individuals
|
|||||
| Boxplot of Target Disease-specific Protein Abundances |
|
Click to View the Clearer Original Diagram | |||
| ICD-11: 2D11 | Adrenal cancer | Click to Show/Hide | |||
| The Studied Tissue | Adrenal cortex | ||||
| The Specified Disease | Adrenocortical carcinoma [ICD-11:2D11.Z] | ||||
| The Expression Level of Disease Section Compare with the Other Disease Section | p-value: 0.633001013; Fold-change: -0.072498572; Z-score: -0.633539365 | ||||
|
Target expression in the diseased tissue of patients
Target expression in tissue other than the diseased tissue of patients
|
|||||
| Boxplot of Target Disease-specific Protein Abundances |

|
Click to View the Clearer Original Diagram | |||
| ICD-11: 2D12 | Endocrine gland neoplasm | Click to Show/Hide | |||
| The Studied Tissue | Pituitary tissue | ||||
| The Specified Disease | Pituitary cancer [ICD-11:2D12] | ||||
| The Expression Level of Disease Section Compare with the Healthy Individual Tissue | p-value: 0.550405419; Fold-change: -0.075028265; Z-score: -0.337519129 | ||||
|
Target expression in the diseased tissue of patients
Target expression in the normal tissue of healthy individuals
|
|||||
| Boxplot of Target Disease-specific Protein Abundances |
|
Click to View the Clearer Original Diagram | |||
| The Studied Tissue | Pituitary tissue | ||||
| The Specified Disease | Pituitary gonadotrope tumour [ICD-11:2D12] | ||||
| The Expression Level of Disease Section Compare with the Healthy Individual Tissue | p-value: 0.078482278; Fold-change: -0.155487499; Z-score: -0.682409082 | ||||
|
Target expression in the diseased tissue of patients
Target expression in the normal tissue of healthy individuals
|
|||||
| Boxplot of Target Disease-specific Protein Abundances |
|
Click to View the Clearer Original Diagram | |||
| ICD-11: 2D42 | Head and neck cancer | Click to Show/Hide | |||
| The Studied Tissue | Head and neck tissue | ||||
| The Specified Disease | Head and neck cancer [ICD-11:2D42] | ||||
| The Expression Level of Disease Section Compare with the Healthy Individual Tissue | p-value: 1.35E-05; Fold-change: 0.111791671; Z-score: 0.739196517 | ||||
|
Target expression in the diseased tissue of patients
Target expression in the normal tissue of healthy individuals
|
|||||
| Boxplot of Target Disease-specific Protein Abundances |
|
Click to View the Clearer Original Diagram | |||
| ICD Disease Classification 03 | Disease of the blood or blood-forming organs | Click to Show/Hide | |||
| ICD-11: 3A51 | Sickle cell disorder | Click to Show/Hide | |||
| The Studied Tissue | Peripheral blood | ||||
| The Specified Disease | Sickle cell disease [ICD-11:3A51.0-3A51.3] | ||||
| The Expression Level of Disease Section Compare with the Healthy Individual Tissue | p-value: 0.874448671; Fold-change: -0.080933797; Z-score: -0.462395116 | ||||
|
Target expression in the diseased tissue of patients
Target expression in the normal tissue of healthy individuals
|
|||||
| Boxplot of Target Disease-specific Protein Abundances |
|
Click to View the Clearer Original Diagram | |||
| ICD-11: 3A70 | Aplastic anaemia | Click to Show/Hide | |||
| The Studied Tissue | Bone marrow | ||||
| The Specified Disease | Shwachman-Diamond syndrome [ICD-11:3A70.0] | ||||
| The Expression Level of Disease Section Compare with the Healthy Individual Tissue | p-value: 0.242724746; Fold-change: 0.11769908; Z-score: 1.535959348 | ||||
|
Target expression in the diseased tissue of patients
Target expression in the normal tissue of healthy individuals
|
|||||
| Boxplot of Target Disease-specific Protein Abundances |
|
Click to View the Clearer Original Diagram | |||
| ICD-11: 3B63 | Thrombocytosis | Click to Show/Hide | |||
| The Studied Tissue | Whole blood | ||||
| The Specified Disease | Thrombocythemia [ICD-11:3B63] | ||||
| The Expression Level of Disease Section Compare with the Healthy Individual Tissue | p-value: 0.489708183; Fold-change: 0.007137395; Z-score: 0.059165157 | ||||
|
Target expression in the diseased tissue of patients
Target expression in the normal tissue of healthy individuals
|
|||||
| Boxplot of Target Disease-specific Protein Abundances |
|
Click to View the Clearer Original Diagram | |||
| ICD-11: 3B64 | Thrombocytopenia | Click to Show/Hide | |||
| The Studied Tissue | Whole blood | ||||
| The Specified Disease | Thrombocytopenia [ICD-11:3B64] | ||||
| The Expression Level of Disease Section Compare with the Healthy Individual Tissue | p-value: 0.768035871; Fold-change: 0.011183515; Z-score: 0.027846674 | ||||
|
Target expression in the diseased tissue of patients
Target expression in the normal tissue of healthy individuals
|
|||||
| Boxplot of Target Disease-specific Protein Abundances |
|
Click to View the Clearer Original Diagram | |||
| ICD Disease Classification 04 | Disease of the immune system | Click to Show/Hide | |||
| ICD-11: 4A00 | Immunodeficiency | Click to Show/Hide | |||
| The Studied Tissue | Peripheral blood | ||||
| The Specified Disease | Immunodeficiency [ICD-11:4A00-4A20] | ||||
| The Expression Level of Disease Section Compare with the Healthy Individual Tissue | p-value: 0.622350364; Fold-change: 0.017993528; Z-score: 0.222528891 | ||||
|
Target expression in the diseased tissue of patients
Target expression in the normal tissue of healthy individuals
|
|||||
| Boxplot of Target Disease-specific Protein Abundances |
|
Click to View the Clearer Original Diagram | |||
| ICD-11: 4A40 | Lupus erythematosus | Click to Show/Hide | |||
| The Studied Tissue | Whole blood | ||||
| The Specified Disease | Lupus erythematosus [ICD-11:4A40] | ||||
| The Expression Level of Disease Section Compare with the Healthy Individual Tissue | p-value: 0.005100096; Fold-change: -0.084029002; Z-score: -0.327678774 | ||||
|
Target expression in the diseased tissue of patients
Target expression in the normal tissue of healthy individuals
|
|||||
| Boxplot of Target Disease-specific Protein Abundances |
|
Click to View the Clearer Original Diagram | |||
| ICD-11: 4A42 | Systemic sclerosis | Click to Show/Hide | |||
| The Studied Tissue | Whole blood | ||||
| The Specified Disease | Scleroderma [ICD-11:4A42.Z] | ||||
| The Expression Level of Disease Section Compare with the Healthy Individual Tissue | p-value: 0.484238231; Fold-change: -0.057238847; Z-score: -0.661783623 | ||||
|
Target expression in the diseased tissue of patients
Target expression in the normal tissue of healthy individuals
|
|||||
| Boxplot of Target Disease-specific Protein Abundances |

|
Click to View the Clearer Original Diagram | |||
| ICD-11: 4A43 | Systemic autoimmune disease | Click to Show/Hide | |||
| The Studied Tissue | Salivary gland tissue | ||||
| The Specified Disease | Sjogren's syndrome [ICD-11:4A43.2] | ||||
| The Expression Level of Disease Section Compare with the Healthy Individual Tissue | p-value: 0.341306248; Fold-change: 0.276972923; Z-score: 1.016684256 | ||||
| The Expression Level of Disease Section Compare with the Adjacent Tissue | p-value: 0.609602154; Fold-change: 0.066686981; Z-score: 0.621868088 | ||||
|
Target expression in the diseased tissue of patients
Target expression in the normal tissue adjacent to the diseased tissue of patients
Target expression in the normal tissue of healthy individuals
|
|||||
| Boxplot of Target Disease-specific Protein Abundances |
|
Click to View the Clearer Original Diagram | |||
| ICD-11: 4A62 | Behcet disease | Click to Show/Hide | |||
| The Studied Tissue | Peripheral blood | ||||
| The Specified Disease | Behcet's disease [ICD-11:4A62] | ||||
| The Expression Level of Disease Section Compare with the Healthy Individual Tissue | p-value: 0.934417881; Fold-change: -0.003102866; Z-score: -0.021610935 | ||||
|
Target expression in the diseased tissue of patients
Target expression in the normal tissue of healthy individuals
|
|||||
| Boxplot of Target Disease-specific Protein Abundances |

|
Click to View the Clearer Original Diagram | |||
| ICD-11: 4B04 | Monocyte count disorder | Click to Show/Hide | |||
| The Studied Tissue | Whole blood | ||||
| The Specified Disease | Autosomal dominant monocytopenia [ICD-11:4B04] | ||||
| The Expression Level of Disease Section Compare with the Healthy Individual Tissue | p-value: 0.331123476; Fold-change: 0.107896736; Z-score: 0.996847306 | ||||
|
Target expression in the diseased tissue of patients
Target expression in the normal tissue of healthy individuals
|
|||||
| Boxplot of Target Disease-specific Protein Abundances |
|
Click to View the Clearer Original Diagram | |||
| ICD Disease Classification 05 | Endocrine, nutritional or metabolic disease | Click to Show/Hide | |||
| ICD-11: 5A11 | Type 2 diabetes mellitus | Click to Show/Hide | |||
| The Studied Tissue | Omental adipose tissue | ||||
| The Specified Disease | Obesity related type 2 diabetes [ICD-11:5A11] | ||||
| The Expression Level of Disease Section Compare with the Healthy Individual Tissue | p-value: 0.482158051; Fold-change: -0.006170001; Z-score: -0.075954603 | ||||
|
Target expression in the diseased tissue of patients
Target expression in the normal tissue of healthy individuals
|
|||||
| Boxplot of Target Disease-specific Protein Abundances |
|
Click to View the Clearer Original Diagram | |||
| The Studied Tissue | Liver tissue | ||||
| The Specified Disease | Type 2 diabetes [ICD-11:5A11] | ||||
| The Expression Level of Disease Section Compare with the Healthy Individual Tissue | p-value: 0.403821379; Fold-change: -0.030395813; Z-score: -0.386739921 | ||||
|
Target expression in the diseased tissue of patients
Target expression in the normal tissue of healthy individuals
|
|||||
| Boxplot of Target Disease-specific Protein Abundances |
|
Click to View the Clearer Original Diagram | |||
| ICD-11: 5A80 | Ovarian dysfunction | Click to Show/Hide | |||
| The Studied Tissue | Vastus lateralis muscle | ||||
| The Specified Disease | Polycystic ovary syndrome [ICD-11:5A80.1] | ||||
| The Expression Level of Disease Section Compare with the Healthy Individual Tissue | p-value: 0.350165548; Fold-change: -0.021376122; Z-score: -0.229228326 | ||||
|
Target expression in the diseased tissue of patients
Target expression in the normal tissue of healthy individuals
|
|||||
| Boxplot of Target Disease-specific Protein Abundances |
|
Click to View the Clearer Original Diagram | |||
| ICD-11: 5B81 | Obesity | Click to Show/Hide | |||
| The Studied Tissue | Subcutaneous adipose tissue | ||||
| The Specified Disease | Obesity [ICD-11:5B81] | ||||
| The Expression Level of Disease Section Compare with the Healthy Individual Tissue | p-value: 0.926985194; Fold-change: 0.023439918; Z-score: 0.181664885 | ||||
|
Target expression in the diseased tissue of patients
Target expression in the normal tissue of healthy individuals
|
|||||
| Boxplot of Target Disease-specific Protein Abundances |
|
Click to View the Clearer Original Diagram | |||
| ICD-11: 5C51 | Inborn carbohydrate metabolism disorder | Click to Show/Hide | |||
| The Studied Tissue | Biceps muscle | ||||
| The Specified Disease | Pompe disease [ICD-11:5C51.3] | ||||
| The Expression Level of Disease Section Compare with the Healthy Individual Tissue | p-value: 0.348058897; Fold-change: 0.038106767; Z-score: 0.392634954 | ||||
|
Target expression in the diseased tissue of patients
Target expression in the normal tissue of healthy individuals
|
|||||
| Boxplot of Target Disease-specific Protein Abundances |
|
Click to View the Clearer Original Diagram | |||
| ICD-11: 5C56 | Lysosomal disease | Click to Show/Hide | |||
| The Studied Tissue | Whole blood | ||||
| The Specified Disease | Batten disease [ICD-11:5C56.1] | ||||
| The Expression Level of Disease Section Compare with the Healthy Individual Tissue | p-value: 0.682475712; Fold-change: 0.004764857; Z-score: 0.071383452 | ||||
|
Target expression in the diseased tissue of patients
Target expression in the normal tissue of healthy individuals
|
|||||
| Boxplot of Target Disease-specific Protein Abundances |
|
Click to View the Clearer Original Diagram | |||
| ICD-11: 5C80 | Hyperlipoproteinaemia | Click to Show/Hide | |||
| The Studied Tissue | Peripheral blood | ||||
| The Specified Disease | Familial hypercholesterolemia [ICD-11:5C80.00] | ||||
| The Expression Level of Disease Section Compare with the Healthy Individual Tissue | p-value: 0.162895723; Fold-change: 0.10327135; Z-score: 0.948917834 | ||||
|
Target expression in the diseased tissue of patients
Target expression in the normal tissue of healthy individuals
|
|||||
| Boxplot of Target Disease-specific Protein Abundances |
|
Click to View the Clearer Original Diagram | |||
| The Studied Tissue | Whole blood | ||||
| The Specified Disease | Familial hypercholesterolemia [ICD-11:5C80.00] | ||||
| The Expression Level of Disease Section Compare with the Healthy Individual Tissue | p-value: 0.596788318; Fold-change: 0.004753523; Z-score: 0.028846598 | ||||
|
Target expression in the diseased tissue of patients
Target expression in the normal tissue of healthy individuals
|
|||||
| Boxplot of Target Disease-specific Protein Abundances |
|
Click to View the Clearer Original Diagram | |||
| ICD Disease Classification 06 | Mental, behavioural or neurodevelopmental disorder | Click to Show/Hide | |||
| ICD-11: 6A02 | Autism spectrum disorder | Click to Show/Hide | |||
| The Studied Tissue | Whole blood | ||||
| The Specified Disease | Autism [ICD-11:6A02] | ||||
| The Expression Level of Disease Section Compare with the Healthy Individual Tissue | p-value: 0.582020647; Fold-change: 0.014392064; Z-score: 0.07944489 | ||||
|
Target expression in the diseased tissue of patients
Target expression in the normal tissue of healthy individuals
|
|||||
| Boxplot of Target Disease-specific Protein Abundances |

|
Click to View the Clearer Original Diagram | |||
| ICD-11: 6A20 | Schizophrenia | Click to Show/Hide | |||
| The Studied Tissue | Superior temporal cortex | ||||
| The Specified Disease | Schizophrenia [ICD-11:6A20] | ||||
| The Expression Level of Disease Section Compare with the Healthy Individual Tissue | p-value: 0.47151938; Fold-change: -0.043435914; Z-score: -0.374384012 | ||||
|
Target expression in the diseased tissue of patients
Target expression in the normal tissue of healthy individuals
|
|||||
| Boxplot of Target Disease-specific Protein Abundances |
|
Click to View the Clearer Original Diagram | |||
| The Studied Tissue | Prefrontal cortex | ||||
| The Specified Disease | Schizophrenia [ICD-11:6A20] | ||||
| The Expression Level of Disease Section Compare with the Healthy Individual Tissue | p-value: 0.752425466; Fold-change: -0.005693126; Z-score: -0.028188577 | ||||
| ICD-11: 6A60 | Bipolar disorder | Click to Show/Hide | |||
| The Studied Tissue | Prefrontal cortex | ||||
| The Specified Disease | Bipolar disorder [ICD-11:6A60-6A6Z] | ||||
| The Expression Level of Disease Section Compare with the Healthy Individual Tissue | p-value: 0.541091369; Fold-change: -0.002983441; Z-score: -0.022026752 | ||||
| ICD-11: 6A70 | Depressive disorder | Click to Show/Hide | |||
| The Studied Tissue | Whole blood | ||||
| The Specified Disease | Major depressive disorder [ICD-11:6A70-6A7Z] | ||||
| The Expression Level of Disease Section Compare with the Healthy Individual Tissue | p-value: 0.404292748; Fold-change: -0.032271038; Z-score: -0.224586793 | ||||
|
Target expression in the diseased tissue of patients
Target expression in the normal tissue of healthy individuals
|
|||||
| Boxplot of Target Disease-specific Protein Abundances |
|
Click to View the Clearer Original Diagram | |||
| The Studied Tissue | Prefrontal cortex | ||||
| The Specified Disease | Major depressive disorder [ICD-11:6A70-6A7Z] | ||||
| The Expression Level of Disease Section Compare with the Healthy Individual Tissue | p-value: 0.067528562; Fold-change: 0.034172702; Z-score: 0.262289911 | ||||
| ICD Disease Classification 08 | Disease of the nervous system | Click to Show/Hide | |||
| ICD-11: 8A00 | Parkinsonism | Click to Show/Hide | |||
| The Studied Tissue | Substantia nigra tissue | ||||
| The Specified Disease | Parkinson's disease [ICD-11:8A00.0] | ||||
| The Expression Level of Disease Section Compare with the Healthy Individual Tissue | p-value: 0.108200939; Fold-change: -0.125091221; Z-score: -0.870708459 | ||||
|
Target expression in the diseased tissue of patients
Target expression in the normal tissue of healthy individuals
|
|||||
| Boxplot of Target Disease-specific Protein Abundances |
|
Click to View the Clearer Original Diagram | |||
| ICD-11: 8A01 | Choreiform disorder | Click to Show/Hide | |||
| The Studied Tissue | Whole blood | ||||
| The Specified Disease | Huntington's disease [ICD-11:8A01.10] | ||||
| The Expression Level of Disease Section Compare with the Healthy Individual Tissue | p-value: 0.648389223; Fold-change: 0.018777565; Z-score: 0.161606755 | ||||
|
Target expression in the diseased tissue of patients
Target expression in the normal tissue of healthy individuals
|
|||||
| Boxplot of Target Disease-specific Protein Abundances |
|
Click to View the Clearer Original Diagram | |||
| ICD-11: 8A20 | Alzheimer disease | Click to Show/Hide | |||
| The Studied Tissue | Entorhinal cortex | ||||
| The Specified Disease | Alzheimer's disease [ICD-11:8A20] | ||||
| The Expression Level of Disease Section Compare with the Healthy Individual Tissue | p-value: 0.000405272; Fold-change: -0.046111746; Z-score: -0.41383843 | ||||
|
Target expression in the diseased tissue of patients
Target expression in the normal tissue of healthy individuals
|
|||||
| Boxplot of Target Disease-specific Protein Abundances |
|
Click to View the Clearer Original Diagram | |||
| ICD-11: 8A2Y | Neurocognitive impairment | Click to Show/Hide | |||
| The Studied Tissue | White matter tissue | ||||
| The Specified Disease | HIV-associated neurocognitive impairment [ICD-11:8A2Y-8A2Z] | ||||
| The Expression Level of Disease Section Compare with the Healthy Individual Tissue | p-value: 0.023045259; Fold-change: -0.061052238; Z-score: -0.445079672 | ||||
|
Target expression in the diseased tissue of patients
Target expression in the normal tissue of healthy individuals
|
|||||
| Boxplot of Target Disease-specific Protein Abundances |
|
Click to View the Clearer Original Diagram | |||
| ICD-11: 8A40 | Multiple sclerosis | Click to Show/Hide | |||
| The Studied Tissue | Plasmacytoid dendritic cells | ||||
| The Specified Disease | Multiple sclerosis [ICD-11:8A40] | ||||
| The Expression Level of Disease Section Compare with the Healthy Individual Tissue | p-value: 0.277768582; Fold-change: 0.006850654; Z-score: 0.034397068 | ||||
|
Target expression in the diseased tissue of patients
Target expression in the normal tissue of healthy individuals
|
|||||
| Boxplot of Target Disease-specific Protein Abundances |
|
Click to View the Clearer Original Diagram | |||
| The Studied Tissue | Spinal cord | ||||
| The Specified Disease | Multiple sclerosis [ICD-11:8A40] | ||||
| The Expression Level of Disease Section Compare with the Adjacent Tissue | p-value: 0.030895928; Fold-change: -0.14664168; Z-score: -0.622197729 | ||||
|
Target expression in the diseased tissue of patients
Target expression in the normal tissue adjacent to the diseased tissue of patients
|
|||||
| Boxplot of Target Disease-specific Protein Abundances |
|
Click to View the Clearer Original Diagram | |||
| ICD-11: 8A60 | Epilepsy | Click to Show/Hide | |||
| The Studied Tissue | Peritumoral cortex tissue | ||||
| The Specified Disease | Epilepsy [ICD-11:8A60-8A6Z] | ||||
| The Expression Level of Disease Section Compare with the Other Disease Section | p-value: 0.090523532; Fold-change: 0.208572786; Z-score: 16.52486609 | ||||
|
Target expression in the diseased tissue of patients
Target expression in tissue other than the diseased tissue of patients
|
|||||
| Boxplot of Target Disease-specific Protein Abundances |
|
Click to View the Clearer Original Diagram | |||
| The Studied Tissue | Whole blood | ||||
| The Specified Disease | Seizure [ICD-11:8A60-8A6Z] | ||||
| The Expression Level of Disease Section Compare with the Healthy Individual Tissue | p-value: 0.061483246; Fold-change: -0.157061089; Z-score: -0.848046082 | ||||
|
Target expression in the diseased tissue of patients
Target expression in the normal tissue of healthy individuals
|
|||||
| Boxplot of Target Disease-specific Protein Abundances |
|
Click to View the Clearer Original Diagram | |||
| ICD-11: 8B01 | Subarachnoid haemorrhage | Click to Show/Hide | |||
| The Studied Tissue | Intracranial artery | ||||
| The Specified Disease | Intracranial aneurysm [ICD-11:8B01.0] | ||||
| The Expression Level of Disease Section Compare with the Healthy Individual Tissue | p-value: 0.54368308; Fold-change: 0.028240333; Z-score: 0.230655606 | ||||
|
Target expression in the diseased tissue of patients
Target expression in the normal tissue of healthy individuals
|
|||||
| Boxplot of Target Disease-specific Protein Abundances |
|
Click to View the Clearer Original Diagram | |||
| ICD-11: 8B11 | Cerebral ischaemic stroke | Click to Show/Hide | |||
| The Studied Tissue | Whole blood | ||||
| The Specified Disease | Cardioembolic stroke [ICD-11:8B11.20] | ||||
| The Expression Level of Disease Section Compare with the Healthy Individual Tissue | p-value: 0.064135918; Fold-change: -0.092197858; Z-score: -0.564679798 | ||||
|
Target expression in the diseased tissue of patients
Target expression in the normal tissue of healthy individuals
|
|||||
| Boxplot of Target Disease-specific Protein Abundances |
|
Click to View the Clearer Original Diagram | |||
| The Studied Tissue | Peripheral blood | ||||
| The Specified Disease | Ischemic stroke [ICD-11:8B11] | ||||
| The Expression Level of Disease Section Compare with the Healthy Individual Tissue | p-value: 0.104395192; Fold-change: 0.060548711; Z-score: 0.447949266 | ||||
|
Target expression in the diseased tissue of patients
Target expression in the normal tissue of healthy individuals
|
|||||
| Boxplot of Target Disease-specific Protein Abundances |
|
Click to View the Clearer Original Diagram | |||
| ICD-11: 8B60 | Motor neuron disease | Click to Show/Hide | |||
| The Studied Tissue | Cervical spinal cord | ||||
| The Specified Disease | Lateral sclerosis [ICD-11:8B60.4] | ||||
| The Expression Level of Disease Section Compare with the Healthy Individual Tissue | p-value: 0.360370498; Fold-change: 0.051907604; Z-score: 0.587531434 | ||||
|
Target expression in the diseased tissue of patients
Target expression in the normal tissue of healthy individuals
|
|||||
| Boxplot of Target Disease-specific Protein Abundances |
|
Click to View the Clearer Original Diagram | |||
| The Studied Tissue | Skin | ||||
| The Specified Disease | Lateral sclerosis [ICD-11:8B60.4] | ||||
| The Expression Level of Disease Section Compare with the Healthy Individual Tissue | p-value: 0.011805407; Fold-change: 0.238253004; Z-score: 2.675047536 | ||||
|
Target expression in the diseased tissue of patients
Target expression in the normal tissue of healthy individuals
|
|||||
| Boxplot of Target Disease-specific Protein Abundances |
|
Click to View the Clearer Original Diagram | |||
| ICD-11: 8C70 | Muscular dystrophy | Click to Show/Hide | |||
| The Studied Tissue | Muscle tissue | ||||
| The Specified Disease | Myopathy [ICD-11:8C70.6] | ||||
| The Expression Level of Disease Section Compare with the Healthy Individual Tissue | p-value: 0.117563168; Fold-change: -0.190928966; Z-score: -1.156157079 | ||||
|
Target expression in the diseased tissue of patients
Target expression in the normal tissue of healthy individuals
|
|||||
| Boxplot of Target Disease-specific Protein Abundances |
|
Click to View the Clearer Original Diagram | |||
| ICD-11: 8C75 | Distal myopathy | Click to Show/Hide | |||
| The Studied Tissue | Muscle tissue | ||||
| The Specified Disease | Tibial muscular dystrophy [ICD-11:8C75] | ||||
| The Expression Level of Disease Section Compare with the Healthy Individual Tissue | p-value: 4.42E-05; Fold-change: -0.214708395; Z-score: -1.381622298 | ||||
|
Target expression in the diseased tissue of patients
Target expression in the normal tissue of healthy individuals
|
|||||
| Boxplot of Target Disease-specific Protein Abundances |
|
Click to View the Clearer Original Diagram | |||
| ICD Disease Classification 09 | Disease of the visual system | Click to Show/Hide | |||
| ICD-11: 9A96 | Anterior uveitis | Click to Show/Hide | |||
| The Studied Tissue | Peripheral monocyte | ||||
| The Specified Disease | Autoimmune uveitis [ICD-11:9A96] | ||||
| The Expression Level of Disease Section Compare with the Healthy Individual Tissue | p-value: 0.630815114; Fold-change: 0.069422167; Z-score: 0.512496845 | ||||
|
Target expression in the diseased tissue of patients
Target expression in the normal tissue of healthy individuals
|
|||||
| Boxplot of Target Disease-specific Protein Abundances |
|
Click to View the Clearer Original Diagram | |||
| ICD Disease Classification 11 | Disease of the circulatory system | Click to Show/Hide | |||
| ICD-11: BA00 | Essential hypertension | Click to Show/Hide | |||
| The Studied Tissue | Peripheral blood | ||||
| The Specified Disease | Essential hypertension [ICD-11:BA00] | ||||
| The Expression Level of Disease Section Compare with the Healthy Individual Tissue | p-value: 0.640815966; Fold-change: -0.013676465; Z-score: -0.240205874 | ||||
|
Target expression in the diseased tissue of patients
Target expression in the normal tissue of healthy individuals
|
|||||
| Boxplot of Target Disease-specific Protein Abundances |
|
Click to View the Clearer Original Diagram | |||
| ICD-11: BA41 | Myocardial infarction | Click to Show/Hide | |||
| The Studied Tissue | Peripheral blood | ||||
| The Specified Disease | Myocardial infarction [ICD-11:BA41-BA50] | ||||
| The Expression Level of Disease Section Compare with the Healthy Individual Tissue | p-value: 0.46788856; Fold-change: -0.100366396; Z-score: -0.291698603 | ||||
|
Target expression in the diseased tissue of patients
Target expression in the normal tissue of healthy individuals
|
|||||
| Boxplot of Target Disease-specific Protein Abundances |
|
Click to View the Clearer Original Diagram | |||
| ICD-11: BA80 | Coronary artery disease | Click to Show/Hide | |||
| The Studied Tissue | Peripheral blood | ||||
| The Specified Disease | Coronary artery disease [ICD-11:BA80-BA8Z] | ||||
| The Expression Level of Disease Section Compare with the Healthy Individual Tissue | p-value: 0.432590187; Fold-change: 0.006828755; Z-score: 0.042401575 | ||||
|
Target expression in the diseased tissue of patients
Target expression in the normal tissue of healthy individuals
|
|||||
| Boxplot of Target Disease-specific Protein Abundances |
|
Click to View the Clearer Original Diagram | |||
| ICD-11: BB70 | Aortic valve stenosis | Click to Show/Hide | |||
| The Studied Tissue | Calcified aortic valve | ||||
| The Specified Disease | Aortic stenosis [ICD-11:BB70] | ||||
| The Expression Level of Disease Section Compare with the Healthy Individual Tissue | p-value: 0.552068559; Fold-change: 0.097520479; Z-score: 0.473496943 | ||||
|
Target expression in the diseased tissue of patients
Target expression in the normal tissue of healthy individuals
|
|||||
| Boxplot of Target Disease-specific Protein Abundances |
|
Click to View the Clearer Original Diagram | |||
| ICD Disease Classification 12 | Disease of the respiratory system | Click to Show/Hide | |||
| ICD-11: 7A40 | Central sleep apnoea | Click to Show/Hide | |||
| The Studied Tissue | Hyperplastic tonsil | ||||
| The Specified Disease | Apnea [ICD-11:7A40] | ||||
| The Expression Level of Disease Section Compare with the Healthy Individual Tissue | p-value: 0.279599832; Fold-change: -0.119606543; Z-score: -0.943515285 | ||||
|
Target expression in the diseased tissue of patients
Target expression in the normal tissue of healthy individuals
|
|||||
| Boxplot of Target Disease-specific Protein Abundances |
|
Click to View the Clearer Original Diagram | |||
| ICD-11: CA08 | Vasomotor or allergic rhinitis | Click to Show/Hide | |||
| The Studied Tissue | Peripheral blood | ||||
| The Specified Disease | Olive pollen allergy [ICD-11:CA08.00] | ||||
| The Expression Level of Disease Section Compare with the Healthy Individual Tissue | p-value: 0.113965723; Fold-change: -0.244117306; Z-score: -1.740225177 | ||||
|
Target expression in the diseased tissue of patients
Target expression in the normal tissue of healthy individuals
|
|||||
| Boxplot of Target Disease-specific Protein Abundances |
|
Click to View the Clearer Original Diagram | |||
| ICD-11: CA0A | Chronic rhinosinusitis | Click to Show/Hide | |||
| The Studied Tissue | Sinus mucosa tissue | ||||
| The Specified Disease | Chronic rhinosinusitis [ICD-11:CA0A] | ||||
| The Expression Level of Disease Section Compare with the Healthy Individual Tissue | p-value: 0.627061834; Fold-change: -0.046737006; Z-score: -0.23918451 | ||||
|
Target expression in the diseased tissue of patients
Target expression in the normal tissue of healthy individuals
|
|||||
| Boxplot of Target Disease-specific Protein Abundances |
|
Click to View the Clearer Original Diagram | |||
| ICD-11: CA22 | Chronic obstructive pulmonary disease | Click to Show/Hide | |||
| The Studied Tissue | Lung tissue | ||||
| The Specified Disease | Chronic obstructive pulmonary disease [ICD-11:CA22] | ||||
| The Expression Level of Disease Section Compare with the Healthy Individual Tissue | p-value: 0.135475951; Fold-change: 0.106856004; Z-score: 0.631629185 | ||||
|
Target expression in the diseased tissue of patients
Target expression in the normal tissue of healthy individuals
|
|||||
| Boxplot of Target Disease-specific Protein Abundances |
|
Click to View the Clearer Original Diagram | |||
| The Studied Tissue | Small airway epithelium | ||||
| The Specified Disease | Chronic obstructive pulmonary disease [ICD-11:CA22] | ||||
| The Expression Level of Disease Section Compare with the Healthy Individual Tissue | p-value: 0.11233449; Fold-change: 0.068497523; Z-score: 0.458473465 | ||||
|
Target expression in the diseased tissue of patients
Target expression in the normal tissue of healthy individuals
|
|||||
| Boxplot of Target Disease-specific Protein Abundances |
|
Click to View the Clearer Original Diagram | |||
| ICD-11: CA23 | Asthma | Click to Show/Hide | |||
| The Studied Tissue | Nasal and bronchial airway | ||||
| The Specified Disease | Asthma [ICD-11:CA23] | ||||
| The Expression Level of Disease Section Compare with the Healthy Individual Tissue | p-value: 0.00529133; Fold-change: 0.091727459; Z-score: 0.254131945 | ||||
|
Target expression in the diseased tissue of patients
Target expression in the normal tissue of healthy individuals
|
|||||
| Boxplot of Target Disease-specific Protein Abundances |
|
Click to View the Clearer Original Diagram | |||
| ICD-11: CB03 | Idiopathic interstitial pneumonitis | Click to Show/Hide | |||
| The Studied Tissue | Lung tissue | ||||
| The Specified Disease | Idiopathic pulmonary fibrosis [ICD-11:CB03.4] | ||||
| The Expression Level of Disease Section Compare with the Healthy Individual Tissue | p-value: 0.416813846; Fold-change: 0.062137202; Z-score: 0.395149931 | ||||
|
Target expression in the diseased tissue of patients
Target expression in the normal tissue of healthy individuals
|
|||||
| Boxplot of Target Disease-specific Protein Abundances |

|
Click to View the Clearer Original Diagram | |||
| ICD Disease Classification 13 | Disease of the digestive system | Click to Show/Hide | |||
| ICD-11: DA0C | Periodontal disease | Click to Show/Hide | |||
| The Studied Tissue | Gingival tissue | ||||
| The Specified Disease | Periodontal disease [ICD-11:DA0C] | ||||
| The Expression Level of Disease Section Compare with the Adjacent Tissue | p-value: 0.345532098; Fold-change: 0.037146586; Z-score: 0.194314421 | ||||
|
Target expression in the diseased tissue of patients
Target expression in the normal tissue adjacent to the diseased tissue of patients
|
|||||
| Boxplot of Target Disease-specific Protein Abundances |
|
Click to View the Clearer Original Diagram | |||
| ICD-11: DA42 | Gastritis | Click to Show/Hide | |||
| The Studied Tissue | Gastric antrum tissue | ||||
| The Specified Disease | Eosinophilic gastritis [ICD-11:DA42.2] | ||||
| The Expression Level of Disease Section Compare with the Adjacent Tissue | p-value: 0.534107775; Fold-change: 0.043667276; Z-score: 0.3583164 | ||||
|
Target expression in the diseased tissue of patients
Target expression in the normal tissue adjacent to the diseased tissue of patients
|
|||||
| Boxplot of Target Disease-specific Protein Abundances |
|
Click to View the Clearer Original Diagram | |||
| ICD-11: DB92 | Non-alcoholic fatty liver disease | Click to Show/Hide | |||
| The Studied Tissue | Liver tissue | ||||
| The Specified Disease | Non alcoholic fatty liver disease [ICD-11:DB92] | ||||
| The Expression Level of Disease Section Compare with the Healthy Individual Tissue | p-value: 0.054211505; Fold-change: -0.184408511; Z-score: -1.016034513 | ||||
|
Target expression in the diseased tissue of patients
Target expression in the normal tissue of healthy individuals
|
|||||
| Boxplot of Target Disease-specific Protein Abundances |
|
Click to View the Clearer Original Diagram | |||
| ICD-11: DB99 | Hepatic failure | Click to Show/Hide | |||
| The Studied Tissue | Liver tissue | ||||
| The Specified Disease | Liver failure [ICD-11:DB99.7-DB99.8] | ||||
| The Expression Level of Disease Section Compare with the Healthy Individual Tissue | p-value: 0.073776607; Fold-change: -0.187525722; Z-score: -0.845074013 | ||||
|
Target expression in the diseased tissue of patients
Target expression in the normal tissue of healthy individuals
|
|||||
| Boxplot of Target Disease-specific Protein Abundances |
|
Click to View the Clearer Original Diagram | |||
| ICD-11: DD71 | Ulcerative colitis | Click to Show/Hide | |||
| The Studied Tissue | Colon mucosal tissue | ||||
| The Specified Disease | Ulcerative colitis [ICD-11:DD71] | ||||
| The Expression Level of Disease Section Compare with the Adjacent Tissue | p-value: 0.106902946; Fold-change: -0.115668463; Z-score: -0.683150747 | ||||
|
Target expression in the diseased tissue of patients
Target expression in tissue other than the diseased tissue of patients
|
|||||
| Boxplot of Target Disease-specific Protein Abundances |
|
Click to View the Clearer Original Diagram | |||
| ICD-11: DD91 | Irritable bowel syndrome | Click to Show/Hide | |||
| The Studied Tissue | Rectal colon tissue | ||||
| The Specified Disease | Irritable bowel syndrome [ICD-11:DD91.0] | ||||
| The Expression Level of Disease Section Compare with the Healthy Individual Tissue | p-value: 0.186574871; Fold-change: 0.094016979; Z-score: 0.46531067 | ||||
|
Target expression in the diseased tissue of patients
Target expression in the normal tissue of healthy individuals
|
|||||
| Boxplot of Target Disease-specific Protein Abundances |
|
Click to View the Clearer Original Diagram | |||
| ICD Disease Classification 14 | Disease of the skin | Click to Show/Hide | |||
| ICD-11: EA80 | Atopic eczema | Click to Show/Hide | |||
| The Studied Tissue | Skin | ||||
| The Specified Disease | Atopic dermatitis [ICD-11:EA80] | ||||
| The Expression Level of Disease Section Compare with the Healthy Individual Tissue | p-value: 0.005297652; Fold-change: 0.090433693; Z-score: 0.5233474 | ||||
|
Target expression in the diseased tissue of patients
Target expression in the normal tissue of healthy individuals
|
|||||
| Boxplot of Target Disease-specific Protein Abundances |
|
Click to View the Clearer Original Diagram | |||
| ICD-11: EA90 | Psoriasis | Click to Show/Hide | |||
| The Studied Tissue | Skin | ||||
| The Specified Disease | Psoriasis [ICD-11:EA90] | ||||
| The Expression Level of Disease Section Compare with the Healthy Individual Tissue | p-value: 2.03E-06; Fold-change: 0.123912115; Z-score: 0.558536559 | ||||
| The Expression Level of Disease Section Compare with the Adjacent Tissue | p-value: 0.026855694; Fold-change: -0.071210481; Z-score: -0.379234508 | ||||
|
Target expression in the diseased tissue of patients
Target expression in the normal tissue adjacent to the diseased tissue of patients
Target expression in the normal tissue of healthy individuals
|
|||||
| Boxplot of Target Disease-specific Protein Abundances |
|
Click to View the Clearer Original Diagram | |||
| ICD-11: ED63 | Acquired hypomelanotic disorder | Click to Show/Hide | |||
| The Studied Tissue | Skin | ||||
| The Specified Disease | Vitiligo [ICD-11:ED63.0] | ||||
| The Expression Level of Disease Section Compare with the Healthy Individual Tissue | p-value: 0.250750661; Fold-change: -0.07041245; Z-score: -0.447008866 | ||||
|
Target expression in the diseased tissue of patients
Target expression in the normal tissue of healthy individuals
|
|||||
| Boxplot of Target Disease-specific Protein Abundances |
|
Click to View the Clearer Original Diagram | |||
| ICD-11: ED70 | Alopecia or hair loss | Click to Show/Hide | |||
| The Studied Tissue | Skin from scalp | ||||
| The Specified Disease | Alopecia [ICD-11:ED70] | ||||
| The Expression Level of Disease Section Compare with the Healthy Individual Tissue | p-value: 0.000185383; Fold-change: 0.130004451; Z-score: 0.751542775 | ||||
|
Target expression in the diseased tissue of patients
Target expression in the normal tissue of healthy individuals
|
|||||
| Boxplot of Target Disease-specific Protein Abundances |
|
Click to View the Clearer Original Diagram | |||
| ICD-11: EK0Z | Contact dermatitis | Click to Show/Hide | |||
| The Studied Tissue | Skin | ||||
| The Specified Disease | Sensitive skin [ICD-11:EK0Z] | ||||
| The Expression Level of Disease Section Compare with the Healthy Individual Tissue | p-value: 0.558485614; Fold-change: -0.096085346; Z-score: -1.237816314 | ||||
|
Target expression in the diseased tissue of patients
Target expression in the normal tissue of healthy individuals
|
|||||
| Boxplot of Target Disease-specific Protein Abundances |
|
Click to View the Clearer Original Diagram | |||
| ICD Disease Classification 15 | Disease of the musculoskeletal system/connective tissue | Click to Show/Hide | |||
| ICD-11: FA00 | Osteoarthritis | Click to Show/Hide | |||
| The Studied Tissue | Peripheral blood | ||||
| The Specified Disease | Arthropathy [ICD-11:FA00-FA5Z] | ||||
| The Expression Level of Disease Section Compare with the Healthy Individual Tissue | p-value: 0.973187072; Fold-change: -0.006536435; Z-score: -0.061449258 | ||||
|
Target expression in the diseased tissue of patients
Target expression in the normal tissue of healthy individuals
|
|||||
| Boxplot of Target Disease-specific Protein Abundances |
|
Click to View the Clearer Original Diagram | |||
| The Studied Tissue | Synovial tissue | ||||
| The Specified Disease | Osteoarthritis [ICD-11:FA00-FA0Z] | ||||
| The Expression Level of Disease Section Compare with the Healthy Individual Tissue | p-value: 0.801311626; Fold-change: 0.059314762; Z-score: 0.185779133 | ||||
|
Target expression in the diseased tissue of patients
Target expression in the normal tissue of healthy individuals
|
|||||
| Boxplot of Target Disease-specific Protein Abundances |
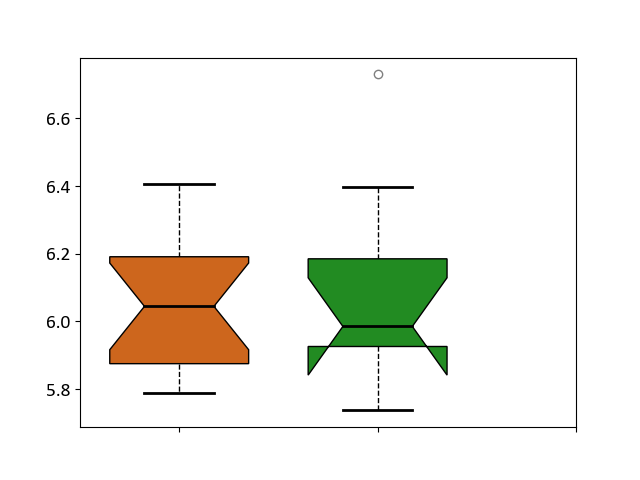
|
Click to View the Clearer Original Diagram | |||
| ICD-11: FA20 | Rheumatoid arthritis | Click to Show/Hide | |||
| The Studied Tissue | Synovial tissue | ||||
| The Specified Disease | Rheumatoid arthritis [ICD-11:FA20] | ||||
| The Expression Level of Disease Section Compare with the Healthy Individual Tissue | p-value: 0.983768401; Fold-change: 0.104026226; Z-score: 0.228814974 | ||||
|
Target expression in the diseased tissue of patients
Target expression in the normal tissue of healthy individuals
|
|||||
| Boxplot of Target Disease-specific Protein Abundances |
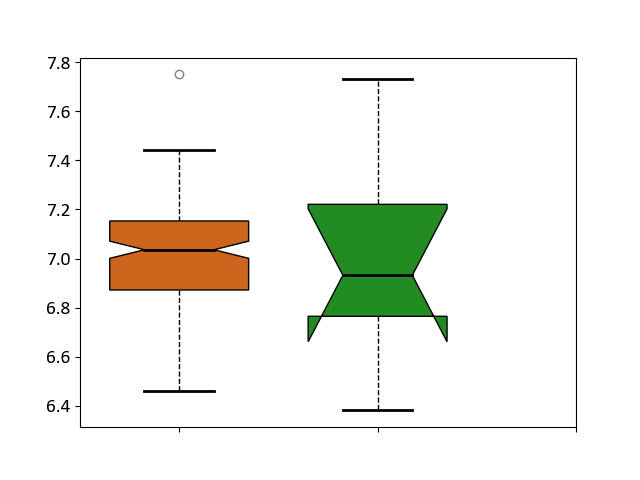
|
Click to View the Clearer Original Diagram | |||
| ICD-11: FA24 | Juvenile idiopathic arthritis | Click to Show/Hide | |||
| The Studied Tissue | Peripheral blood | ||||
| The Specified Disease | Juvenile idiopathic arthritis [ICD-11:FA24] | ||||
| The Expression Level of Disease Section Compare with the Healthy Individual Tissue | p-value: 0.01330008; Fold-change: -0.025711706; Z-score: -0.125395953 | ||||
|
Target expression in the diseased tissue of patients
Target expression in the normal tissue of healthy individuals
|
|||||
| Boxplot of Target Disease-specific Protein Abundances |
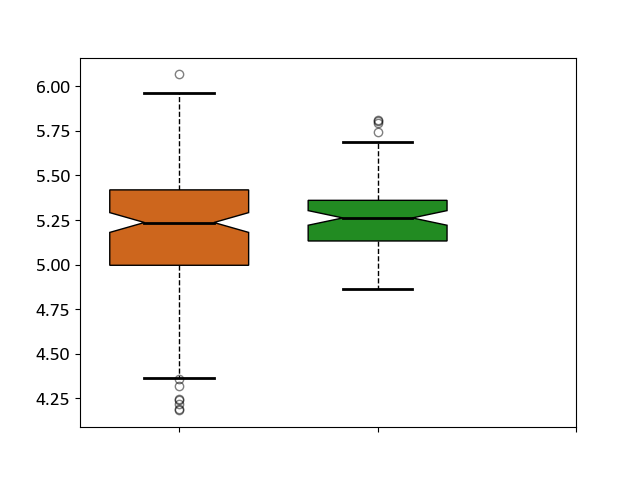
|
Click to View the Clearer Original Diagram | |||
| ICD-11: FA92 | Inflammatory spondyloarthritis | Click to Show/Hide | |||
| The Studied Tissue | Pheripheral blood | ||||
| The Specified Disease | Ankylosing spondylitis [ICD-11:FA92.0Z] | ||||
| The Expression Level of Disease Section Compare with the Healthy Individual Tissue | p-value: 0.401224461; Fold-change: 0.030287475; Z-score: 0.296479882 | ||||
|
Target expression in the diseased tissue of patients
Target expression in the normal tissue of healthy individuals
|
|||||
| Boxplot of Target Disease-specific Protein Abundances |
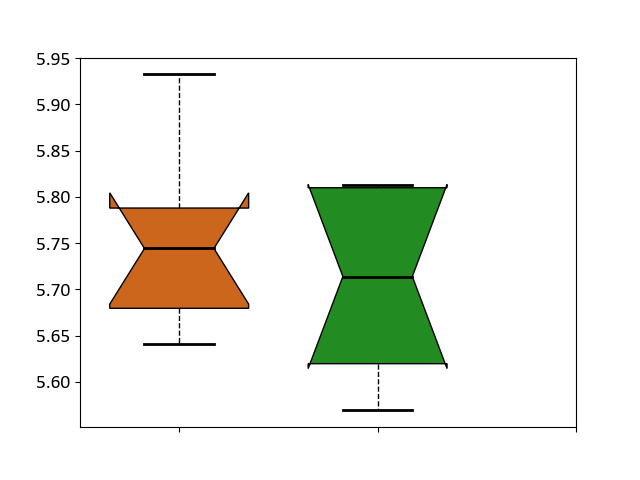
|
Click to View the Clearer Original Diagram | |||
| ICD-11: FB83 | Low bone mass disorder | Click to Show/Hide | |||
| The Studied Tissue | Bone marrow | ||||
| The Specified Disease | Osteoporosis [ICD-11:FB83.1] | ||||
| The Expression Level of Disease Section Compare with the Healthy Individual Tissue | p-value: 0.234818754; Fold-change: -0.106066566; Z-score: -1.052747957 | ||||
|
Target expression in the diseased tissue of patients
Target expression in the normal tissue of healthy individuals
|
|||||
| Boxplot of Target Disease-specific Protein Abundances |
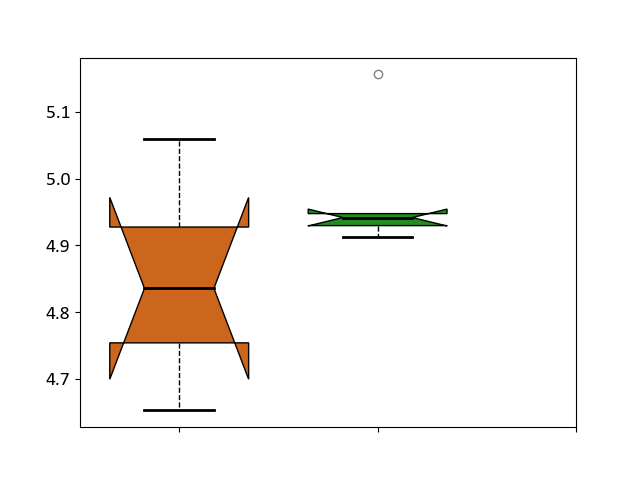
|
Click to View the Clearer Original Diagram | |||
| ICD Disease Classification 16 | Disease of the genitourinary system | Click to Show/Hide | |||
| ICD-11: GA10 | Endometriosis | Click to Show/Hide | |||
| The Studied Tissue | Endometrium tissue | ||||
| The Specified Disease | Endometriosis [ICD-11:GA10] | ||||
| The Expression Level of Disease Section Compare with the Healthy Individual Tissue | p-value: 0.790051965; Fold-change: 0.085324651; Z-score: 0.391533447 | ||||
|
Target expression in the diseased tissue of patients
Target expression in the normal tissue of healthy individuals
|
|||||
| Boxplot of Target Disease-specific Protein Abundances |
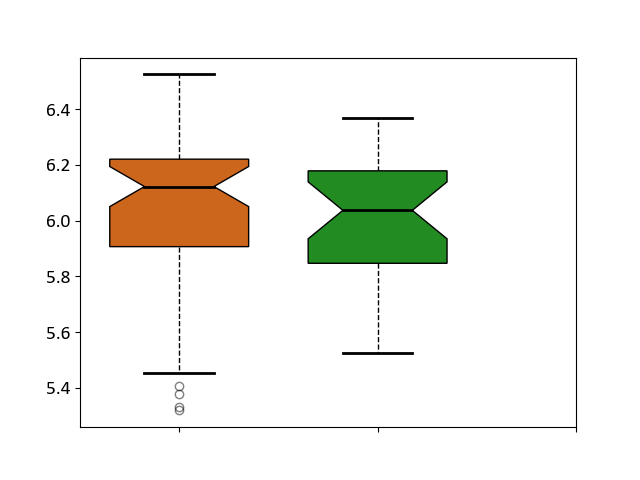
|
Click to View the Clearer Original Diagram | |||
| ICD-11: GC00 | Cystitis | Click to Show/Hide | |||
| The Studied Tissue | Bladder tissue | ||||
| The Specified Disease | Interstitial cystitis [ICD-11:GC00.3] | ||||
| The Expression Level of Disease Section Compare with the Healthy Individual Tissue | p-value: 3.10E-05; Fold-change: 0.297316901; Z-score: 4.396205706 | ||||
|
Target expression in the diseased tissue of patients
Target expression in the normal tissue of healthy individuals
|
|||||
| Boxplot of Target Disease-specific Protein Abundances |
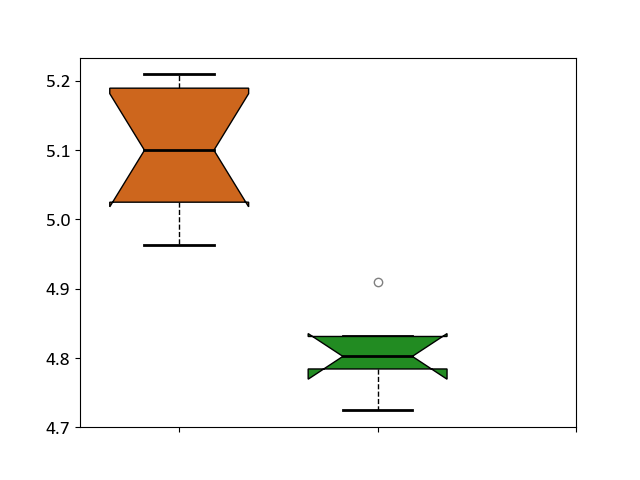
|
Click to View the Clearer Original Diagram | |||
| ICD Disease Classification 19 | Certain condition originating in the perinatal period | Click to Show/Hide | |||
| ICD-11: KA21 | Short gestation disorder | Click to Show/Hide | |||
| The Studied Tissue | Myometrium | ||||
| The Specified Disease | Preterm birth [ICD-11:KA21.4Z] | ||||
| The Expression Level of Disease Section Compare with the Healthy Individual Tissue | p-value: 0.80522815; Fold-change: -0.006882408; Z-score: -0.031589625 | ||||
|
Target expression in the diseased tissue of patients
Target expression in the normal tissue of healthy individuals
|
|||||
| Boxplot of Target Disease-specific Protein Abundances |
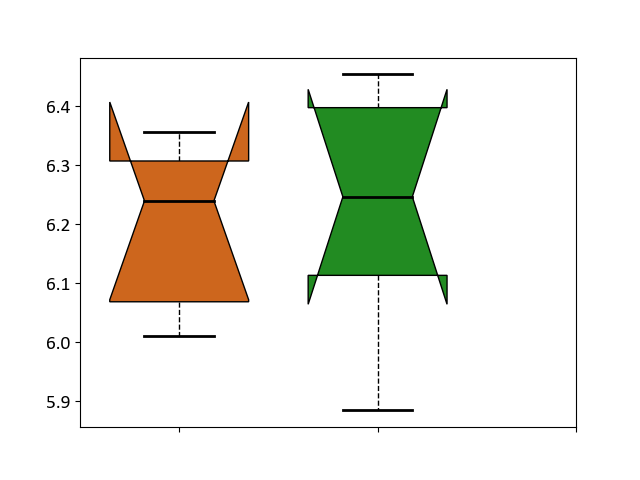
|
Click to View the Clearer Original Diagram | |||
| ICD Disease Classification 20 | Developmental anomaly | Click to Show/Hide | |||
| ICD-11: LD2C | Overgrowth syndrome | Click to Show/Hide | |||
| The Studied Tissue | Adipose tissue | ||||
| The Specified Disease | Simpson golabi behmel syndrome [ICD-11:LD2C] | ||||
| The Expression Level of Disease Section Compare with the Healthy Individual Tissue | p-value: 0.542169847; Fold-change: 0.016837284; Z-score: 0.131349814 | ||||
|
Target expression in the diseased tissue of patients
Target expression in the normal tissue of healthy individuals
|
|||||
| Boxplot of Target Disease-specific Protein Abundances |
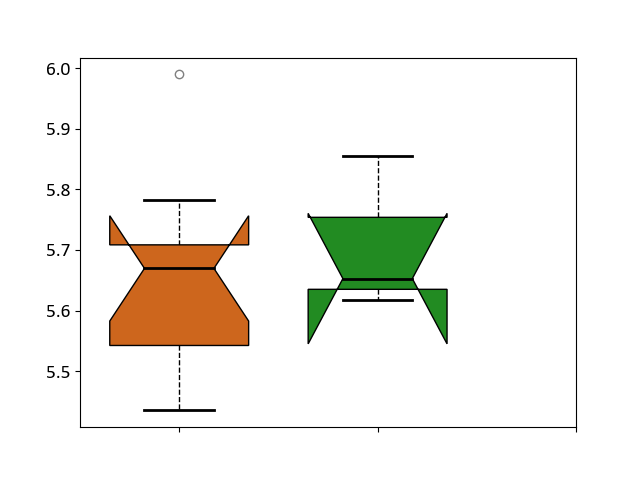
|
Click to View the Clearer Original Diagram | |||
| ICD-11: LD2D | Phakomatoses/hamartoneoplastic syndrome | Click to Show/Hide | |||
| The Studied Tissue | Perituberal tissue | ||||
| The Specified Disease | Tuberous sclerosis complex [ICD-11:LD2D.2] | ||||
| The Expression Level of Disease Section Compare with the Healthy Individual Tissue | p-value: 0.220624457; Fold-change: -0.114470346; Z-score: -0.512758399 | ||||
|
Target expression in the diseased tissue of patients
Target expression in the normal tissue of healthy individuals
|
|||||
| Boxplot of Target Disease-specific Protein Abundances |
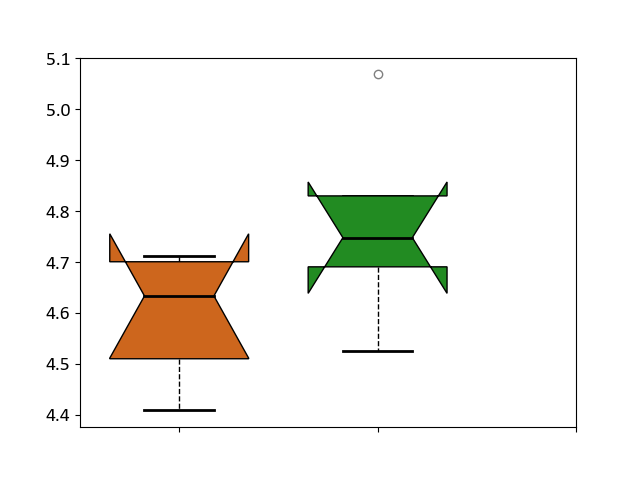
|
Click to View the Clearer Original Diagram | |||
| References | Top | ||||
|---|---|---|---|---|---|
| 1 | Coronaviruses - drug discovery and therapeutic options. Nat Rev Drug Discov. 2016 May;15(5):327-47. | ||||
| 2 | ClinicalTrials.gov (NCT04341675) Sirolimus Treatment in Hospitalized Patients With COVID-19 Pneumonia. U.S. National Institutes of Health. | ||||
| 3 | Prevent COVID-19 Severity by Repurposing mTOR Inhibitors. 2 April 2020 | ||||
| 4 | Network-based drug repurposing for novel coronavirus 2019-nCoV/SARS-CoV-2. Cell Discov. 2020 Mar 16;6:14. | ||||
If You Find Any Error in Data or Bug in Web Service, Please Kindly Report It to Dr. Zhou and Dr. Zhang.