

Target expression details
| Target's General Information | |||||
|---|---|---|---|---|---|
| Target ID | T07303 | ||||
| Target Name | Vascular endothelial growth factor receptor 3 (FLT-4) | ||||
| Synonyms | VEGFR3; VEGFR-3; VEGF-3 receptor; Tyrosine-protein kinase receptor FLT4; Fms-like tyrosine kinase 4 | ||||
| Target Type | Successful | ||||
| Gene Name | FLT4 | ||||
| Biochemical Class | Kinase | ||||
| UniProt ID | VGFR3_HUMAN | ||||
| Target's Expression Profile in Disease Related Tissue between Patients and Normal People | |||||
| Disease | Rectal cancer | ||||
| Example drug | Regorafenib | Approved | [1], [2], [3], [4] | ||
| Tissue | Rectal colon tissue | ||||
| Level of differential expression between the patients in the disease section of the tissue and the tissues of healthy individual |
Fold-change: 0.12 Z-score: 1.23 P-value: 3.75E-02 |
||||
| Level of differential expression between the patients in the disease section of the tissue section of the tissue adjacent to the disease section |
Fold-change: 0.12 Z-score: 0.61 P-value: 8.75E-02 |
||||
|
Target gene expression profiles of the patients in the disease section of the tissue
Target gene expression profiles of the patients in the normal section of the tissue adjacent to the disease section
Target gene expression profiles in the tissue of healthy individual
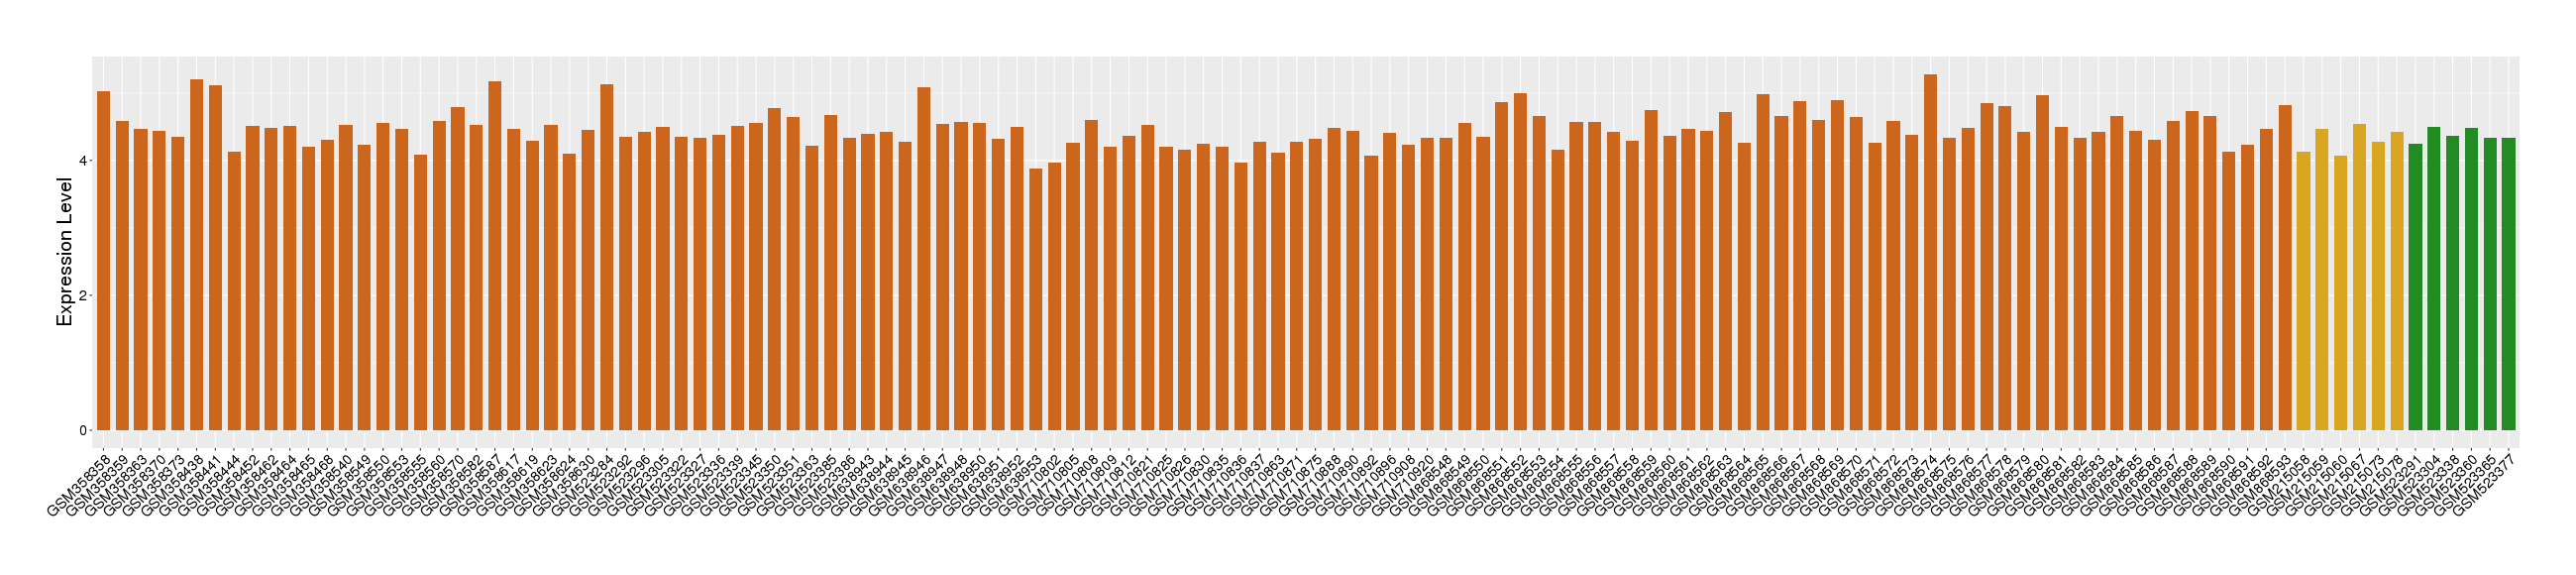
|
|||||
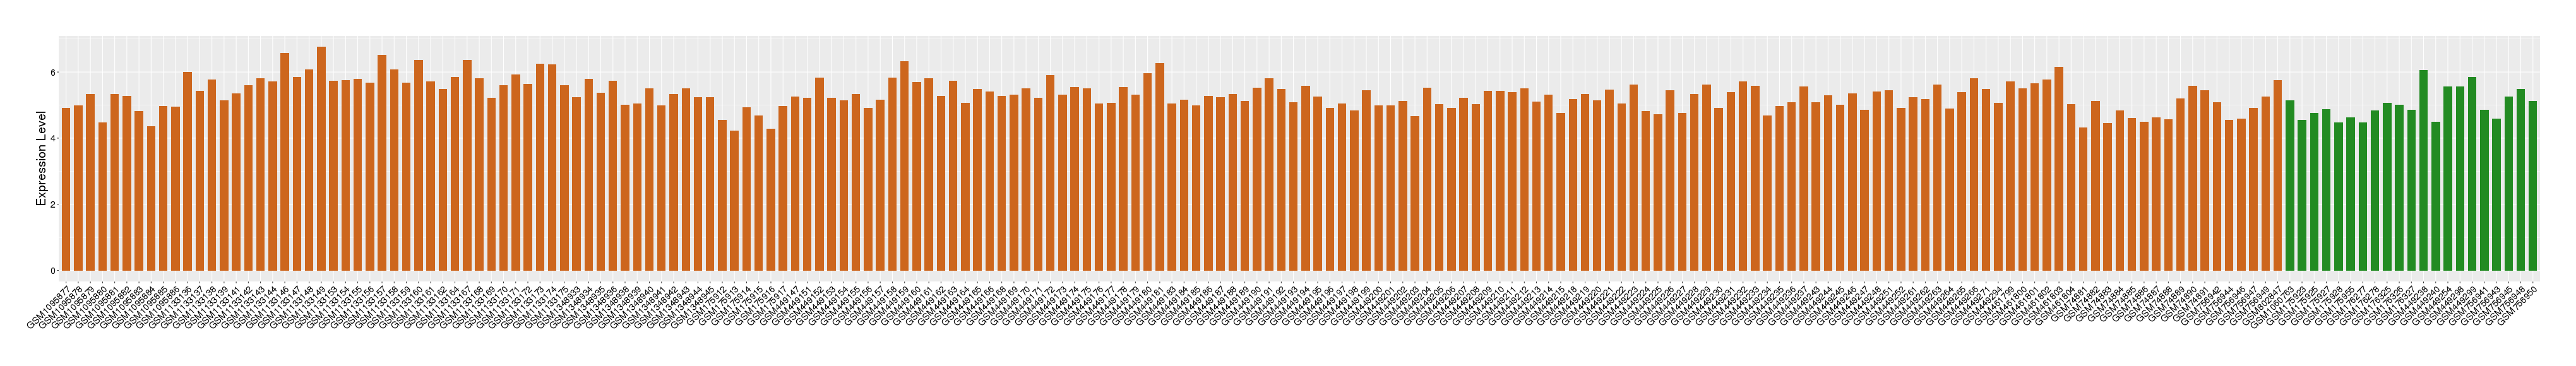
| Disease | Renal cancer | ||||
| Example drug | Tivozanib | Phase 3 | [3], [4], [5], [6] | ||
| Tissue | Kidney | ||||
| Level of differential expression between the patients in the disease section of the tissue and the tissues of healthy individual |
Fold-change: -0.17 Z-score: -0.69 P-value: 7.15E-01 |
||||
| Level of differential expression between the patients in the disease section of the tissue section of the tissue adjacent to the disease section |
Fold-change: -0.06 Z-score: -0.2 P-value: 2.66E-01 |
||||
|
Target gene expression profiles of the patients in the disease section of the tissue
Target gene expression profiles of the patients in the normal section of the tissue adjacent to the disease section
Target gene expression profiles in the tissue of healthy individual

|
|||||
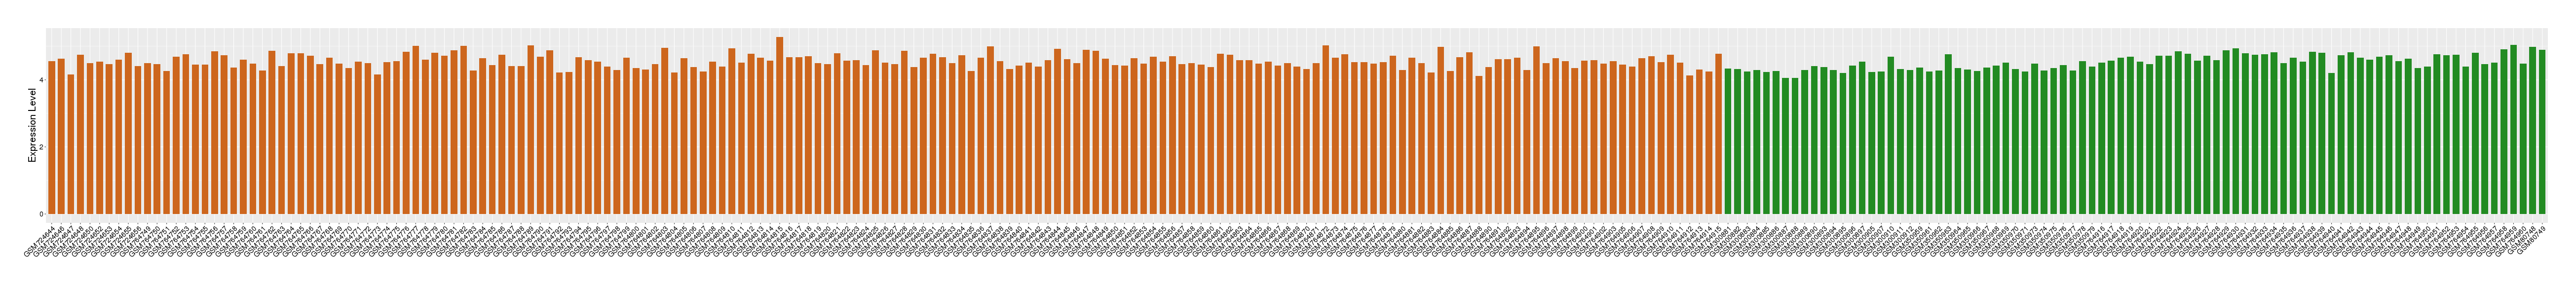
| Disease | Lung cancer | ||||
| Example drug | PI-88 | Phase 2 | [7], [3], [4] | ||
| Tissue | Lung tissue | ||||
| Level of differential expression between the patients in the disease section of the tissue and the tissues of healthy individual |
Fold-change: -0.64 Z-score: -1.74 P-value: 4.66E-60 |
||||
| Level of differential expression between the patients in the disease section of the tissue section of the tissue adjacent to the disease section |
Fold-change: -0.89 Z-score: -2.29 P-value: 6.90E-51 |
||||
|
Target gene expression profiles of the patients in the disease section of the tissue
Target gene expression profiles of the patients in the normal section of the tissue adjacent to the disease section
Target gene expression profiles in the tissue of healthy individual

|
|||||
| Disease | Prostate cancer | ||||
| Example drug | PI-88 | Phase 2 | [7], [3], [4] | ||
| Tissue | Prostate | ||||
| Level of differential expression between the patients in the disease section of the tissue and the tissues of healthy individual |
Fold-change: 0.45 Z-score: 0.97 P-value: 8.36E-03 |
||||
|
Target gene expression profiles of the patients in the disease section of the tissue
Target gene expression profiles in the tissue of healthy individual
|
|||||
| Disease | Alzheimer's disease | ||||
| Example drug | MK-2461 | Phase 1/2 | [8], [3], [4] | ||
| Tissue | Entorhinal cortex | ||||
| Level of differential expression between the patients in the disease section of the tissue and the tissues of healthy individual |
Fold-change: -0.04 Z-score: -0.23 P-value: 6.00E-01 |
||||
|
Target gene expression profiles of the patients in the disease section of the tissue
Target gene expression profiles in the tissue of healthy individual

|
|||||
| Disease | Acute myelocytic leukemia | ||||
| Tissue | Bone marrow | ||||
| Level of differential expression between the patients in the disease section of the tissue and the tissues of healthy individual |
Fold-change: 0.02 Z-score: 0.12 P-value: 7.70E-03 |
||||
|
Target gene expression profiles of the patients in the disease section of the tissue
Target gene expression profiles in the tissue of healthy individual

|
|||||
| Disease | Breast cancer | ||||
| Tissue | Breast tissue | ||||
| Level of differential expression between the patients in the disease section of the tissue and the tissues of healthy individual |
Fold-change: -0.31 Z-score: -0.93 P-value: 1.41E-35 |
||||
| Level of differential expression between the patients in the disease section of the tissue section of the tissue adjacent to the disease section |
Fold-change: -0.28 Z-score: -0.91 P-value: 3.89E-09 |
||||
|
Target gene expression profiles of the patients in the disease section of the tissue
Target gene expression profiles of the patients in the normal section of the tissue adjacent to the disease section
Target gene expression profiles in the tissue of healthy individual

|
|||||
| Disease | Head and neck cancer | ||||
| Tissue | Head and neck tissue | ||||
| Level of differential expression between the patients in the disease section of the tissue and the tissues of healthy individual |
Fold-change: 0.04 Z-score: 0.17 P-value: 1.14E-01 |
||||
|
Target gene expression profiles of the patients in the disease section of the tissue
Target gene expression profiles in the tissue of healthy individual
|
|||||
| Disease | Myelodysplastic syndromes | ||||
| Tissue | Bone marrow | ||||
| Level of differential expression between the patients in the disease section of the tissue and the tissues of healthy individual |
Fold-change: -0.06 Z-score: -0.41 P-value: 9.59E-01 |
||||
| Level of differential expression between the patients in the disease section of the tissue section of the tissue adjacent to the disease section |
Fold-change: -0.26 Z-score: -0.69 P-value: 2.94E-01 |
||||
|
Target gene expression profiles of the patients in the disease section of the tissue
Target gene expression profiles of the patients in the normal section of the tissue adjacent to the disease section
Target gene expression profiles in the tissue of healthy individual

|
|||||
| Target's Expression Profile across Various Tissues of Healthy Individual | |||||
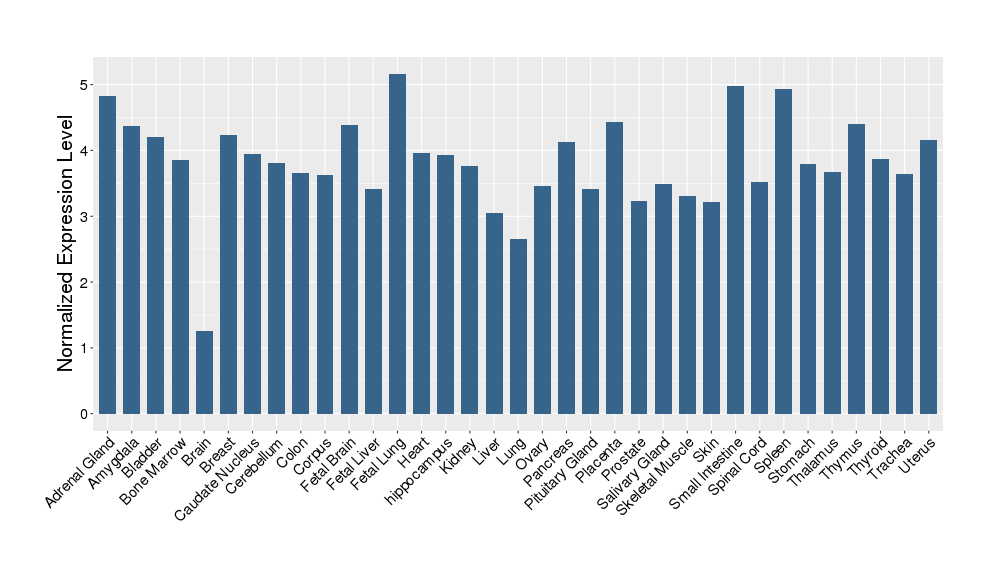
|
|||||
| References | |||||
| REF 1 | URL: http://www.guidetopharmacology.org Nucleic Acids Res. 2015 Oct 12. pii: gkv1037. The IUPHAR/BPS Guide to PHARMACOLOGY in 2016: towards curated quantitative interactions between 1300 protein targets and 6000 ligands. (Ligand id: 5891). | ||||
| REF 2 | Nat Rev Drug Discov. 2013 Feb;12(2):87-90. | ||||
| REF 3 | Interpreting expression profiles of cancers by genome-wide survey of breadth of expression in normal tissues. Genomics 2005 Aug;86(2):127-41. | ||||
| REF 4 | NCBI GEO: archive for functional genomics data sets--update. Nucleic Acids Res. 2013 Jan;41(Database issue):D991-5. | ||||
| REF 5 | URL: http://www.guidetopharmacology.org Nucleic Acids Res. 2015 Oct 12. pii: gkv1037. The IUPHAR/BPS Guide to PHARMACOLOGY in 2016: towards curated quantitative interactions between 1300 protein targets and 6000 ligands. (Ligand id: 6058). | ||||
| REF 6 | ClinicalTrials.gov (NCT01076010) An Extension Treatment Protocol for Subjects Who Have Participated in a Phase 3 Study of Tivozanib Versus Sorafenib in Renal Cell Carcinoma (Protocol AV-951-09-301). U.S. National Institutes of Health. | ||||
| REF 7 | Emerging therapies for multiple myeloma. Expert Opin Emerg Drugs. 2009 Mar;14(1):99-127. | ||||
| REF 8 | MK-2461, a novel multitargeted kinase inhibitor, preferentially inhibits the activated c-Met receptor. Cancer Res. 2010 Feb 15;70(4):1524-33. | ||||
If You Find Any Error in Data or Bug in Web Service, Please Kindly Report It to Dr. Zhou and Dr. Zhang.