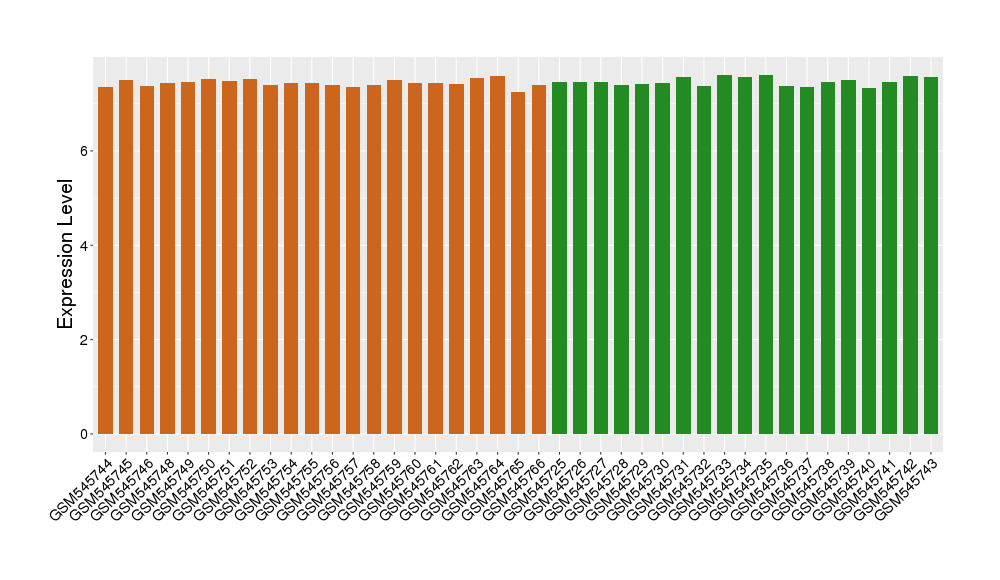
Target expression details
| Target's General Information | |||||
|---|---|---|---|---|---|
| Target ID | T46360 | ||||
| Target Name | Opioid receptor sigma 1 (OPRS1) | ||||
| Synonyms | hSigmaR1; Sigma1R; Sigma1-receptor; Sigma non-opioid intracellular receptor 1; Sigma 1-type opioid receptor; SRBP; SR31747-binding protein; SR31747 binding protein 1; SR-BP; SIG-1R; Opioid receptor, sigma 1, isoform 1; OPRS1 protein; Aging-associated gene 8 protein; AAG8 | ||||
| Target Type | Successful | ||||
| Gene Name | SIGMAR1 | ||||
| Biochemical Class | GPCR rhodopsin | ||||
| UniProt ID | SGMR1_HUMAN | ||||
| Target's Expression Profile in Disease Related Tissue between Patients and Normal People | |||||
| Disease | Schizophrenia | ||||
| Example drug | CM-2395 | Phase 3 | [1], [2], [3] | ||
| Tissue | Pre-frontal cortex | ||||
| Level of differential expression between the patients in the disease section of the tissue and the tissues of healthy individual |
Fold-change: -0.02 Z-score: -0.07 P-value: 7.77E-01 |
||||
|
Target gene expression profiles of the patients in the disease section of the tissue
Target gene expression profiles in the tissue of healthy individual

|
|||||
| Disease | Schizophrenia | ||||
| Example drug | CM-2395 | Phase 3 | [1], [2], [3] | ||
| Tissue | Superior temporal cortex | ||||
| Level of differential expression between the patients in the disease section of the tissue and the tissues of healthy individual |
Fold-change: -0.01 Z-score: -0.17 P-value: 1.88E-01 |
||||
|
Target gene expression profiles of the patients in the disease section of the tissue
Target gene expression profiles in the tissue of healthy individual

|
|||||
| Disease | Depression | ||||
| Example drug | Igmesine | Phase 2 | [2], [3], [4] | ||
| Tissue | Pre-frontal cortex | ||||
| Level of differential expression between the patients in the disease section of the tissue and the tissues of healthy individual |
Fold-change: 0.03 Z-score: 0.26 P-value: 4.34E-01 |
||||
|
Target gene expression profiles of the patients in the disease section of the tissue
Target gene expression profiles in the tissue of healthy individual

|
|||||
| Disease | Alzheimer's disease | ||||
| Example drug | ANAVEX 2-73 | Phase 1 | [2], [3], [5], [6] | ||
| Tissue | Entorhinal cortex | ||||
| Level of differential expression between the patients in the disease section of the tissue and the tissues of healthy individual |
Fold-change: -0.12 Z-score: -0.62 P-value: 2.77E-06 |
||||
|
Target gene expression profiles of the patients in the disease section of the tissue
Target gene expression profiles in the tissue of healthy individual

|
|||||
| Disease | Melanoma | ||||
| Example drug | ANAVEX 1007 | Preclinical | [7], [2], [3] | ||
| Tissue | Skin | ||||
| Level of differential expression between the patients in the disease section of the tissue and the tissues of healthy individual |
Fold-change: -3.56E-03 Z-score: -0.01 P-value: 7.53E-01 |
||||
|
Target gene expression profiles of the patients in the disease section of the tissue
Target gene expression profiles in the tissue of healthy individual

|
|||||
| Disease | Prostate cancer | ||||
| Example drug | ANAVEX 1007 | Preclinical | [7], [2], [3] | ||
| Tissue | Prostate | ||||
| Level of differential expression between the patients in the disease section of the tissue and the tissues of healthy individual |
Fold-change: 0.31 Z-score: 0.6 P-value: 9.08E-03 |
||||
|
Target gene expression profiles of the patients in the disease section of the tissue
Target gene expression profiles in the tissue of healthy individual

|
|||||
| Disease | Breast cancer | ||||
| Tissue | Breast tissue | ||||
| Level of differential expression between the patients in the disease section of the tissue and the tissues of healthy individual |
Fold-change: 0.27 Z-score: 0.63 P-value: 1.60E-20 |
||||
| Level of differential expression between the patients in the disease section of the tissue section of the tissue adjacent to the disease section |
Fold-change: -0.02 Z-score: -0.04 P-value: 6.16E-02 |
||||
|
Target gene expression profiles of the patients in the disease section of the tissue
Target gene expression profiles of the patients in the normal section of the tissue adjacent to the disease section
Target gene expression profiles in the tissue of healthy individual

|
|||||
| Target's Expression Profile across Various Tissues of Healthy Individual | |||||

|
|||||
| References | |||||
| REF 1 | Pharmaceutical Research Companies Are Developing More Than 300 Medicines to Treat Mental Illnesses. Pharmaceutical Research and Manufacturers of America report.2010. | ||||
| REF 2 | Interpreting expression profiles of cancers by genome-wide survey of breadth of expression in normal tissues. Genomics 2005 Aug;86(2):127-41. | ||||
| REF 3 | NCBI GEO: archive for functional genomics data sets--update. Nucleic Acids Res. 2013 Jan;41(Database issue):D991-5. | ||||
| REF 4 | Trusted, scientifically sound profiles of drug programs, clinical trials, safety reports, and company deals, written by scientists. Springer. 2015. Adis Insight (drug id 800001429) | ||||
| REF 5 | Blockade of Tau hyperphosphorylation and Abeta generation by the aminotetrahydrofuran derivative ANAVEX2-73, a mixed muscarinic and receptor agonist, in a nontransgenic mouse model of Alzheimer's disease. Neuropsychopharmacology. 2013 Aug;38(9):1706-23. | ||||
| REF 6 | Anti-amnesic and neuroprotective potentials of the mixed muscarinic receptor/sigma 1 ( 1) ligand ANAVEX2-73, a novel aminotetrahydrofuran derivative. J Psychopharmacol. 2011 Aug;25(8):1101-17. | ||||
| REF 7 | 2011 Pipeline of Anavex. | ||||
If You Find Any Error in Data or Bug in Web Service, Please Kindly Report It to Dr. Zhou and Dr. Zhang.

