

Target expression details
| Target's General Information | |||||
|---|---|---|---|---|---|
| Target ID | T53524 | ||||
| Target Name | Platelet-derived growth factor receptor alpha (PDGFRA) | ||||
| Synonyms | RHEPDGFRA; Platelet-derived growth factor receptor 2; Platelet-derived growth factor alpha receptor; PDGFR2; PDGFR-alpha; PDGFR-2; PDGF-R-alpha; CD140a antigen; CD140a; CD140 antigen-like family member A; Alpha-type platelet-derived growth factor receptor; Alpha platelet-derived growth factor receptor | ||||
| Target Type | Successful | ||||
| Gene Name | PDGFRA | ||||
| Biochemical Class | Kinase | ||||
| UniProt ID | PGFRA_HUMAN | ||||
| Target's Expression Profile in Disease Related Tissue between Patients and Normal People | |||||
| Disease | Gastric cancer | ||||
| Example drug | CP-868596 | Phase 3 | [1], [2], [3], [4] | ||
| Tissue | Gastric tissue | ||||
| Level of differential expression between the patients in the disease section of the tissue and the tissues of healthy individual |
Fold-change: -0.23 Z-score: -1.55 P-value: 3.46E-01 |
||||
| Level of differential expression between the patients in the disease section of the tissue section of the tissue adjacent to the disease section |
Fold-change: -0.16 Z-score: -0.73 P-value: 1.75E-01 |
||||
|
Target gene expression profiles of the patients in the disease section of the tissue
Target gene expression profiles of the patients in the normal section of the tissue adjacent to the disease section
Target gene expression profiles in the tissue of healthy individual

|
|||||
| Disease | Glioma | ||||
| Example drug | MEDI-575 | Phase 2 | [5], [3], [4] | ||
| Tissue | Brainstem tissue | ||||
| Level of differential expression between the patients in the disease section of the tissue and the tissues of healthy individual |
Fold-change: 1.37 Z-score: 3.31 P-value: 4.48E-02 |
||||
|
Target gene expression profiles of the patients in the disease section of the tissue
Target gene expression profiles in the tissue of healthy individual
|
|||||
| Disease | Glioma | ||||
| Example drug | MEDI-575 | Phase 2 | [5], [3], [4] | ||
| Tissue | White matter | ||||
| Level of differential expression between the patients in the disease section of the tissue and the tissues of healthy individual |
Fold-change: 2.15 Z-score: 1.46 P-value: 9.98E-03 |
||||
|
Target gene expression profiles of the patients in the disease section of the tissue
Target gene expression profiles in the tissue of healthy individual
|
|||||
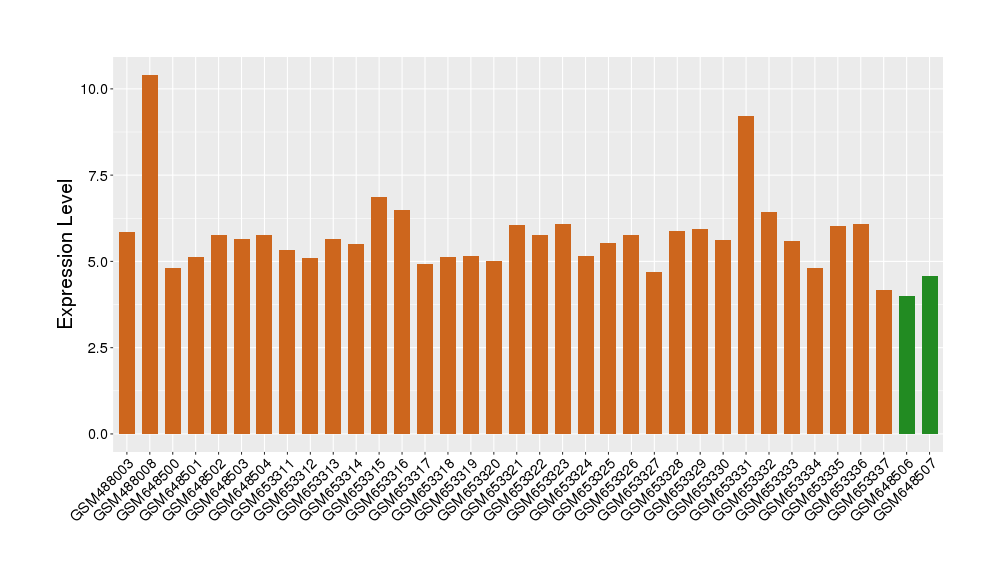
| Disease | Ovarian cancer | ||||
| Example drug | Olaratumab | Phase 1 | [6], [3], [4] | ||
| Tissue | Ovarian tissue | ||||
| Level of differential expression between the patients in the disease section of the tissue and the tissues of healthy individual |
Fold-change: -1.66 Z-score: -1.59 P-value: 1.31E-03 |
||||
| Level of differential expression between the patients in the disease section of the tissue section of the tissue adjacent to the disease section |
Fold-change: -0.74 Z-score: -1.97 P-value: 1.14E-05 |
||||
|
Target gene expression profiles of the patients in the disease section of the tissue
Target gene expression profiles of the patients in the normal section of the tissue adjacent to the disease section
Target gene expression profiles in the tissue of healthy individual

|
|||||
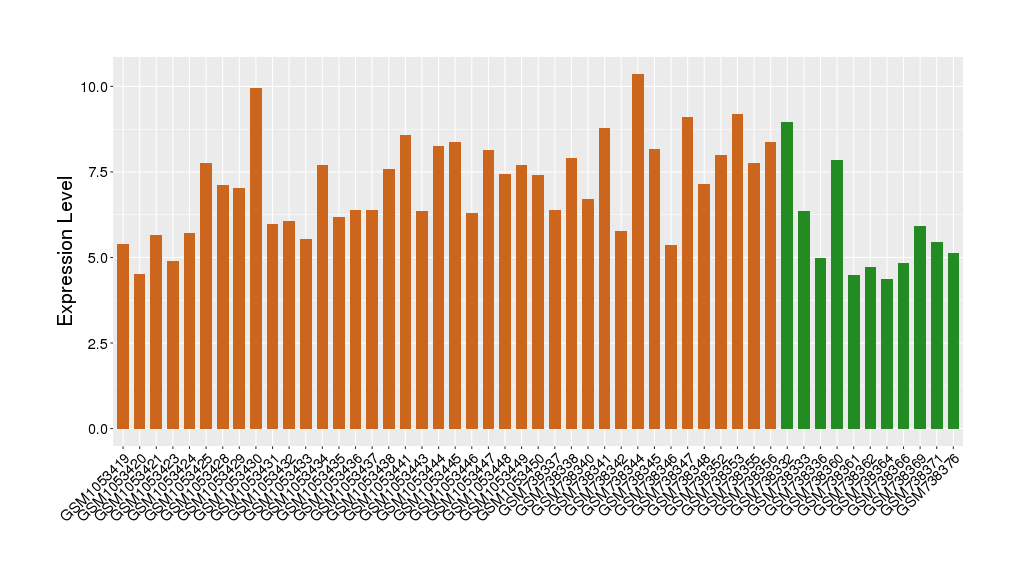
| Disease | Renal cancer | ||||
| Tissue | Kidney | ||||
| Level of differential expression between the patients in the disease section of the tissue and the tissues of healthy individual |
Fold-change: -0.38 Z-score: -1.26 P-value: 1.48E-03 |
||||
| Level of differential expression between the patients in the disease section of the tissue section of the tissue adjacent to the disease section |
Fold-change: -0.12 Z-score: -0.62 P-value: 9.43E-03 |
||||
|
Target gene expression profiles of the patients in the disease section of the tissue
Target gene expression profiles of the patients in the normal section of the tissue adjacent to the disease section
Target gene expression profiles in the tissue of healthy individual

|
|||||
| Target's Expression Profile across Various Tissues of Healthy Individual | |||||
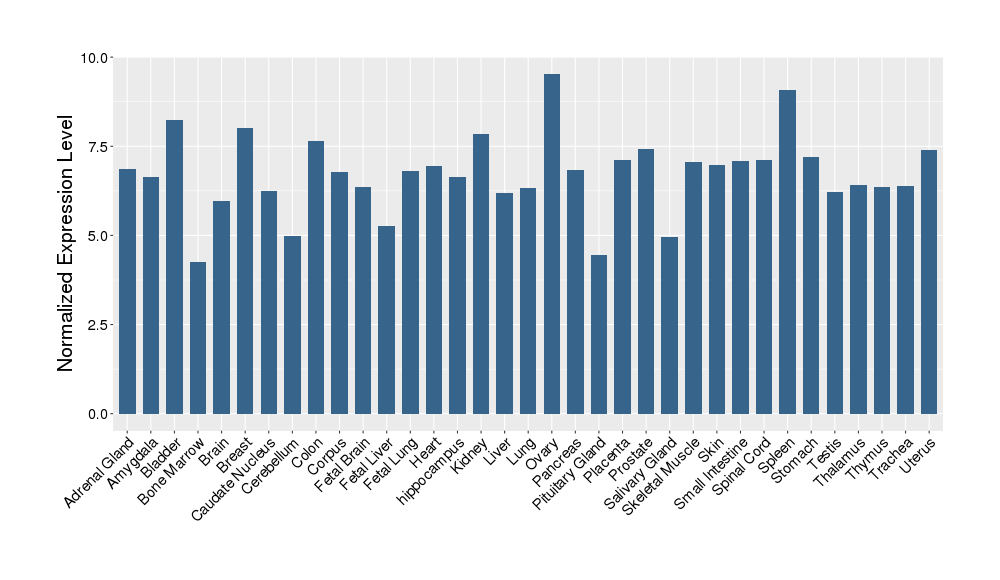
|
|||||
| References | |||||
| REF 1 | URL: http://www.guidetopharmacology.org Nucleic Acids Res. 2015 Oct 12. pii: gkv1037. The IUPHAR/BPS Guide to PHARMACOLOGY in 2016: towards curated quantitative interactions between 1300 protein targets and 6000 ligands. (Ligand id: 7882). | ||||
| REF 2 | Trusted, scientifically sound profiles of drug programs, clinical trials, safety reports, and company deals, written by scientists. Springer. 2015. Adis Insight (drug id 800015430) | ||||
| REF 3 | Interpreting expression profiles of cancers by genome-wide survey of breadth of expression in normal tissues. Genomics 2005 Aug;86(2):127-41. | ||||
| REF 4 | NCBI GEO: archive for functional genomics data sets--update. Nucleic Acids Res. 2013 Jan;41(Database issue):D991-5. | ||||
| REF 5 | Clinical pipeline report, company report or official report of MedImmune (2011). | ||||
| REF 6 | 2016 FDA drug approvals. Nat Rev Drug Discov. 2017 Feb 2;16(2):73-76. | ||||
If You Find Any Error in Data or Bug in Web Service, Please Kindly Report It to Dr. Zhou and Dr. Zhang.