

Target expression details
| Target's General Information | |||||
|---|---|---|---|---|---|
| Target ID | T63966 | ||||
| Target Name | Vascular endothelial growth factor receptor 1 (FLT-1) | ||||
| Synonyms | Vascular permeability factor receptor; VEGFR1; VEGFR-1; VEGF-1 receptor; Tyrosine-protein kinase receptor FLT; Tyrosine-protein kinase FRT; Fms-like tyrosine kinase 1; FRT; FLT | ||||
| Target Type | Successful | ||||
| Gene Name | FLT1 | ||||
| Biochemical Class | Kinase | ||||
| UniProt ID | VGFR1_HUMAN | ||||
| Target's Expression Profile in Disease Related Tissue between Patients and Normal People | |||||
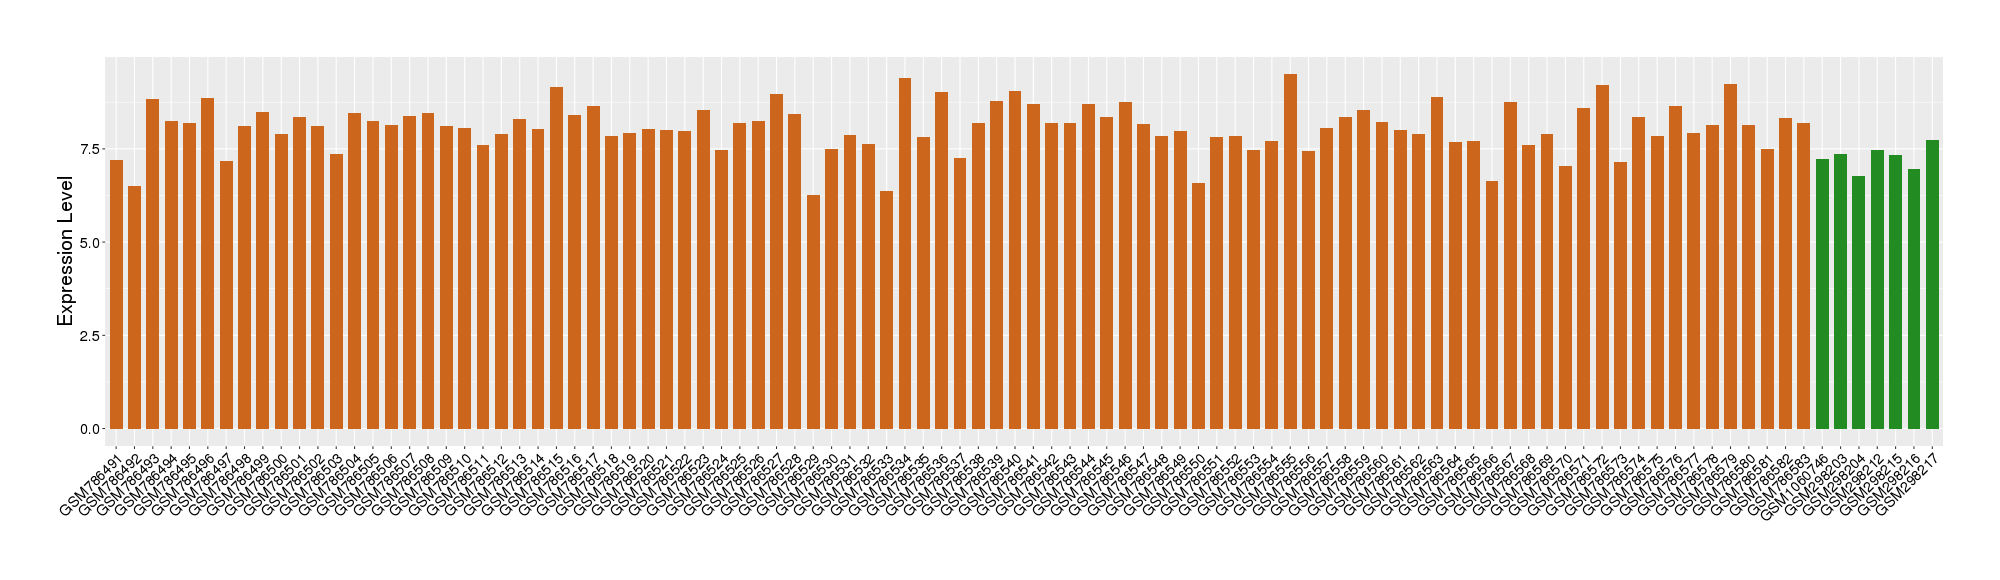
| Disease | Renal cancer | ||||
| Example drug | Tivozanib | Phase 3 | [1], [2], [3], [4] | ||
| Tissue | Kidney | ||||
| Level of differential expression between the patients in the disease section of the tissue and the tissues of healthy individual |
Fold-change: 0.9 Z-score: 1.6 P-value: 3.48E-03 |
||||
| Level of differential expression between the patients in the disease section of the tissue section of the tissue adjacent to the disease section |
Fold-change: 0.99 Z-score: 1.75 P-value: 4.80E-11 |
||||
|
Target gene expression profiles of the patients in the disease section of the tissue
Target gene expression profiles of the patients in the normal section of the tissue adjacent to the disease section
Target gene expression profiles in the tissue of healthy individual

|
|||||
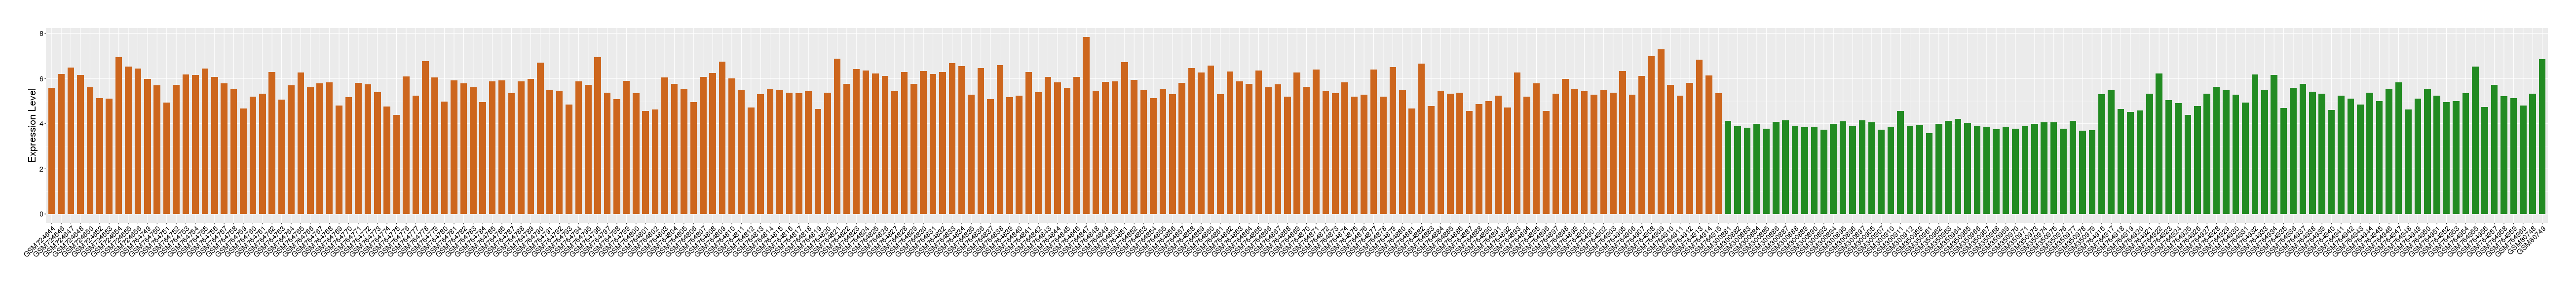
| Disease | Ovarian cancer | ||||
| Example drug | Nintedanib | Phase 2 | [3], [4], [5], [6], [7] | ||
| Tissue | Ovarian tissue | ||||
| Level of differential expression between the patients in the disease section of the tissue and the tissues of healthy individual |
Fold-change: 0.74 Z-score: 1.24 P-value: 4.94E-03 |
||||
| Level of differential expression between the patients in the disease section of the tissue section of the tissue adjacent to the disease section |
Fold-change: 1.48 Z-score: 5.22 P-value: 4.88E-12 |
||||
|
Target gene expression profiles of the patients in the disease section of the tissue
Target gene expression profiles of the patients in the normal section of the tissue adjacent to the disease section
Target gene expression profiles in the tissue of healthy individual

|
|||||
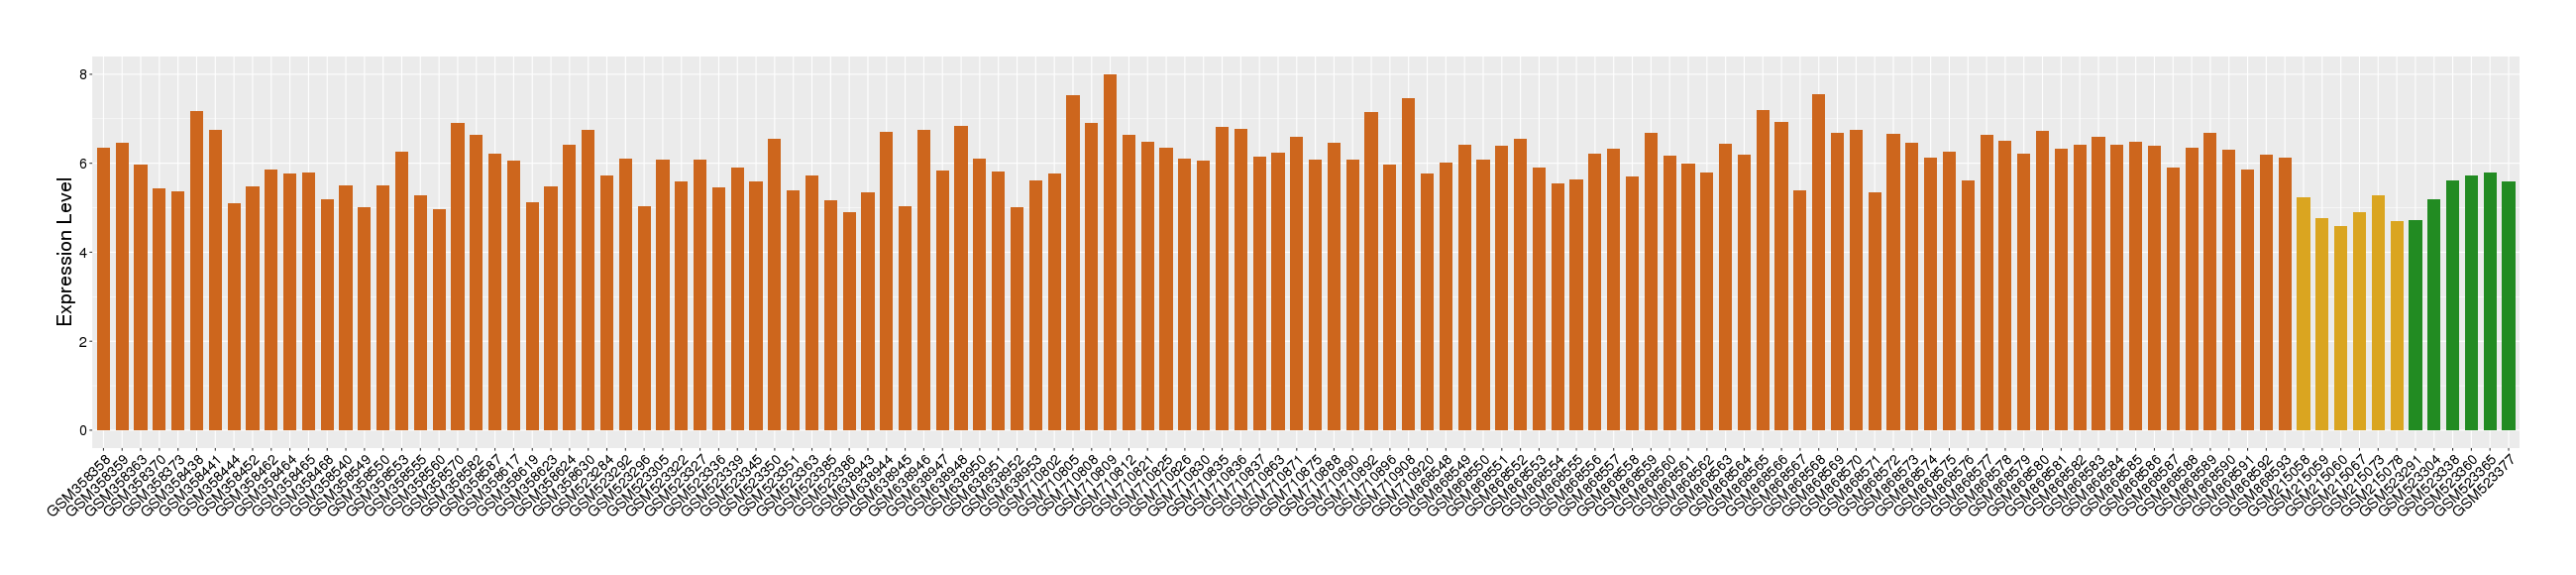
| Disease | Bladder cancer | ||||
| Example drug | LY3012212 | Phase 2 | [8], [3], [4] | ||
| Tissue | Bladder tissue | ||||
| Level of differential expression between the patients in the disease section of the tissue and the tissues of healthy individual |
Fold-change: 0.79 Z-score: 2.48 P-value: 1.30E-04 |
||||
|
Target gene expression profiles of the patients in the disease section of the tissue
Target gene expression profiles in the tissue of healthy individual
|
|||||
| Disease | Acute myelocytic leukemia | ||||
| Tissue | Bone marrow | ||||
| Level of differential expression between the patients in the disease section of the tissue and the tissues of healthy individual |
Fold-change: -0.01 Z-score: -0.06 P-value: 7.84E-01 |
||||
|
Target gene expression profiles of the patients in the disease section of the tissue
Target gene expression profiles in the tissue of healthy individual

|
|||||
| Disease | Breast cancer | ||||
| Tissue | Breast tissue | ||||
| Level of differential expression between the patients in the disease section of the tissue and the tissues of healthy individual |
Fold-change: -0.11 Z-score: -0.15 P-value: 5.78E-01 |
||||
| Level of differential expression between the patients in the disease section of the tissue section of the tissue adjacent to the disease section |
Fold-change: -0.33 Z-score: -0.45 P-value: 1.08E-02 |
||||
|
Target gene expression profiles of the patients in the disease section of the tissue
Target gene expression profiles of the patients in the normal section of the tissue adjacent to the disease section
Target gene expression profiles in the tissue of healthy individual

|
|||||
| Disease | Head and neck cancer | ||||
| Tissue | Head and neck tissue | ||||
| Level of differential expression between the patients in the disease section of the tissue and the tissues of healthy individual |
Fold-change: 1.1 Z-score: 1.4 P-value: 1.96E-20 |
||||
|
Target gene expression profiles of the patients in the disease section of the tissue
Target gene expression profiles in the tissue of healthy individual
|
|||||
| Disease | Liver cancer | ||||
| Tissue | Liver tissue | ||||
| Level of differential expression between the patients in the disease section of the tissue and the tissues of healthy individual |
Fold-change: 0.63 Z-score: 0.78 P-value: 2.75E-04 |
||||
| Level of differential expression between the patients in the disease section of the tissue section of the tissue adjacent to the disease section |
Fold-change: 0.73 Z-score: 0.98 P-value: 2.68E-21 |
||||
|
Target gene expression profiles of the patients in the disease section of the tissue
Target gene expression profiles of the patients in the normal section of the tissue adjacent to the disease section
Target gene expression profiles in the tissue of healthy individual

|
|||||
| Disease | Myelodysplastic syndromes | ||||
| Tissue | Bone marrow | ||||
| Level of differential expression between the patients in the disease section of the tissue and the tissues of healthy individual |
Fold-change: 0.2 Z-score: 0.92 P-value: 2.87E-04 |
||||
| Level of differential expression between the patients in the disease section of the tissue section of the tissue adjacent to the disease section |
Fold-change: 0.14 Z-score: 0.88 P-value: 5.16E-02 |
||||
|
Target gene expression profiles of the patients in the disease section of the tissue
Target gene expression profiles of the patients in the normal section of the tissue adjacent to the disease section
Target gene expression profiles in the tissue of healthy individual

|
|||||
| Disease | Rectal cancer | ||||
| Tissue | Rectal colon tissue | ||||
| Level of differential expression between the patients in the disease section of the tissue and the tissues of healthy individual |
Fold-change: 0.54 Z-score: 1.33 P-value: 6.82E-03 |
||||
| Level of differential expression between the patients in the disease section of the tissue section of the tissue adjacent to the disease section |
Fold-change: 1.3 Z-score: 4.54 P-value: 1.97E-05 |
||||
|
Target gene expression profiles of the patients in the disease section of the tissue
Target gene expression profiles of the patients in the normal section of the tissue adjacent to the disease section
Target gene expression profiles in the tissue of healthy individual
|
|||||
| Target's Expression Profile across Various Tissues of Healthy Individual | |||||
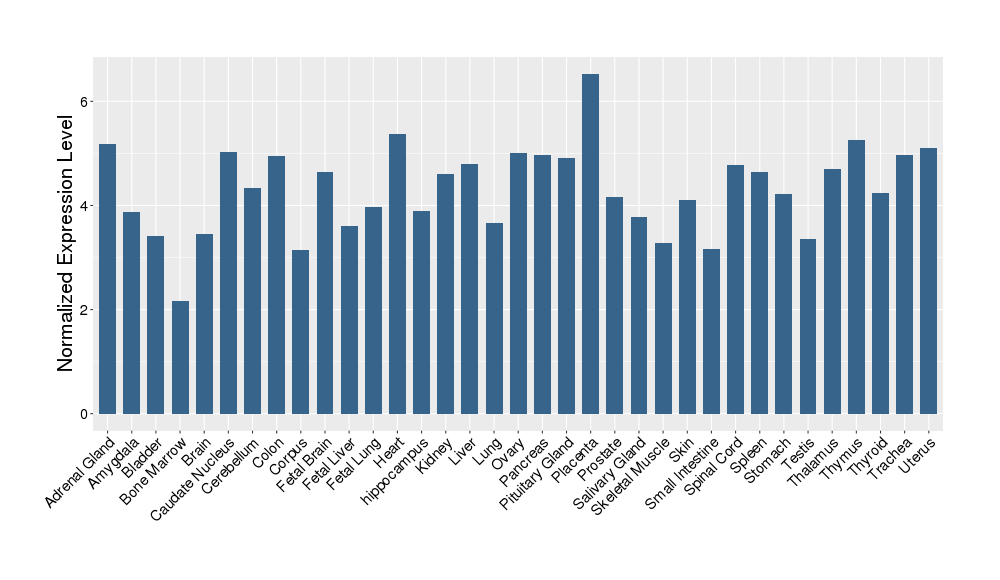
|
|||||
| References | |||||
| REF 1 | URL: http://www.guidetopharmacology.org Nucleic Acids Res. 2015 Oct 12. pii: gkv1037. The IUPHAR/BPS Guide to PHARMACOLOGY in 2016: towards curated quantitative interactions between 1300 protein targets and 6000 ligands. (Ligand id: 6058). | ||||
| REF 2 | ClinicalTrials.gov (NCT01076010) An Extension Treatment Protocol for Subjects Who Have Participated in a Phase 3 Study of Tivozanib Versus Sorafenib in Renal Cell Carcinoma (Protocol AV-951-09-301). U.S. National Institutes of Health. | ||||
| REF 3 | Interpreting expression profiles of cancers by genome-wide survey of breadth of expression in normal tissues. Genomics 2005 Aug;86(2):127-41. | ||||
| REF 4 | NCBI GEO: archive for functional genomics data sets--update. Nucleic Acids Res. 2013 Jan;41(Database issue):D991-5. | ||||
| REF 5 | URL: http://www.guidetopharmacology.org Nucleic Acids Res. 2015 Oct 12. pii: gkv1037. The IUPHAR/BPS Guide to PHARMACOLOGY in 2016: towards curated quantitative interactions between 1300 protein targets and 6000 ligands. (Ligand id: 5936). | ||||
| REF 6 | ClinicalTrials.gov (NCT01979952) Nintedanib Twice Daily vs Placebo in Patients Diagnosed With Idiopathic Pulmonary Fibrosis (IPF). U.S. National Institutes of Health. | ||||
| REF 7 | ClinicalTrials.gov (NCT02231164) LUME-Columbus: Nintedanib Plus Docetaxel in Advanced Non-small Cell Lung Cancer With Translational Research. U.S. National Institutes of Health. | ||||
| REF 8 | Trusted, scientifically sound profiles of drug programs, clinical trials, safety reports, and company deals, written by scientists. Springer. 2015. Adis Insight (drug id 800024862) | ||||
If You Find Any Error in Data or Bug in Web Service, Please Kindly Report It to Dr. Zhou and Dr. Zhang.