

Target expression details
| Target's General Information | |||||
|---|---|---|---|---|---|
| Target ID | T74312 | ||||
| Target Name | Fms-like tyrosine kinase 3 (FLT-3) | ||||
| Synonyms | Stem cell tyrosine kinase 1; STK1; STK-1; Receptor-type tyrosine-protein kinase FLT3; Fetal liver kinase-2; FLT-3; FLK2; FLK-2; FL cytokine receptor; CD135 | ||||
| Target Type | Successful | ||||
| Gene Name | FLT3 | ||||
| Biochemical Class | Kinase | ||||
| UniProt ID | FLT3_HUMAN | ||||
| Target's Expression Profile in Disease Related Tissue between Patients and Normal People | |||||
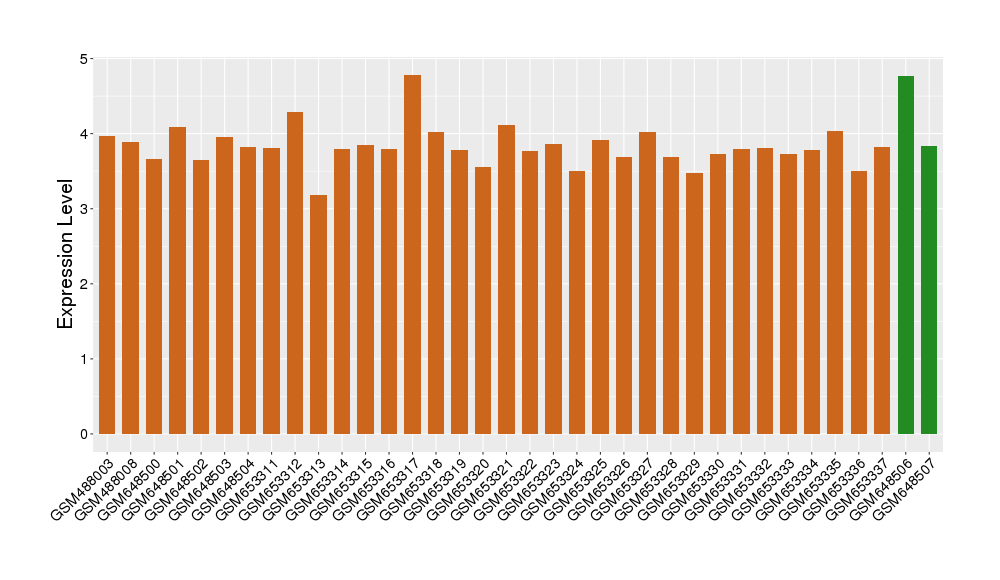
| Disease | Glioma | ||||
| Example drug | Tandutinib | Discontinued in Phase 2 | [1], [2], [3], [4] | ||
| Tissue | Brainstem tissue | ||||
| Level of differential expression between the patients in the disease section of the tissue and the tissues of healthy individual |
Fold-change: -0.49 Z-score: -0.75 P-value: 4.98E-01 |
||||
|
Target gene expression profiles of the patients in the disease section of the tissue
Target gene expression profiles in the tissue of healthy individual
|
|||||
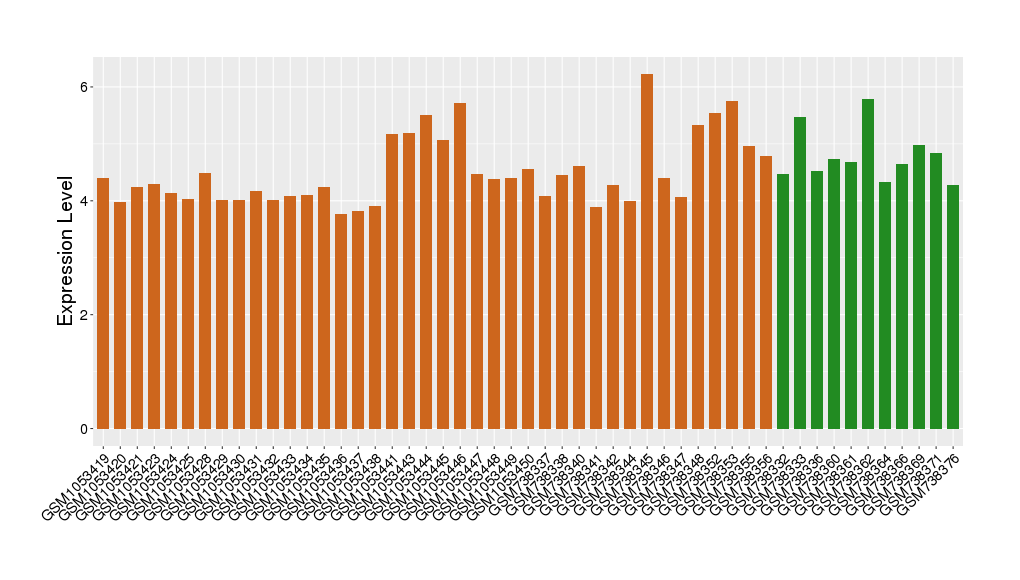
| Disease | Glioma | ||||
| Example drug | Tandutinib | Discontinued in Phase 2 | [1], [2], [3], [4] | ||
| Tissue | White matter | ||||
| Level of differential expression between the patients in the disease section of the tissue and the tissues of healthy individual |
Fold-change: -0.35 Z-score: -0.75 P-value: 1.15E-01 |
||||
|
Target gene expression profiles of the patients in the disease section of the tissue
Target gene expression profiles in the tissue of healthy individual
|
|||||
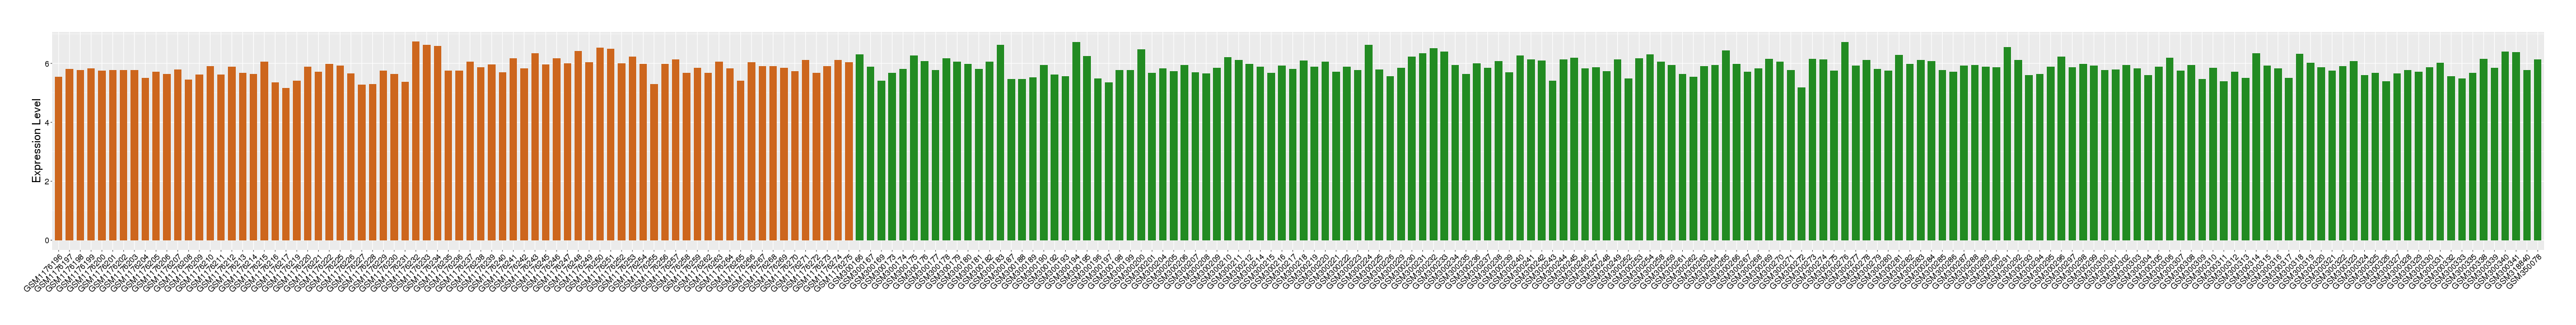
| Disease | Acute myelocytic leukemia | ||||
| Example drug | Midostaurin | Approved | [5], [3], [4] | ||
| Tissue | Bone marrow | ||||
| Level of differential expression between the patients in the disease section of the tissue and the tissues of healthy individual |
Fold-change: 3.41 Z-score: 4.96 P-value: 2.64E-120 |
||||
|
Target gene expression profiles of the patients in the disease section of the tissue
Target gene expression profiles in the tissue of healthy individual

|
|||||
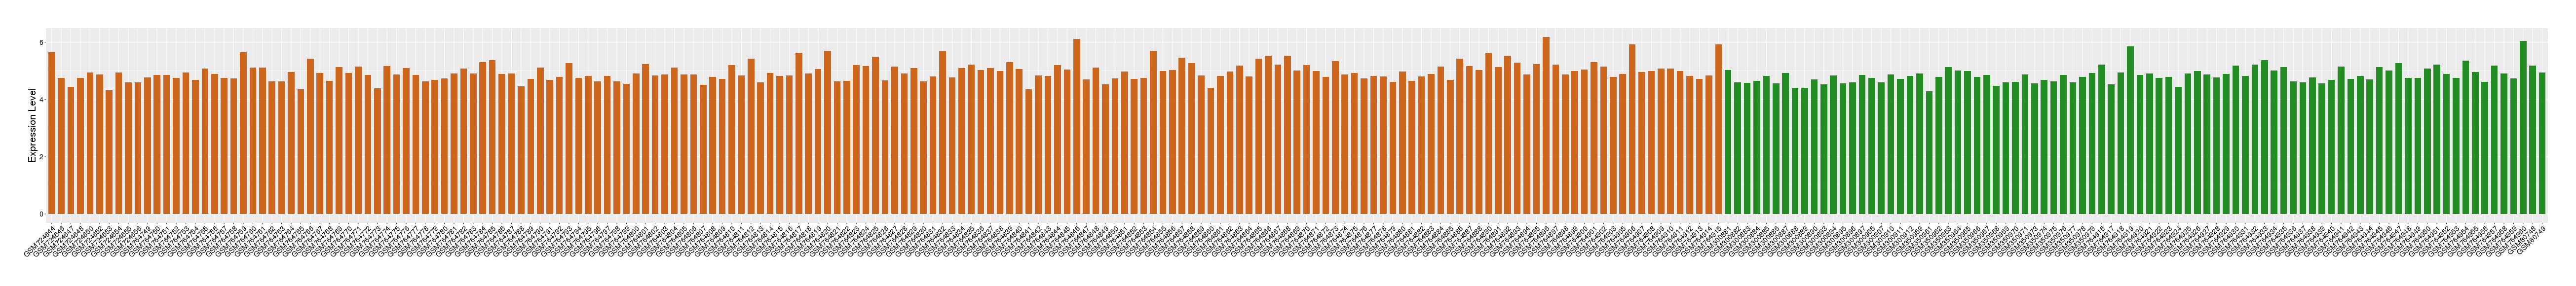
| Disease | Alzheimer's disease | ||||
| Example drug | PLX-3397 | Phase 3 | [6], [3], [4] | ||
| Tissue | Entorhinal cortex | ||||
| Level of differential expression between the patients in the disease section of the tissue and the tissues of healthy individual |
Fold-change: -0.05 Z-score: -0.16 P-value: 2.11E-01 |
||||
|
Target gene expression profiles of the patients in the disease section of the tissue
Target gene expression profiles in the tissue of healthy individual
|
|||||
| Disease | Psoriasis | ||||
| Example drug | Lestaurtinib | Phase 2/3 | [3], [4], [7], [8] | ||
| Tissue | Skin | ||||
| Level of differential expression between the patients in the disease section of the tissue and the tissues of healthy individual |
Fold-change: 0.04 Z-score: 0.11 P-value: 9.51E-04 |
||||
| Level of differential expression between the patients in the disease section of the tissue section of the tissue adjacent to the disease section |
Fold-change: 0.28 Z-score: 0.77 P-value: 3.66E-09 |
||||
|
Target gene expression profiles of the patients in the disease section of the tissue
Target gene expression profiles of the patients in the normal section of the tissue adjacent to the disease section
Target gene expression profiles in the tissue of healthy individual

|
|||||
| Disease | Breast cancer | ||||
| Example drug | Midostaurin | Phase 2 | [5], [3], [4] | ||
| Tissue | Breast tissue | ||||
| Level of differential expression between the patients in the disease section of the tissue and the tissues of healthy individual |
Fold-change: 0.16 Z-score: 0.33 P-value: 1.20E-11 |
||||
| Level of differential expression between the patients in the disease section of the tissue section of the tissue adjacent to the disease section |
Fold-change: -0.06 Z-score: -0.12 P-value: 9.28E-01 |
||||
|
Target gene expression profiles of the patients in the disease section of the tissue
Target gene expression profiles of the patients in the normal section of the tissue adjacent to the disease section
Target gene expression profiles in the tissue of healthy individual

|
|||||
| Disease | Colon cancer | ||||
| Example drug | Midostaurin | Phase 2 | [5], [3], [4] | ||
| Tissue | Colon tissue | ||||
| Level of differential expression between the patients in the disease section of the tissue and the tissues of healthy individual |
Fold-change: -0.21 Z-score: -0.78 P-value: 1.53E-13 |
||||
| Level of differential expression between the patients in the disease section of the tissue section of the tissue adjacent to the disease section |
Fold-change: -0.31 Z-score: -1.09 P-value: 3.90E-24 |
||||
|
Target gene expression profiles of the patients in the disease section of the tissue
Target gene expression profiles of the patients in the normal section of the tissue adjacent to the disease section
Target gene expression profiles in the tissue of healthy individual

|
|||||
| Disease | Gastric cancer | ||||
| Tissue | Gastric tissue | ||||
| Level of differential expression between the patients in the disease section of the tissue and the tissues of healthy individual |
Fold-change: -0.27 Z-score: -0.56 P-value: 7.64E-01 |
||||
| Level of differential expression between the patients in the disease section of the tissue section of the tissue adjacent to the disease section |
Fold-change: -0.07 Z-score: -0.2 P-value: 8.56E-01 |
||||
|
Target gene expression profiles of the patients in the disease section of the tissue
Target gene expression profiles of the patients in the normal section of the tissue adjacent to the disease section
Target gene expression profiles in the tissue of healthy individual

|
|||||
| Disease | Head and neck cancer | ||||
| Tissue | Head and neck tissue | ||||
| Level of differential expression between the patients in the disease section of the tissue and the tissues of healthy individual |
Fold-change: 0.09 Z-score: 0.33 P-value: 1.09E-03 |
||||
|
Target gene expression profiles of the patients in the disease section of the tissue
Target gene expression profiles in the tissue of healthy individual
|
|||||
| Disease | Myelodysplastic syndromes | ||||
| Tissue | Bone marrow | ||||
| Level of differential expression between the patients in the disease section of the tissue and the tissues of healthy individual |
Fold-change: -0.34 Z-score: -0.58 P-value: 1.71E-02 |
||||
| Level of differential expression between the patients in the disease section of the tissue section of the tissue adjacent to the disease section |
Fold-change: 5.15 Z-score: 2.69 P-value: 1.98E-02 |
||||
|
Target gene expression profiles of the patients in the disease section of the tissue
Target gene expression profiles of the patients in the normal section of the tissue adjacent to the disease section
Target gene expression profiles in the tissue of healthy individual

|
|||||
| Disease | Renal cancer | ||||
| Tissue | Kidney | ||||
| Level of differential expression between the patients in the disease section of the tissue and the tissues of healthy individual |
Fold-change: -0.25 Z-score: -0.82 P-value: 1.36E-01 |
||||
| Level of differential expression between the patients in the disease section of the tissue section of the tissue adjacent to the disease section |
Fold-change: -0.41 Z-score: -1.01 P-value: 2.35E-11 |
||||
|
Target gene expression profiles of the patients in the disease section of the tissue
Target gene expression profiles of the patients in the normal section of the tissue adjacent to the disease section
Target gene expression profiles in the tissue of healthy individual

|
|||||
| Disease | Thyroid cancer | ||||
| Tissue | Thyroid | ||||
| Level of differential expression between the patients in the disease section of the tissue and the tissues of healthy individual |
Fold-change: 0.13 Z-score: 0.19 P-value: 5.04E-01 |
||||
| Level of differential expression between the patients in the disease section of the tissue section of the tissue adjacent to the disease section |
Fold-change: 0.06 Z-score: 0.12 P-value: 6.61E-01 |
||||
|
Target gene expression profiles of the patients in the disease section of the tissue
Target gene expression profiles of the patients in the normal section of the tissue adjacent to the disease section
Target gene expression profiles in the tissue of healthy individual

|
|||||
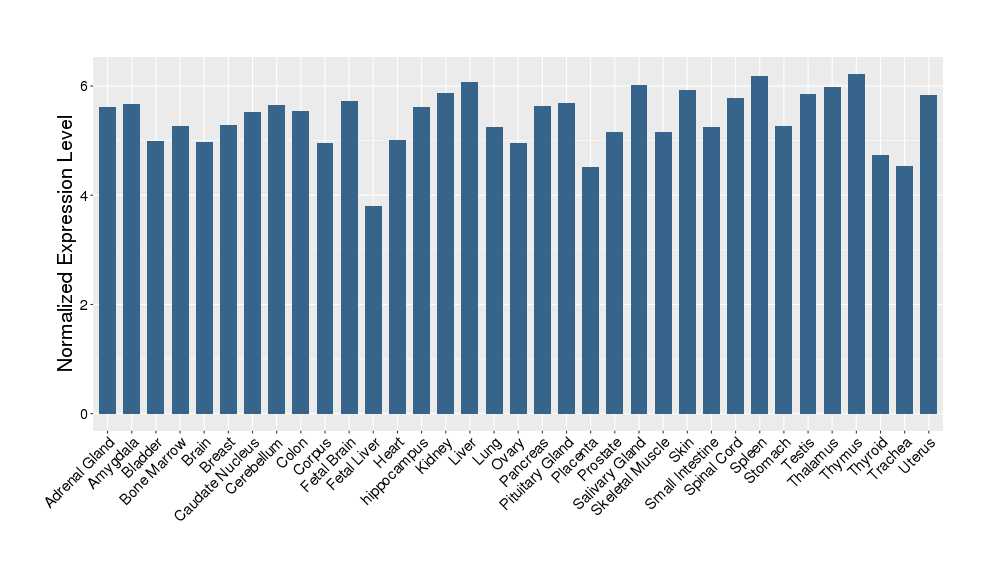
| Target's Expression Profile across Various Tissues of Healthy Individual | |||||
|
|||||
| References | |||||
| REF 1 | URL: http://www.guidetopharmacology.org Nucleic Acids Res. 2015 Oct 12. pii: gkv1037. The IUPHAR/BPS Guide to PHARMACOLOGY in 2016: towards curated quantitative interactions between 1300 protein targets and 6000 ligands. (Ligand id: 5695). | ||||
| REF 2 | Trusted, scientifically sound profiles of drug programs, clinical trials, safety reports, and company deals, written by scientists. Springer. 2015. Adis Insight (drug id 800017148) | ||||
| REF 3 | Interpreting expression profiles of cancers by genome-wide survey of breadth of expression in normal tissues. Genomics 2005 Aug;86(2):127-41. | ||||
| REF 4 | NCBI GEO: archive for functional genomics data sets--update. Nucleic Acids Res. 2013 Jan;41(Database issue):D991-5. | ||||
| REF 5 | Drugs@FDA. U.S. Food and Drug Administration. U.S. Department of Health & Human Services. 2018 | ||||
| REF 6 | ClinicalTrials.gov (NCT02371369) PLX3397 Phase 3 Study for Pigmented Villonodular Synovitis (PVNS) or Giant Cell Tumor of the Tendon Sheath (GCT-TS). U.S. National Institutes of Health. | ||||
| REF 7 | URL: http://www.guidetopharmacology.org Nucleic Acids Res. 2015 Oct 12. pii: gkv1037. The IUPHAR/BPS Guide to PHARMACOLOGY in 2016: towards curated quantitative interactions between 1300 protein targets and 6000 ligands. (Ligand id: 5672). | ||||
| REF 8 | Emerging drugs for psoriasis. Expert Opin Emerg Drugs. 2009 Mar;14(1):145-63. | ||||
If You Find Any Error in Data or Bug in Web Service, Please Kindly Report It to Dr. Zhou and Dr. Zhang.