

Target expression details
| Target's General Information | |||||
|---|---|---|---|---|---|
| Target ID | T75243 | ||||
| Target Name | Serine/threonine-protein kinase mTOR (mTOR) | ||||
| Synonyms | Target of rapamycin; TOR kinase; Rapamycin target protein 1; Rapamycin target protein; Rapamycin and FKBP12 target 1; RAPT1; RAFT1; Mechanistic target of rapamycin; Mammalian target of rapamycin; FRAP2; FRAP1; FRAP; FKBP12-rapamycin complex-associated protein; FKBP-rapamycin associated protein; FK506-binding protein 12-rapamycin complex-associated protein 1 | ||||
| Target Type | Successful | ||||
| Gene Name | MTOR | ||||
| Biochemical Class | Kinase | ||||
| UniProt ID | MTOR_HUMAN | ||||
| Target's Expression Profile in Disease Related Tissue between Patients and Normal People | |||||
| Disease | Myeloma | ||||
| Example drug | Sirolimus | Approved | [1], [2], [3], [4] | ||
| Tissue | Bone marrow | ||||
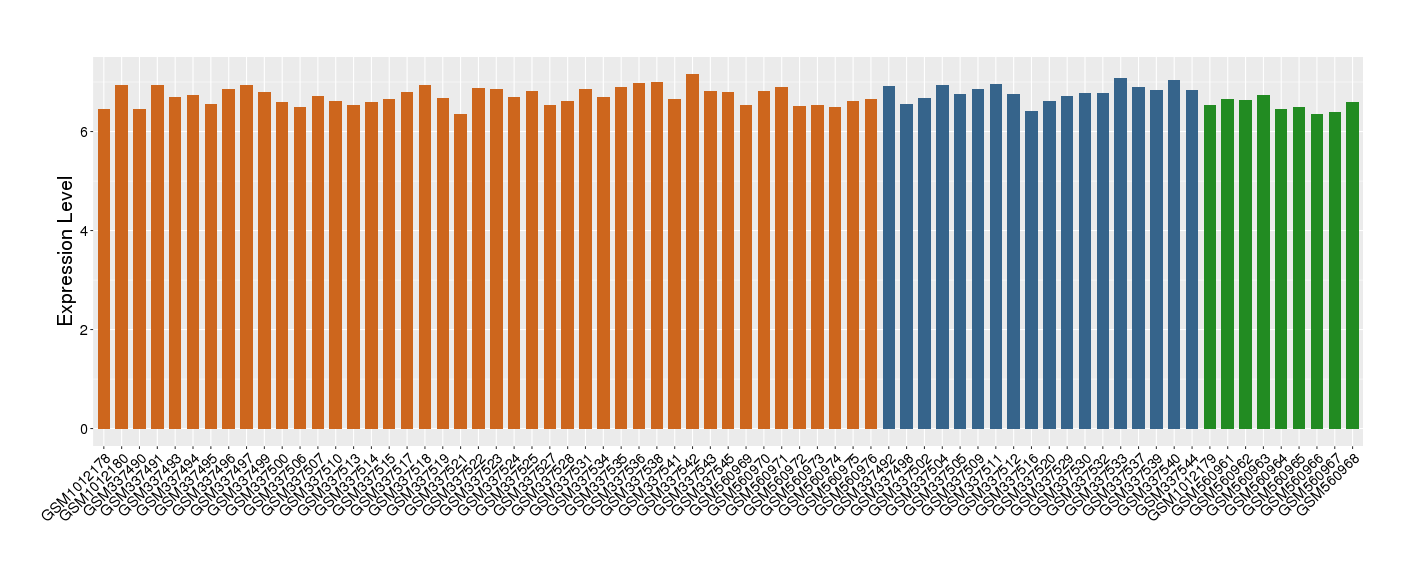
| Level of differential expression between the patients in the disease section of the tissue and the tissues of healthy individual |
Fold-change: -0.24 Z-score: -1.75 P-value: 1.21E-03 |
||||
|
Target gene expression profiles of the patients in the disease section of the tissue
Target gene expression profiles in the tissue of healthy individual

|
|||||
| Disease | Renal cancer | ||||
| Example drug | Temsirolimus | Approved | [3], [4], [5], [6] | ||
| Tissue | Kidney | ||||
| Level of differential expression between the patients in the disease section of the tissue and the tissues of healthy individual |
Fold-change: -0.44 Z-score: -2.3 P-value: 2.16E-05 |
||||
| Level of differential expression between the patients in the disease section of the tissue section of the tissue adjacent to the disease section |
Fold-change: -0.42 Z-score: -1.64 P-value: 4.45E-17 |
||||
|
Target gene expression profiles of the patients in the disease section of the tissue
Target gene expression profiles of the patients in the normal section of the tissue adjacent to the disease section
Target gene expression profiles in the tissue of healthy individual

|
|||||
| Disease | Sarcoma | ||||
| Example drug | Ridaforolimus | Phase 3 | [3], [4], [7], [8] | ||
| Tissue | Muscle tissue | ||||
| Level of differential expression between the patients in the disease section of the tissue and the tissues of healthy individual |
Fold-change: -0.33 Z-score: -1.42 P-value: 6.68E-99 |
||||
| Level of differential expression between the patients in the disease section of the tissue section of the tissue adjacent to the disease section |
Fold-change: -0.45 Z-score: -4.28 P-value: 2.49E-03 |
||||
|
Target gene expression profiles of the patients in the disease section of the tissue
Target gene expression profiles of the patients in the normal section of the tissue adjacent to the disease section
Target gene expression profiles in the tissue of healthy individual

|
|||||
| Disease | Uterine cancer | ||||
| Example drug | PF-04691502 | Phase 2 | [3], [4], [9], [10] | ||
| Tissue | Endometrium tissue | ||||
| Level of differential expression between the patients in the disease section of the tissue and the tissues of healthy individual |
Fold-change: 0.12 Z-score: 0.55 P-value: 1.14E-06 |
||||
| Level of differential expression between the patients in the disease section of the tissue section of the tissue adjacent to the disease section |
Fold-change: -0.22 Z-score: -1.63 P-value: 8.91E-02 |
||||
|
Target gene expression profiles of the patients in the disease section of the tissue
Target gene expression profiles of the patients in the normal section of the tissue adjacent to the disease section
Target gene expression profiles in the tissue of healthy individual

|
|||||
| Disease | Ulcerative colitis | ||||
| Tissue | Colon mucosal tissue | ||||
| Level of differential expression between the patients in the disease section of the tissue section of the tissue adjacent to the disease section |
Fold-change: -0.12 Z-score: -0.68 P-value: 1.07E-01 |
||||
|
Target gene expression profiles of the patients in the disease section of the tissue
Target gene expression profiles in the tissue of healthy individual
|
|||||
| Disease | Bladder cancer | ||||
| Tissue | Bladder tissue | ||||
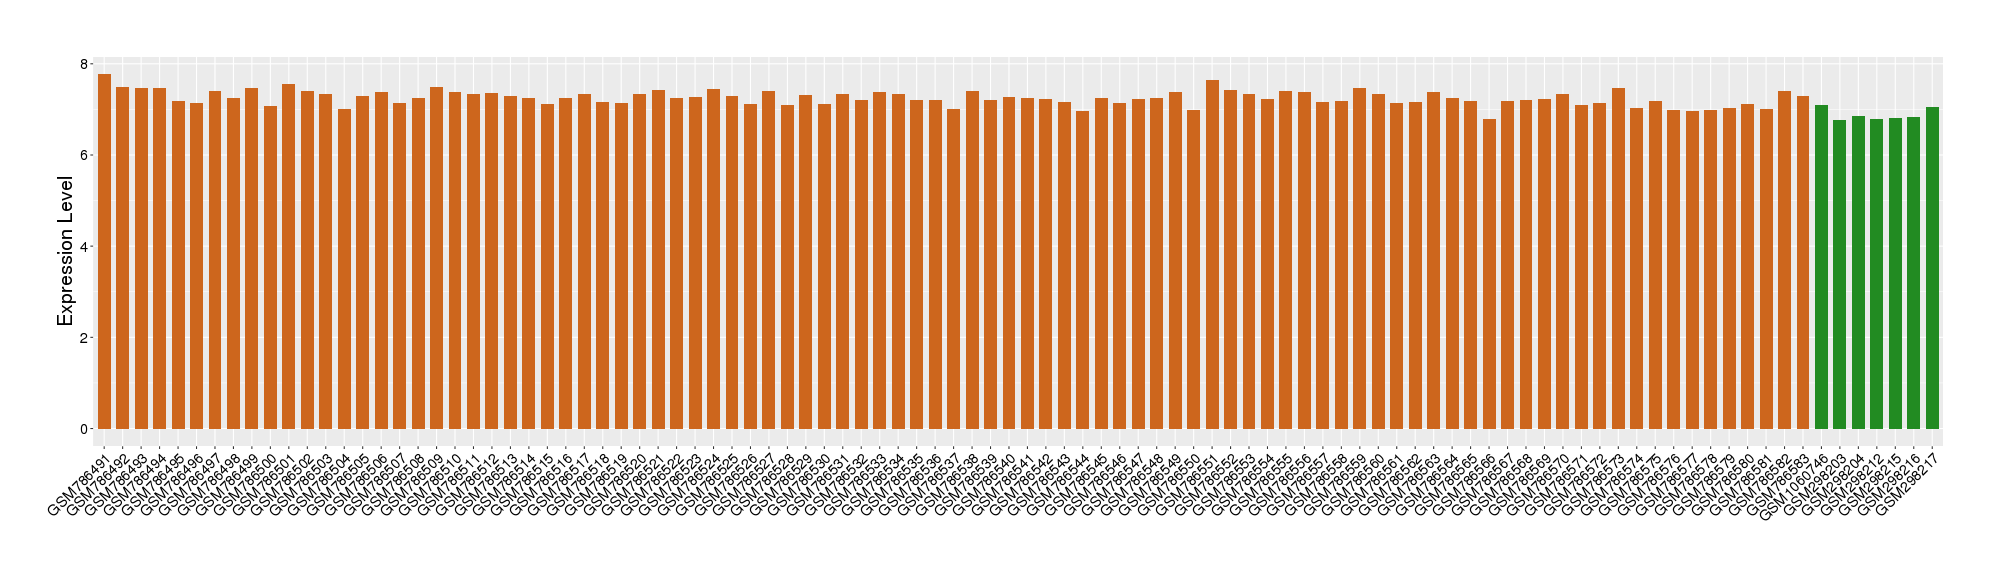
| Level of differential expression between the patients in the disease section of the tissue and the tissues of healthy individual |
Fold-change: 0.42 Z-score: 3.19 P-value: 1.72E-04 |
||||
|
Target gene expression profiles of the patients in the disease section of the tissue
Target gene expression profiles in the tissue of healthy individual
|
|||||
| Target's Expression Profile across Various Tissues of Healthy Individual | |||||
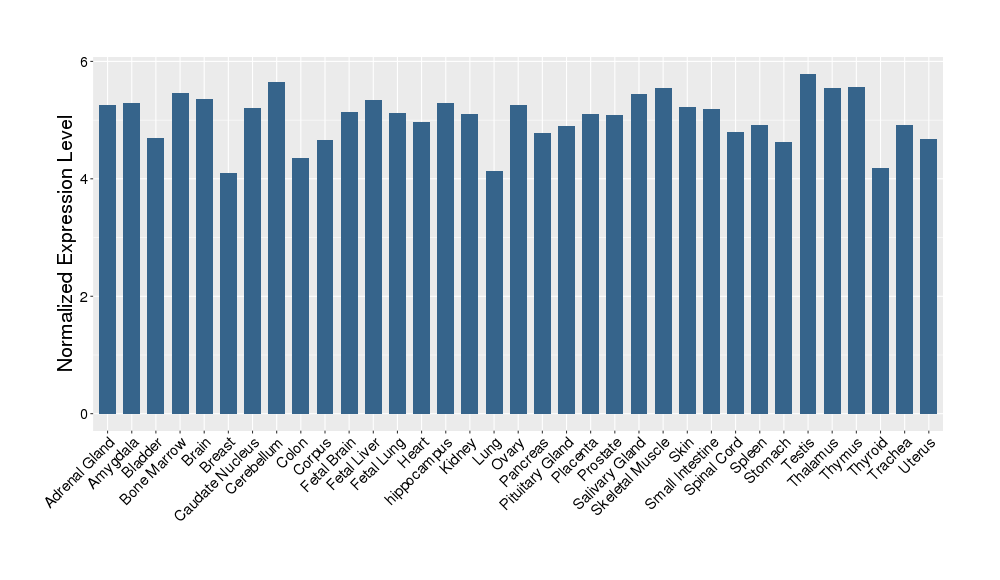
|
|||||
| References | |||||
| REF 1 | Drugs@FDA. U.S. Food and Drug Administration. U.S. Department of Health & Human Services. 2015 | ||||
| REF 2 | Trusted, scientifically sound profiles of drug programs, clinical trials, safety reports, and company deals, written by scientists. Springer. 2015. Adis Insight (drug id 800002452) | ||||
| REF 3 | Interpreting expression profiles of cancers by genome-wide survey of breadth of expression in normal tissues. Genomics 2005 Aug;86(2):127-41. | ||||
| REF 4 | NCBI GEO: archive for functional genomics data sets--update. Nucleic Acids Res. 2013 Jan;41(Database issue):D991-5. | ||||
| REF 5 | URL: http://www.guidetopharmacology.org Nucleic Acids Res. 2015 Oct 12. pii: gkv1037. The IUPHAR/BPS Guide to PHARMACOLOGY in 2016: towards curated quantitative interactions between 1300 protein targets and 6000 ligands. (Ligand id: 5892). | ||||
| REF 6 | Advances in kinase targeting: current clinical use and clinical trials. Trends Pharmacol Sci. 2014 Nov;35(11):604-20. | ||||
| REF 7 | URL: http://www.guidetopharmacology.org Nucleic Acids Res. 2015 Oct 12. pii: gkv1037. The IUPHAR/BPS Guide to PHARMACOLOGY in 2016: towards curated quantitative interactions between 1300 protein targets and 6000 ligands. (Ligand id: 7884). | ||||
| REF 8 | Phase II study of the mammalian target of rapamycin inhibitor ridaforolimus in patients with advanced bone and soft tissue sarcomas. J Clin Oncol. 2012 Jan 1;30(1):78-84. | ||||
| REF 9 | URL: http://www.guidetopharmacology.org Nucleic Acids Res. 2015 Oct 12. pii: gkv1037. The IUPHAR/BPS Guide to PHARMACOLOGY in 2016: towards curated quantitative interactions between 1300 protein targets and 6000 ligands. (Ligand id: 7936). | ||||
| REF 10 | ClinicalTrials.gov (NCT01430585) Pre-Operative Study of PF-4691502 With Letrozole Compared To Letrozole Alone In Patients With Early Breast Cancer. U.S. National Institutes of Health. | ||||
If You Find Any Error in Data or Bug in Web Service, Please Kindly Report It to Dr. Zhou and Dr. Zhang.