

Target expression details
| Target's General Information | |||||
|---|---|---|---|---|---|
| Target ID | T80975 | ||||
| Target Name | Vascular endothelial growth factor receptor 2 (KDR) | ||||
| Synonyms | VEGFR2; VEGFR-2; VEGF-2 receptor; Protein-tyrosine kinase receptor flk-1; Kinase insert domain receptor; Fetal liver kinase 1; FLK1; FLK-1; CD309 | ||||
| Target Type | Successful | ||||
| Gene Name | KDR | ||||
| Biochemical Class | Kinase | ||||
| UniProt ID | VGFR2_HUMAN | ||||
| Target's Expression Profile in Disease Related Tissue between Patients and Normal People | |||||
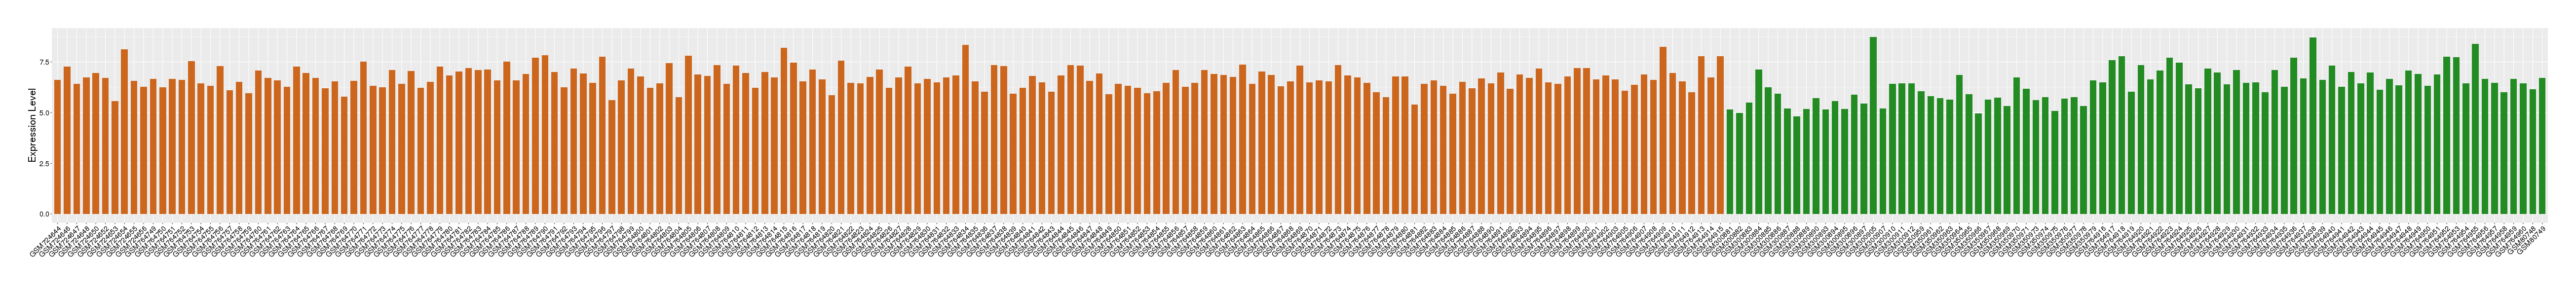
| Disease | Breast cancer | ||||
| Example drug | Apatinib | Approved | [1], [2], [3], [4], [5] | ||
| Tissue | Breast tissue | ||||
| Level of differential expression between the patients in the disease section of the tissue and the tissues of healthy individual |
Fold-change: -0.71 Z-score: -0.79 P-value: 6.54E-27 |
||||
| Level of differential expression between the patients in the disease section of the tissue section of the tissue adjacent to the disease section |
Fold-change: -0.86 Z-score: -1.16 P-value: 1.85E-09 |
||||
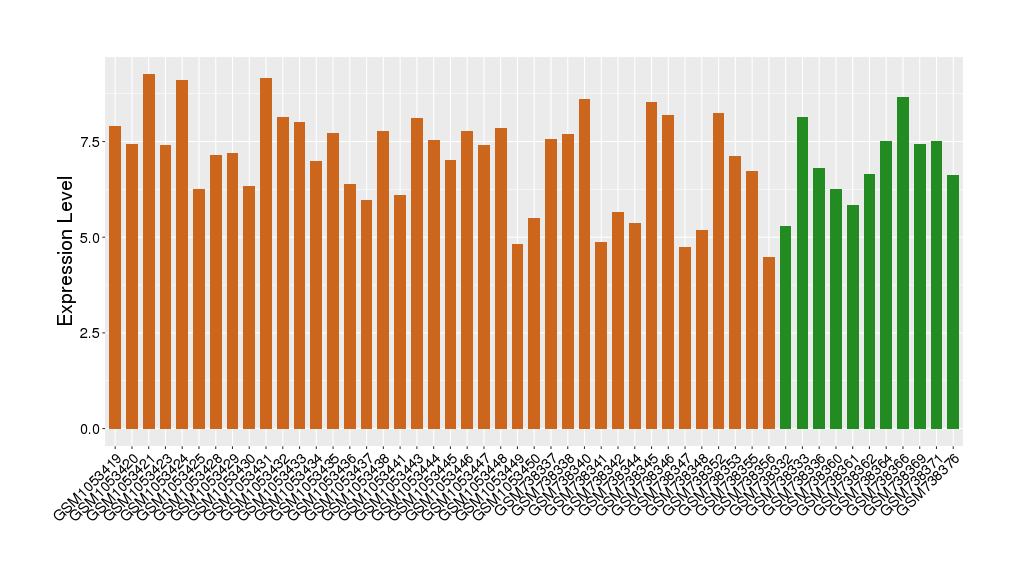
|
Target gene expression profiles of the patients in the disease section of the tissue
Target gene expression profiles of the patients in the normal section of the tissue adjacent to the disease section
Target gene expression profiles in the tissue of healthy individual

|
|||||
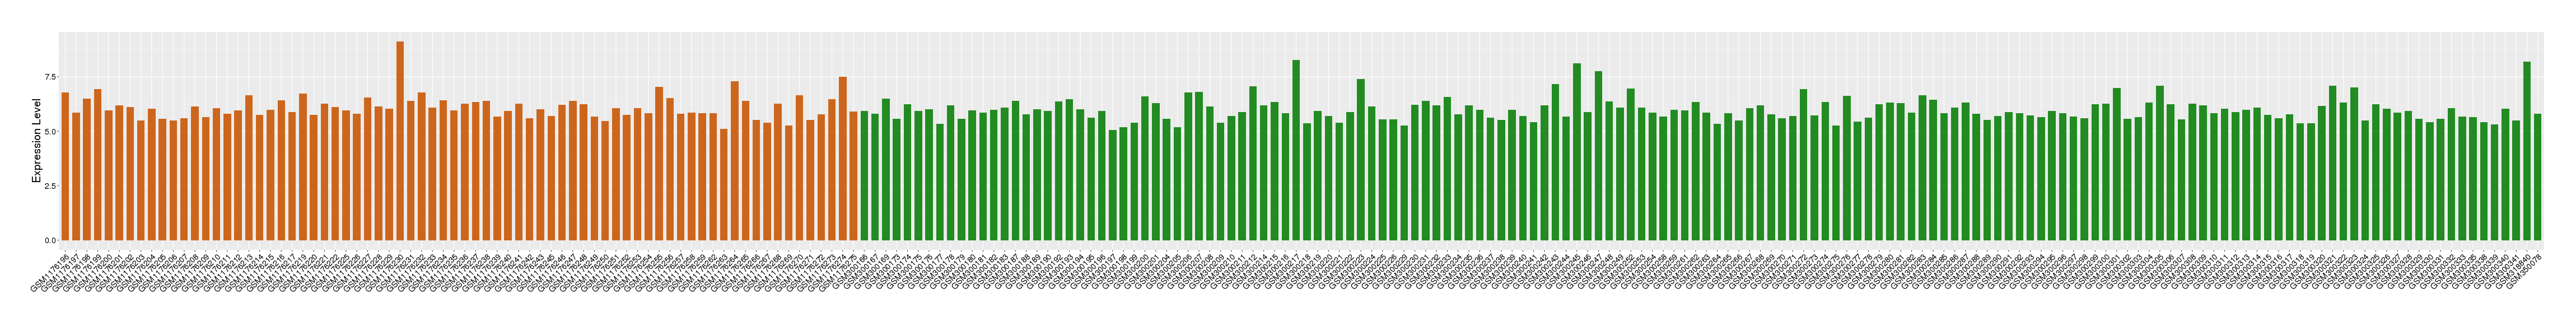
| Disease | Gastric cancer | ||||
| Example drug | Ramucirumab | Approved | [6], [7], [4], [5] | ||
| Tissue | Gastric tissue | ||||
| Level of differential expression between the patients in the disease section of the tissue and the tissues of healthy individual |
Fold-change: -0.21 Z-score: -1 P-value: 4.05E-01 |
||||
| Level of differential expression between the patients in the disease section of the tissue section of the tissue adjacent to the disease section |
Fold-change: 0.48 Z-score: 1 P-value: 8.20E-04 |
||||
|
Target gene expression profiles of the patients in the disease section of the tissue
Target gene expression profiles of the patients in the normal section of the tissue adjacent to the disease section
Target gene expression profiles in the tissue of healthy individual

|
|||||
| Disease | Renal cancer | ||||
| Example drug | Pazopanib HCl | Approved | [8], [4], [5] | ||
| Tissue | Kidney | ||||
| Level of differential expression between the patients in the disease section of the tissue and the tissues of healthy individual |
Fold-change: 0.18 Z-score: 0.27 P-value: 7.90E-01 |
||||
| Level of differential expression between the patients in the disease section of the tissue section of the tissue adjacent to the disease section |
Fold-change: 0.43 Z-score: 0.61 P-value: 2.12E-02 |
||||
|
Target gene expression profiles of the patients in the disease section of the tissue
Target gene expression profiles of the patients in the normal section of the tissue adjacent to the disease section
Target gene expression profiles in the tissue of healthy individual

|
|||||
| Disease | Thyroid cancer | ||||
| Example drug | Cabozantinib | Approved | [9], [10], [4], [5] | ||
| Tissue | Thyroid | ||||
| Level of differential expression between the patients in the disease section of the tissue and the tissues of healthy individual |
Fold-change: 0.44 Z-score: 0.82 P-value: 1.50E-03 |
||||
| Level of differential expression between the patients in the disease section of the tissue section of the tissue adjacent to the disease section |
Fold-change: -0.63 Z-score: -1.22 P-value: 8.77E-10 |
||||
|
Target gene expression profiles of the patients in the disease section of the tissue
Target gene expression profiles of the patients in the normal section of the tissue adjacent to the disease section
Target gene expression profiles in the tissue of healthy individual

|
|||||
| Disease | Liver cancer | ||||
| Example drug | Brivanib | Phase 3 | [11], [12], [4], [5] | ||
| Tissue | Liver tissue | ||||
| Level of differential expression between the patients in the disease section of the tissue and the tissues of healthy individual |
Fold-change: -0.77 Z-score: -1.4 P-value: 2.93E-13 |
||||
| Level of differential expression between the patients in the disease section of the tissue section of the tissue adjacent to the disease section |
Fold-change: -0.35 Z-score: -0.55 P-value: 5.34E-10 |
||||
|
Target gene expression profiles of the patients in the disease section of the tissue
Target gene expression profiles of the patients in the normal section of the tissue adjacent to the disease section
Target gene expression profiles in the tissue of healthy individual

|
|||||
| Disease | Melanoma | ||||
| Example drug | Sorafenib | Phase 3 | [13], [14], [4], [5] | ||
| Tissue | Skin | ||||
| Level of differential expression between the patients in the disease section of the tissue and the tissues of healthy individual |
Fold-change: 0.2 Z-score: 0.15 P-value: 1.84E-01 |
||||
|
Target gene expression profiles of the patients in the disease section of the tissue
Target gene expression profiles in the tissue of healthy individual

|
|||||
| Disease | Ovarian cancer | ||||
| Example drug | Cediranib | Phase 3 | [15], [16], [4], [5] | ||
| Tissue | Ovarian tissue | ||||
| Level of differential expression between the patients in the disease section of the tissue and the tissues of healthy individual |
Fold-change: -0.29 Z-score: -0.43 P-value: 1.18E-01 |
||||
| Level of differential expression between the patients in the disease section of the tissue section of the tissue adjacent to the disease section |
Fold-change: 0.16 Z-score: 0.06 P-value: 7.57E-02 |
||||
|
Target gene expression profiles of the patients in the disease section of the tissue
Target gene expression profiles of the patients in the normal section of the tissue adjacent to the disease section
Target gene expression profiles in the tissue of healthy individual

|
|||||
| Disease | Acute myelocytic leukemia | ||||
| Example drug | Sorafenib | Phase 2 | [13], [14], [4], [5] | ||
| Tissue | Bone marrow | ||||
| Level of differential expression between the patients in the disease section of the tissue and the tissues of healthy individual |
Fold-change: 0.03 Z-score: 0.14 P-value: 2.27E-01 |
||||
|
Target gene expression profiles of the patients in the disease section of the tissue
Target gene expression profiles in the tissue of healthy individual

|
|||||
| Disease | Head and neck cancer | ||||
| Example drug | Sorafenib | Phase 2 | [13], [14], [4], [5] | ||
| Tissue | Head and neck tissue | ||||
| Level of differential expression between the patients in the disease section of the tissue and the tissues of healthy individual |
Fold-change: 0.26 Z-score: 0.31 P-value: 7.27E-04 |
||||
|
Target gene expression profiles of the patients in the disease section of the tissue
Target gene expression profiles in the tissue of healthy individual
|
|||||
| Disease | Lung cancer | ||||
| Example drug | CP-547632 | Phase 2 | [17], [18], [4], [5] | ||
| Tissue | Lung tissue | ||||
| Level of differential expression between the patients in the disease section of the tissue and the tissues of healthy individual |
Fold-change: -1.61 Z-score: -2.54 P-value: 2.37E-83 |
||||
| Level of differential expression between the patients in the disease section of the tissue section of the tissue adjacent to the disease section |
Fold-change: -1.73 Z-score: -2.55 P-value: 9.72E-52 |
||||
|
Target gene expression profiles of the patients in the disease section of the tissue
Target gene expression profiles of the patients in the normal section of the tissue adjacent to the disease section
Target gene expression profiles in the tissue of healthy individual

|
|||||
| Disease | Myelodysplastic syndromes | ||||
| Example drug | Sorafenib | Phase 2 | [13], [14], [4], [5] | ||
| Tissue | Bone marrow | ||||
| Level of differential expression between the patients in the disease section of the tissue and the tissues of healthy individual |
Fold-change: 0.11 Z-score: 0.37 P-value: 7.93E-05 |
||||
| Level of differential expression between the patients in the disease section of the tissue section of the tissue adjacent to the disease section |
Fold-change: 0.26 Z-score: 4.99 P-value: 1.23E-12 |
||||
|
Target gene expression profiles of the patients in the disease section of the tissue
Target gene expression profiles of the patients in the normal section of the tissue adjacent to the disease section
Target gene expression profiles in the tissue of healthy individual

|
|||||
| Disease | Alzheimer's disease | ||||
| Example drug | MK-2461 | Phase 1/2 | [19], [4], [5] | ||
| Tissue | Entorhinal cortex | ||||
| Level of differential expression between the patients in the disease section of the tissue and the tissues of healthy individual |
Fold-change: 0.11 Z-score: 0.2 P-value: 1.98E-01 |
||||
|
Target gene expression profiles of the patients in the disease section of the tissue
Target gene expression profiles in the tissue of healthy individual
|
|||||
| Disease | Rectal cancer | ||||
| Example drug | OTSGC-A24 | Phase 1/2 | [20], [4], [5] | ||
| Tissue | Rectal colon tissue | ||||
| Level of differential expression between the patients in the disease section of the tissue and the tissues of healthy individual |
Fold-change: 0.49 Z-score: 1.48 P-value: 2.74E-02 |
||||
| Level of differential expression between the patients in the disease section of the tissue section of the tissue adjacent to the disease section |
Fold-change: 1.39 Z-score: 3.6 P-value: 1.67E-04 |
||||
|
Target gene expression profiles of the patients in the disease section of the tissue
Target gene expression profiles of the patients in the normal section of the tissue adjacent to the disease section
Target gene expression profiles in the tissue of healthy individual
|
|||||
| Disease | Glioma | ||||
| Example drug | KRN633 | Phase 1 | [21], [22], [4], [5] | ||
| Tissue | Brainstem tissue | ||||
| Level of differential expression between the patients in the disease section of the tissue and the tissues of healthy individual |
Fold-change: 0.05 Z-score: 0.19 P-value: 6.79E-01 |
||||
|
Target gene expression profiles of the patients in the disease section of the tissue
Target gene expression profiles in the tissue of healthy individual
|
|||||
| Disease | Glioma | ||||
| Example drug | KRN633 | Phase 1 | [21], [22], [4], [5] | ||
| Tissue | White matter | ||||
| Level of differential expression between the patients in the disease section of the tissue and the tissues of healthy individual |
Fold-change: 0.61 Z-score: 0.61 P-value: 7.67E-01 |
||||
|
Target gene expression profiles of the patients in the disease section of the tissue
Target gene expression profiles in the tissue of healthy individual
|
|||||
| Disease | Psoriasis | ||||
| Tissue | Skin | ||||
| Level of differential expression between the patients in the disease section of the tissue and the tissues of healthy individual |
Fold-change: -0.33 Z-score: -0.66 P-value: 8.32E-09 |
||||
| Level of differential expression between the patients in the disease section of the tissue section of the tissue adjacent to the disease section |
Fold-change: -0.35 Z-score: -0.88 P-value: 2.43E-12 |
||||
|
Target gene expression profiles of the patients in the disease section of the tissue
Target gene expression profiles of the patients in the normal section of the tissue adjacent to the disease section
Target gene expression profiles in the tissue of healthy individual

|
|||||
| Disease | Retinoblastoma tumor | ||||
| Tissue | Uvea | ||||
| Level of differential expression between the patients in the disease section of the tissue and the tissues of healthy individual |
Fold-change: -4.77 Z-score: -8.72 P-value: 4.37E-09 |
||||
|
Target gene expression profiles of the patients in the disease section of the tissue
Target gene expression profiles in the tissue of healthy individual

|
|||||
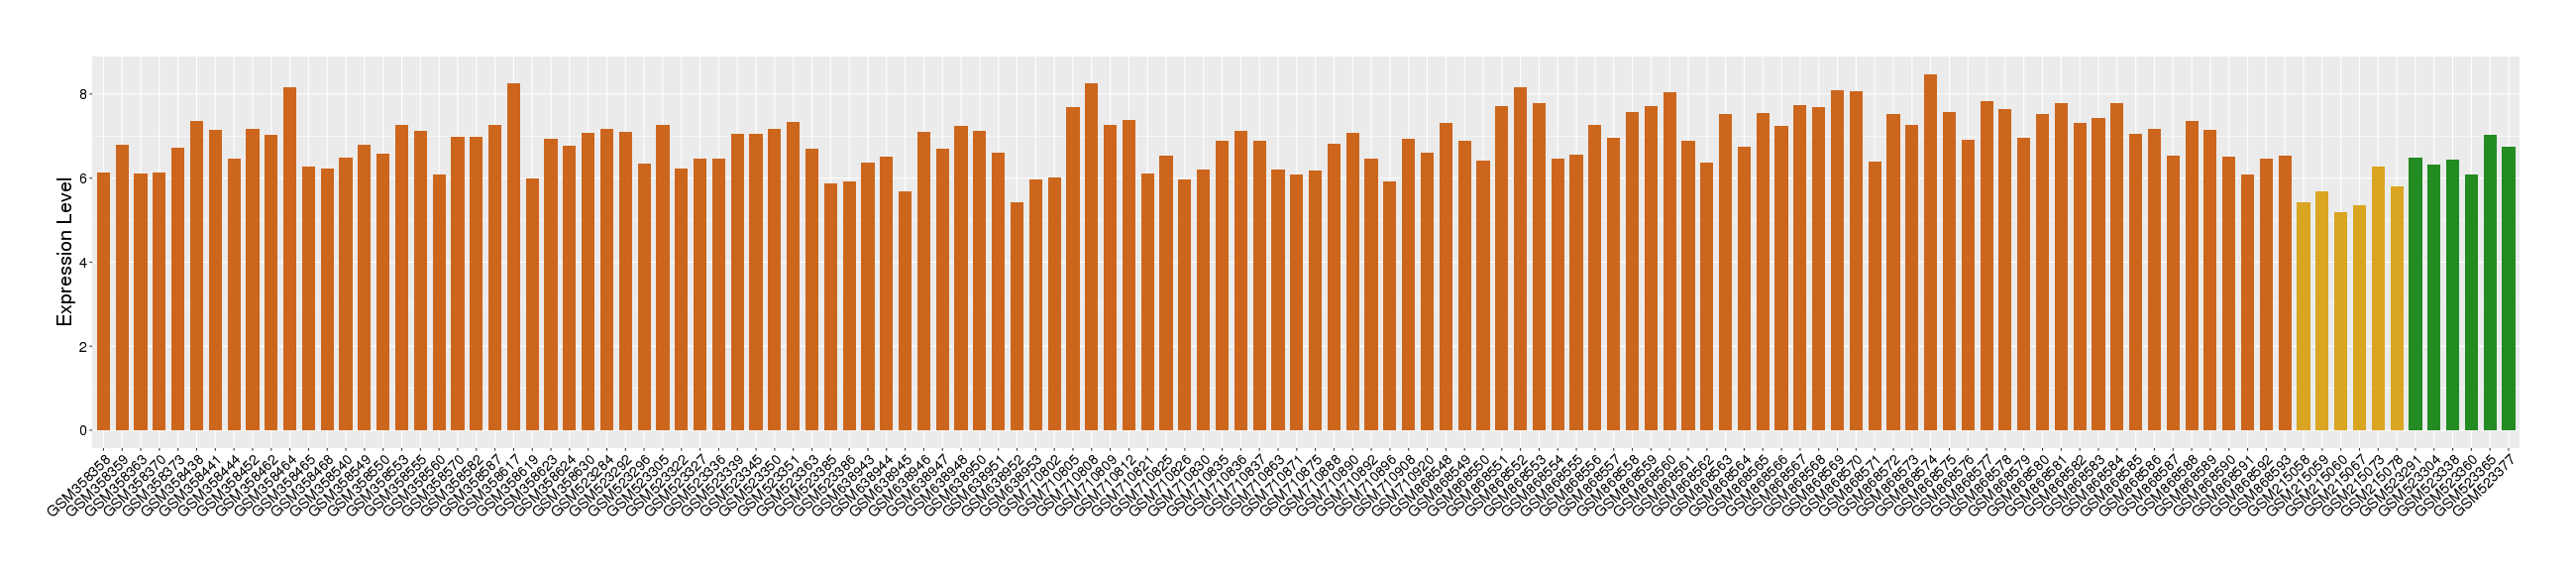
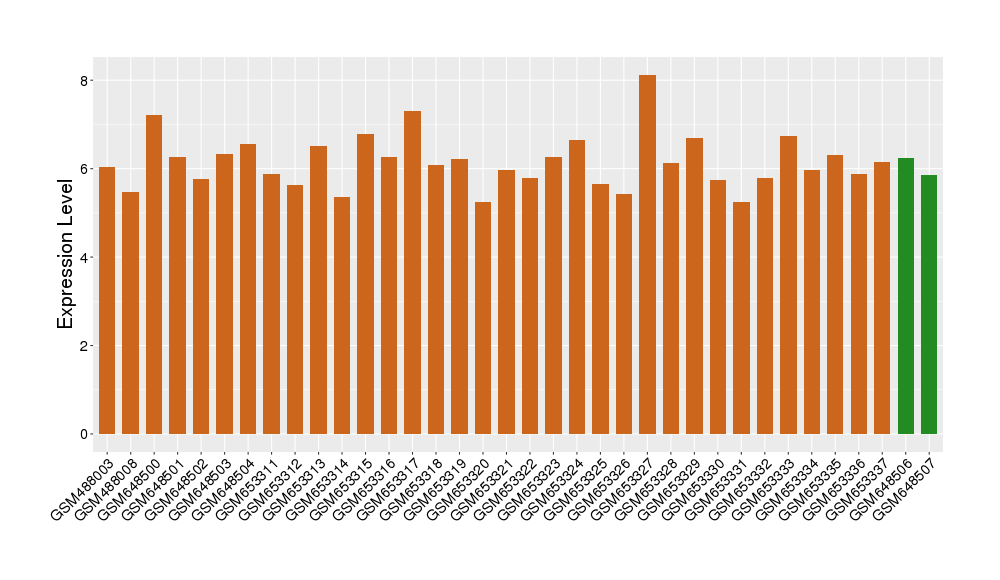
| Target's Expression Profile across Various Tissues of Healthy Individual | |||||
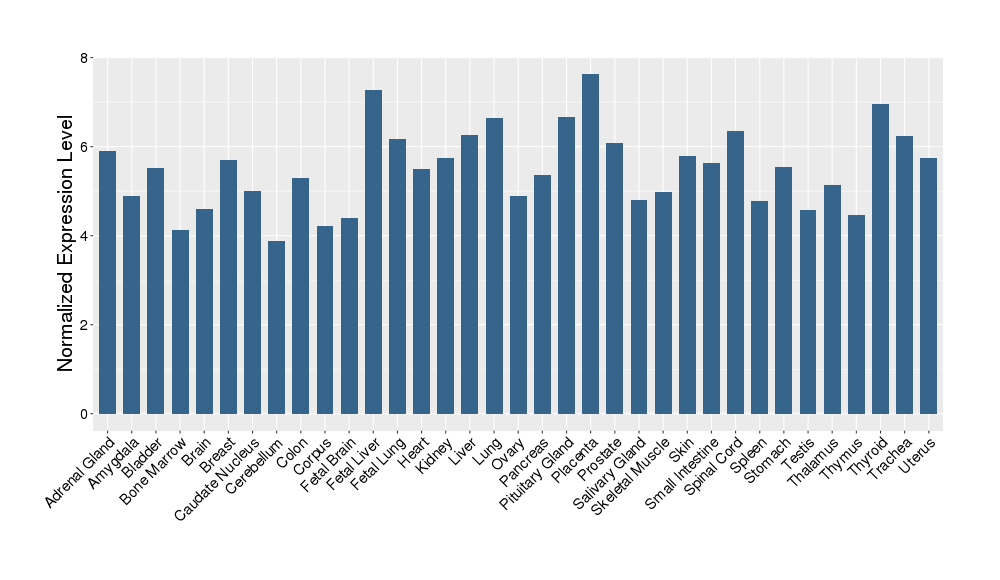
|
|||||
| References | |||||
| REF 1 | URL: http://www.guidetopharmacology.org Nucleic Acids Res. 2015 Oct 12. pii: gkv1037. The IUPHAR/BPS Guide to PHARMACOLOGY in 2016: towards curated quantitative interactions between 1300 protein targets and 6000 ligands. (Ligand id: 7648). | ||||
| REF 2 | Clinical pipeline report, company report or official report of LSK BioPharma. | ||||
| REF 3 | ClinicalTrials.gov (NCT02426034) Study of Apatinib Tablets in the Treatment of Advanced or Metastatic Gastric Cancer. U.S. National Institutes of Health. | ||||
| REF 4 | Interpreting expression profiles of cancers by genome-wide survey of breadth of expression in normal tissues. Genomics 2005 Aug;86(2):127-41. | ||||
| REF 5 | NCBI GEO: archive for functional genomics data sets--update. Nucleic Acids Res. 2013 Jan;41(Database issue):D991-5. | ||||
| REF 6 | URL: http://www.guidetopharmacology.org Nucleic Acids Res. 2015 Oct 12. pii: gkv1037. The IUPHAR/BPS Guide to PHARMACOLOGY in 2016: towards curated quantitative interactions between 1300 protein targets and 6000 ligands. (Ligand id: 7390). | ||||
| REF 7 | 2014 FDA drug approvals. Nat Rev Drug Discov. 2015 Feb;14(2):77-81. | ||||
| REF 8 | Hughes B: 2009 FDA drug approvals. Nat Rev Drug Discov. 2010 Feb;9(2):89-92. | ||||
| REF 9 | URL: http://www.guidetopharmacology.org Nucleic Acids Res. 2015 Oct 12. pii: gkv1037. The IUPHAR/BPS Guide to PHARMACOLOGY in 2016: towards curated quantitative interactions between 1300 protein targets and 6000 ligands. (Ligand id: 5887). | ||||
| REF 10 | Clinical pipeline report, company report or official report of Exelixis (2011). | ||||
| REF 11 | URL: http://www.guidetopharmacology.org Nucleic Acids Res. 2015 Oct 12. pii: gkv1037. The IUPHAR/BPS Guide to PHARMACOLOGY in 2016: towards curated quantitative interactions between 1300 protein targets and 6000 ligands. (Ligand id: 5671). | ||||
| REF 12 | ClinicalTrials.gov (NCT01108705) Comparison of Brivanib and Best Supportive Care (BSC) With Placebo and BSC for Treatment of Liver Cancer in Asian Patients Who Have Failed Sorafenib Treatment. U.S. National Institutes of Health. | ||||
| REF 13 | URL: http://www.guidetopharmacology.org Nucleic Acids Res. 2015 Oct 12. pii: gkv1037. The IUPHAR/BPS Guide to PHARMACOLOGY in 2016: towards curated quantitative interactions between 1300 protein targets and 6000 ligands. (Ligand id: 5711). | ||||
| REF 14 | Sorafenib (BAY 43-9006, Nexavar), a dual-action inhibitor that targets RAF/MEK/ERK pathway in tumor cells and tyrosine kinases VEGFR/PDGFR in tumor vasculature. Methods Enzymol. 2006;407:597-612. | ||||
| REF 15 | URL: http://www.guidetopharmacology.org Nucleic Acids Res. 2015 Oct 12. pii: gkv1037. The IUPHAR/BPS Guide to PHARMACOLOGY in 2016: towards curated quantitative interactions between 1300 protein targets and 6000 ligands. (Ligand id: 5664). | ||||
| REF 16 | ClinicalTrials.gov (NCT02446600) Olaparib or Cediranib Maleate and Olaparib Compared With Standard Platinum-Based Chemotherapy in Treating Patients With Recurrent Platinum-Sensitive Ovarian, Fallopian Tube, or Primary Peritoneal Cancer. U.S. National Institutes of Health. | ||||
| REF 17 | URL: http://www.guidetopharmacology.org Nucleic Acids Res. 2015 Oct 12. pii: gkv1037. The IUPHAR/BPS Guide to PHARMACOLOGY in 2016: towards curated quantitative interactions between 1300 protein targets and 6000 ligands. (Ligand id: 7881). | ||||
| REF 18 | ClinicalTrials.gov (NCT00096239) CP-547,632 in Treating Patients With Recurrent or Persistent Ovarian Cancer, Primary Peritoneal Cancer, or Fallopian Tube Cancer. U.S. National Institutes of Health. | ||||
| REF 19 | MK-2461, a novel multitargeted kinase inhibitor, preferentially inhibits the activated c-Met receptor. Cancer Res. 2010 Feb 15;70(4):1524-33. | ||||
| REF 20 | ClinicalTrials.gov (NCT01227772) Study of OTSGC-A24 Vaccine in Advanced Gastric Cancer. U.S. National Institutes of Health. | ||||
| REF 21 | URL: http://www.guidetopharmacology.org Nucleic Acids Res. 2015 Oct 12. pii: gkv1037. The IUPHAR/BPS Guide to PHARMACOLOGY in 2016: towards curated quantitative interactions between 1300 protein targets and 6000 ligands. (Ligand id: 6057). | ||||
| REF 22 | Trusted, scientifically sound profiles of drug programs, clinical trials, safety reports, and company deals, written by scientists. Springer. 2015. Adis Insight (drug id 800017407) | ||||
If You Find Any Error in Data or Bug in Web Service, Please Kindly Report It to Dr. Zhou and Dr. Zhang.