
Target Information
| Target General Information | Top | |||||
|---|---|---|---|---|---|---|
| Target ID |
T25703
(Former ID: TTDC00134)
|
|||||
| Target Name |
Heme oxygenase 1 (HMOX1)
|
|||||
| Synonyms |
HO1; HO-1; HO
Click to Show/Hide
|
|||||
| Gene Name |
HMOX1
|
|||||
| Target Type |
Clinical trial target
|
[1] | ||||
| Disease | [+] 1 Target-related Diseases | + | ||||
| 1 | Neonatal hyperbilirubinaemia [ICD-11: KA87] | |||||
| Function |
Heme oxygenase cleaves the heme ring at the alpha methene bridge to form biliverdin. Biliverdin is subsequently converted to bilirubin by biliverdin reductase. Under physiological conditions, the activity of heme oxygenase is highest in the spleen, where senescent erythrocytes are sequestrated and destroyed. Exhibits cytoprotective effects since excess of free heme sensitizes cells to undergo apoptosis.
Click to Show/Hide
|
|||||
| BioChemical Class |
Paired donor oxygen oxidoreductase
|
|||||
| UniProt ID | ||||||
| EC Number |
EC 1.14.14.18
|
|||||
| Sequence |
MERPQPDSMPQDLSEALKEATKEVHTQAENAEFMRNFQKGQVTRDGFKLVMASLYHIYVA
LEEEIERNKESPVFAPVYFPEELHRKAALEQDLAFWYGPRWQEVIPYTPAMQRYVKRLHE VGRTEPELLVAHAYTRYLGDLSGGQVLKKIAQKALDLPSSGEGLAFFTFPNIASATKFKQ LYRSRMNSLEMTPAVRQRVIEEAKTAFLLNIQLFEELQELLTHDTKDQSPSRAPGLRQRA SNKVQDSAPVETPRGKPPLNTRSQAPLLRWVLTLSFLVATVAVGLYAM Click to Show/Hide
|
|||||
| 3D Structure | Click to Show 3D Structure of This Target | PDB | ||||
| ADReCS ID | BADD_A02356 | |||||
| HIT2.0 ID | T86ROZ | |||||
| Drugs and Modes of Action | Top | |||||
|---|---|---|---|---|---|---|
| Clinical Trial Drug(s) | [+] 1 Clinical Trial Drugs | + | ||||
| 1 | Stannsoporfin | Drug Info | Phase 2 | Neonatal hyperbilirubinemia | [2] | |
| Mode of Action | [+] 1 Modes of Action | + | ||||
| Inhibitor | [+] 10 Inhibitor drugs | + | ||||
| 1 | Stannsoporfin | Drug Info | [1] | |||
| 2 | 1-(adamantan-1-yl)-2-(1H-imidazol-1-yl)ethanone | Drug Info | [3] | |||
| 3 | 12-Phenylheme | Drug Info | [4] | |||
| 4 | 2-Phenylheme | Drug Info | [4] | |||
| 5 | 2-Propanol, Isopropanol | Drug Info | [4] | |||
| 6 | Biliverdine Ix Alpha | Drug Info | [4] | |||
| 7 | Formic Acid | Drug Info | [4] | |||
| 8 | Heme | Drug Info | [3] | |||
| 9 | Tin protoporphyrin | Drug Info | [5] | |||
| 10 | Verdoheme | Drug Info | [6] | |||
| Cell-based Target Expression Variations | Top | |||||
|---|---|---|---|---|---|---|
| Cell-based Target Expression Variations | ||||||
| Drug Binding Sites of Target | Top | |||||
|---|---|---|---|---|---|---|
| Ligand Name: Nitric oxide | Ligand Info | |||||
| Structure Description | Crystal Structures of the Ferric, Ferrous and Ferrous-NO Forms of the Asp140Ala Mutant of Human Heme Oxygenase-1: Catalytic Implications | PDB:1OZW | ||||
| Method | X-ray diffraction | Resolution | 1.55 Å | Mutation | No | [7] |
| PDB Sequence |
PQDLSEALKE
19 ATKEVHTQAE29 NAEFMRNFQK39 GQVTRDGFKL49 VMASLYHIYV59 ALEEEIERNK 69 ESPVFAPVYF79 PEELHRKAAL89 EQDLAFWYGP99 RWQEVIPYTP109 AMQRYVKRLH 119 EVGRTEPELL129 VAHAYTRYLG139 DLSGGQVLKK149 IAQKALDLPS159 SGEGLAFFTF 169 PNIASATKFK179 QLYRSRMNSL189 EMTPAVRQRV199 IEEAKTAFLL209 NIQLFEELQE 219 LLTH
|
|||||
|
|
||||||
| Click to View More Binding Site Information of This Target and Ligand Pair | ||||||
| Ligand Name: Biliverdine Ix Alpha | Ligand Info | |||||
| Structure Description | Crystal structure of human heme oxygenase 1 H25R with biliverdin bound | PDB:5BTQ | ||||
| Method | X-ray diffraction | Resolution | 2.08 Å | Mutation | Yes | [8] |
| PDB Sequence |
QDLSEALKEA
20 TKEVRTQAEN30 AEFMRNFQKG40 QVTRDGFKLV50 MASLYHIYVA60 LEEEIERNKE 70 SPVFAPVYFP80 EELHRKAALE90 QDLAFWYGPR100 WQEVIPYTPA110 MQRYVKRLHE 120 VGRTEPELLV130 AHAYTRYLGD140 LSGGQVLKKI150 AQKALDLPSS160 GEGLAFFTFP 170 NIASATKFKQ180 LYRSRMNSLE190 MTPAVRQRVI200 EEAKTAFLLN210 IQLFEELQEL 220 LTH
|
|||||
|
|
SER14
4.372
LYS18
3.839
ARG25
3.171
ALA28
3.516
GLU29
3.448
MET34
3.684
GLN38
3.911
TYR134
2.900
THR135
3.763
ARG136
4.512
LEU138
3.982
|
|||||
| Click to View More Binding Site Information of This Target and Ligand Pair | ||||||
| Click to View More Binding Site Information of This Target with Different Ligands | ||||||
| Different Human System Profiles of Target | Top |
|---|---|
|
Human Similarity Proteins
of target is determined by comparing the sequence similarity of all human proteins with the target based on BLAST. The similarity proteins for a target are defined as the proteins with E-value < 0.005 and outside the protein families of the target.
A target that has fewer human similarity proteins outside its family is commonly regarded to possess a greater capacity to avoid undesired interactions and thus increase the possibility of finding successful drugs
(Brief Bioinform, 21: 649-662, 2020).
Human Tissue Distribution
of target is determined from a proteomics study that quantified more than 12,000 genes across 32 normal human tissues. Tissue Specificity (TS) score was used to define the enrichment of target across tissues.
The distribution of targets among different tissues or organs need to be taken into consideration when assessing the target druggability, as it is generally accepted that the wider the target distribution, the greater the concern over potential adverse effects
(Nat Rev Drug Discov, 20: 64-81, 2021).
Human Pathway Affiliation
of target is determined by the life-essential pathways provided on KEGG database. The target-affiliated pathways were defined based on the following two criteria (a) the pathways of the studied target should be life-essential for both healthy individuals and patients, and (b) the studied target should occupy an upstream position in the pathways and therefore had the ability to regulate biological function.
Targets involved in a fewer pathways have greater likelihood to be successfully developed, while those associated with more human pathways increase the chance of undesirable interferences with other human processes
(Pharmacol Rev, 58: 259-279, 2006).
Biological Network Descriptors
of target is determined based on a human protein-protein interactions (PPI) network consisting of 9,309 proteins and 52,713 PPIs, which were with a high confidence score of ≥ 0.95 collected from STRING database.
The network properties of targets based on protein-protein interactions (PPIs) have been widely adopted for the assessment of target’s druggability. Proteins with high node degree tend to have a high impact on network function through multiple interactions, while proteins with high betweenness centrality are regarded to be central for communication in interaction networks and regulate the flow of signaling information
(Front Pharmacol, 9, 1245, 2018;
Curr Opin Struct Biol. 44:134-142, 2017).
Human Similarity Proteins
Human Tissue Distribution
Human Pathway Affiliation
Biological Network Descriptors
|
|
|
There is no similarity protein (E value < 0.005) for this target
|
|
Note:
If a protein has TS (tissue specficity) scores at least in one tissue >= 2.5, this protein is called tissue-enriched (including tissue-enriched-but-not-specific and tissue-specific). In the plots, the vertical lines are at thresholds 2.5 and 4.
|
| KEGG Pathway | Pathway ID | Affiliated Target | Pathway Map |
|---|---|---|---|
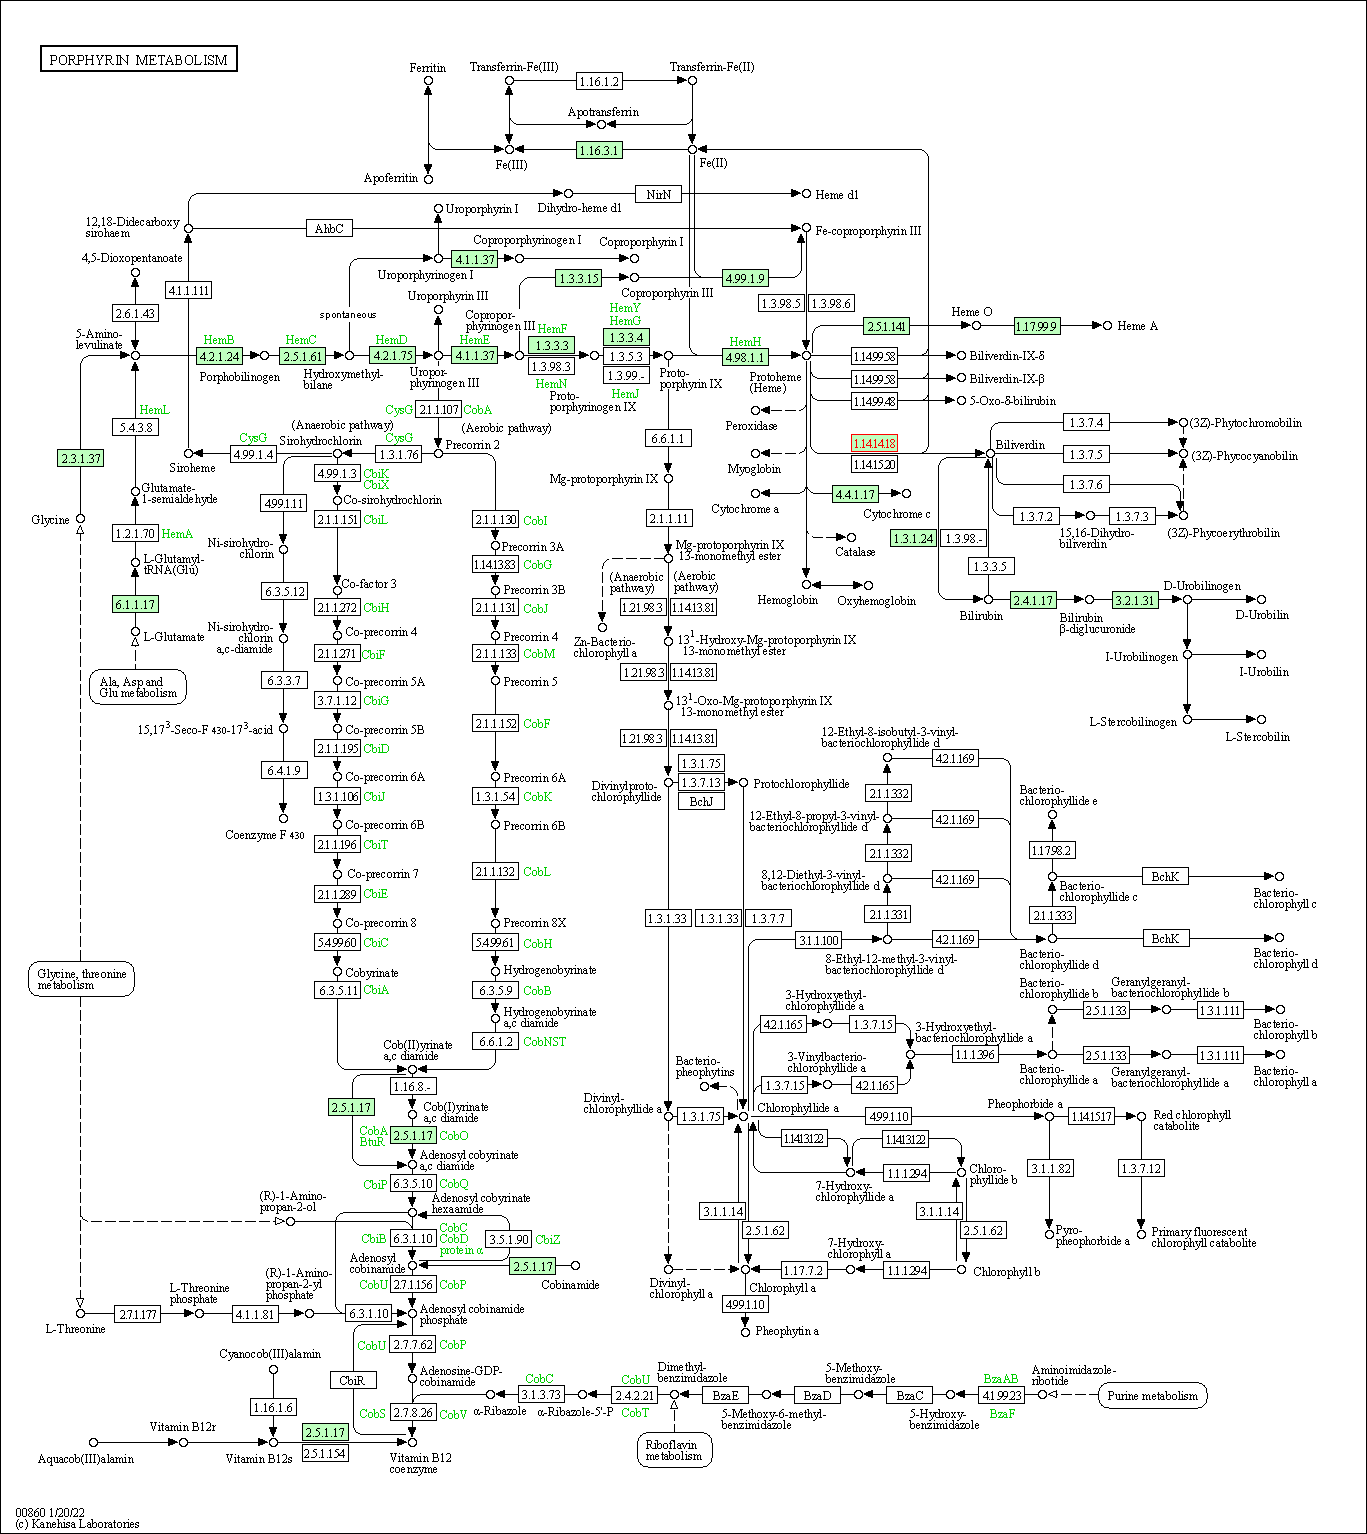
| Porphyrin metabolism | hsa00860 | Affiliated Target |
|
| Class: Metabolism => Metabolism of cofactors and vitamins | Pathway Hierarchy | ||
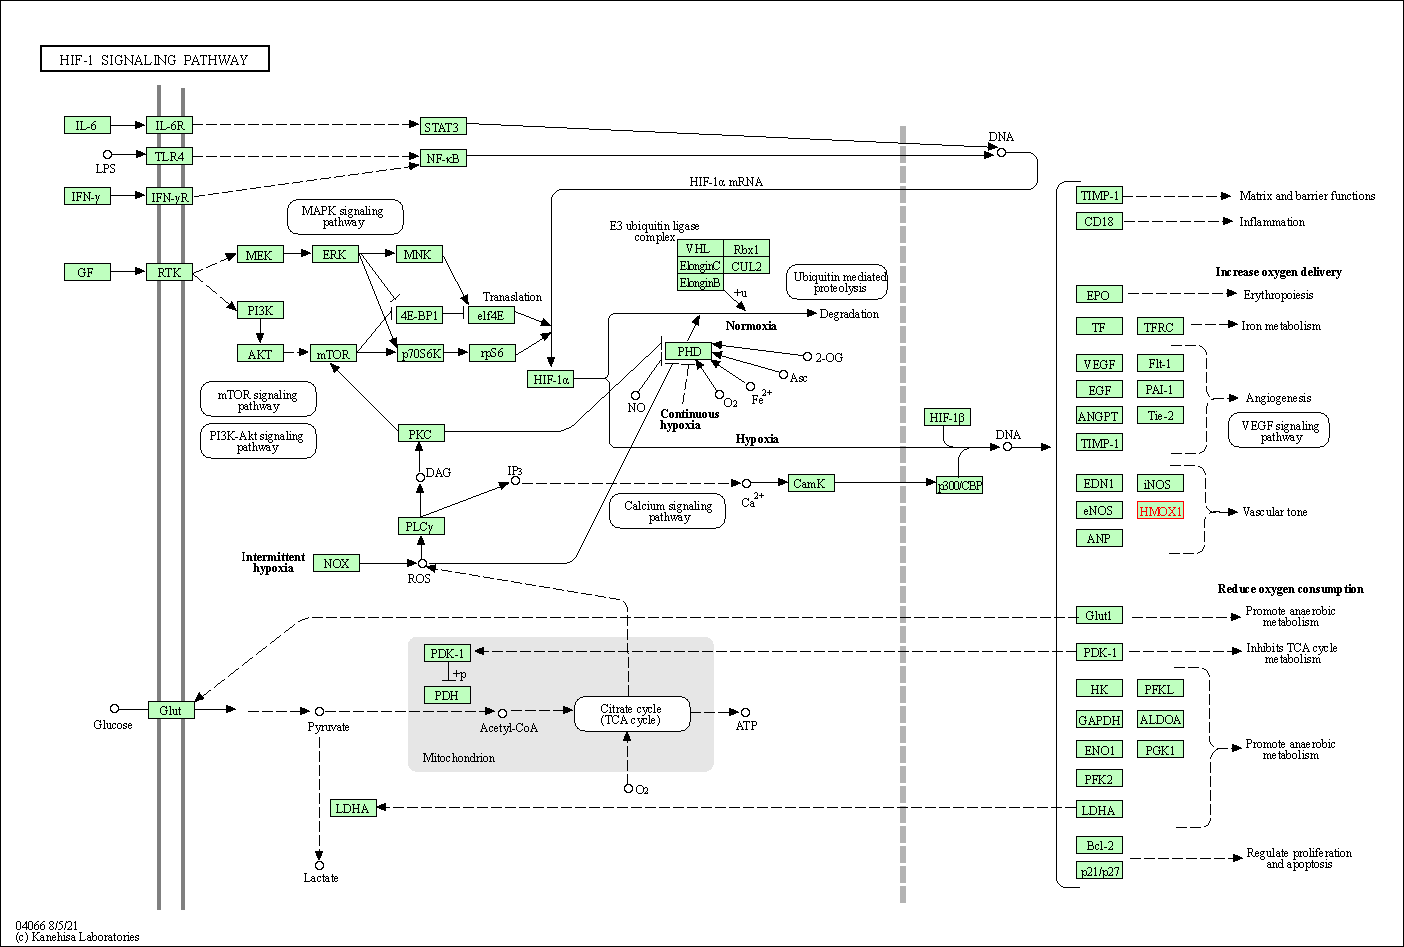
| HIF-1 signaling pathway | hsa04066 | Affiliated Target |
|
| Class: Environmental Information Processing => Signal transduction | Pathway Hierarchy | ||
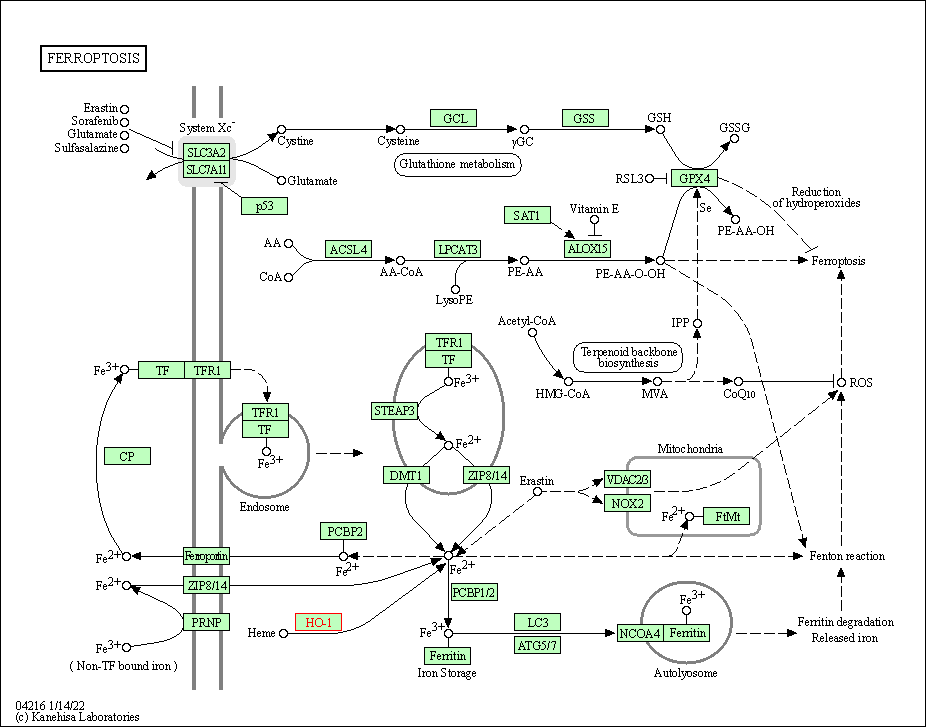
| Ferroptosis | hsa04216 | Affiliated Target |
|
| Class: Cellular Processes => Cell growth and death | Pathway Hierarchy | ||
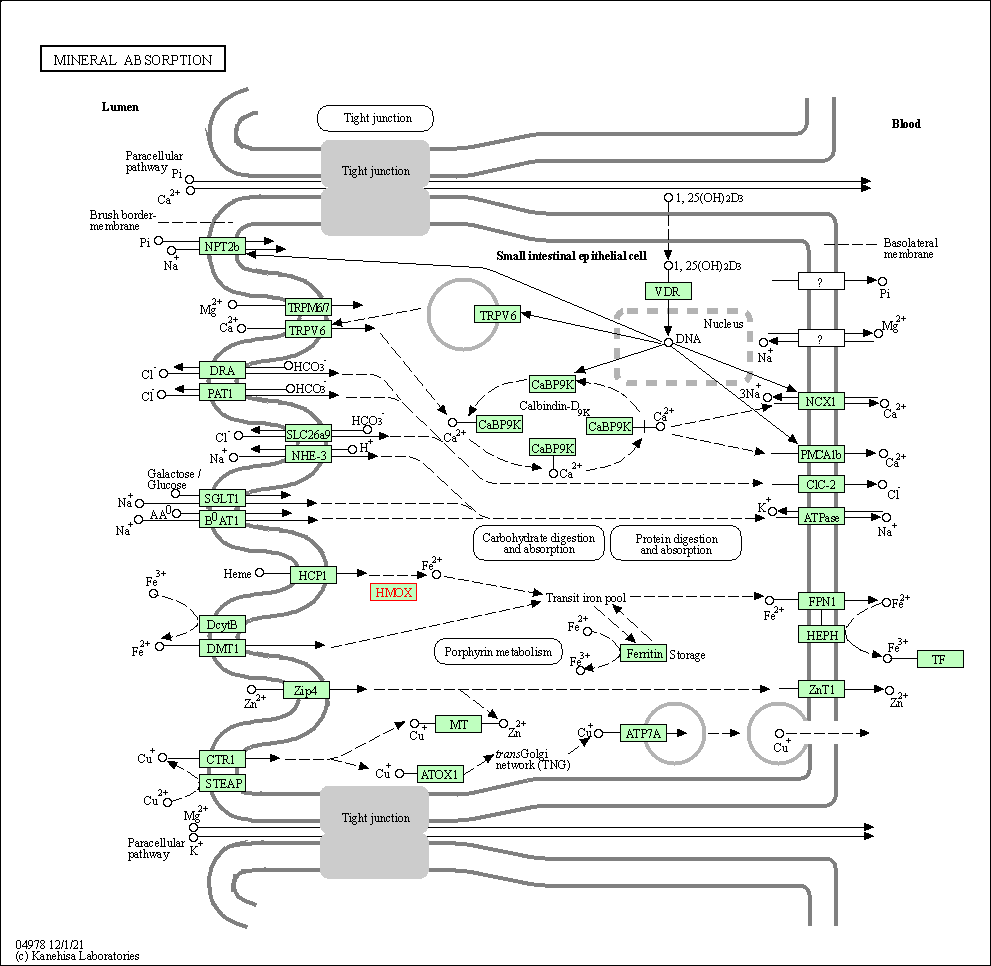
| Mineral absorption | hsa04978 | Affiliated Target |
|
| Class: Organismal Systems => Digestive system | Pathway Hierarchy | ||
| Degree | 6 | Degree centrality | 6.45E-04 | Betweenness centrality | 2.42E-03 |
|---|---|---|---|---|---|
| Closeness centrality | 2.24E-01 | Radiality | 1.39E+01 | Clustering coefficient | 1.33E-01 |
| Neighborhood connectivity | 3.07E+01 | Topological coefficient | 1.82E-01 | Eccentricity | 11 |
| Download | Click to Download the Full PPI Network of This Target | ||||
| Chemical Structure based Activity Landscape of Target | Top |
|---|---|
| Drug Property Profile of Target | Top | |
|---|---|---|
| (1) Molecular Weight (mw) based Drug Clustering | (2) Octanol/Water Partition Coefficient (xlogp) based Drug Clustering | |
|
|
||
| (3) Hydrogen Bond Donor Count (hbonddonor) based Drug Clustering | (4) Hydrogen Bond Acceptor Count (hbondacc) based Drug Clustering | |
|
|
||
| (5) Rotatable Bond Count (rotbonds) based Drug Clustering | (6) Topological Polar Surface Area (polararea) based Drug Clustering | |
|
|
||
| "RO5" indicates the cutoff set by lipinski's rule of five; "D123AB" colored in GREEN denotes the no violation of any cutoff in lipinski's rule of five; "D123AB" colored in PURPLE refers to the violation of only one cutoff in lipinski's rule of five; "D123AB" colored in BLACK represents the violation of more than one cutoffs in lipinski's rule of five | ||
| Target Regulators | Top | |||||
|---|---|---|---|---|---|---|
| Target-regulating microRNAs | ||||||
| Target-regulating Transcription Factors | ||||||
| Target Affiliated Biological Pathways | Top | |||||
|---|---|---|---|---|---|---|
| BioCyc | [+] 1 BioCyc Pathways | + | ||||
| 1 | Heme degradation | |||||
| KEGG Pathway | [+] 4 KEGG Pathways | + | ||||
| 1 | Porphyrin and chlorophyll metabolism | |||||
| 2 | HIF-1 signaling pathway | |||||
| 3 | Mineral absorption | |||||
| 4 | MicroRNAs in cancer | |||||
| Pathwhiz Pathway | [+] 1 Pathwhiz Pathways | + | ||||
| 1 | Porphyrin Metabolism | |||||
| PID Pathway | [+] 2 PID Pathways | + | ||||
| 1 | Validated transcriptional targets of AP1 family members Fra1 and Fra2 | |||||
| 2 | HIF-1-alpha transcription factor network | |||||
| Reactome | [+] 1 Reactome Pathways | + | ||||
| 1 | Iron uptake and transport | |||||
| WikiPathways | [+] 9 WikiPathways | + | ||||
| 1 | Oxidative Stress | |||||
| 2 | Transcriptional activation by NRF2 | |||||
| 3 | NRF2 pathway | |||||
| 4 | Nuclear Receptors Meta-Pathway | |||||
| 5 | miR-targeted genes in squamous cell - TarBase | |||||
| 6 | miR-targeted genes in muscle cell - TarBase | |||||
| 7 | miR-targeted genes in lymphocytes - TarBase | |||||
| 8 | miR-targeted genes in leukocytes - TarBase | |||||
| 9 | miR-targeted genes in epithelium - TarBase | |||||
| Target-Related Models and Studies | Top | |||||
|---|---|---|---|---|---|---|
| Target Validation | ||||||
| References | Top | |||||
|---|---|---|---|---|---|---|
| REF 1 | Chemoprevention of severe neonatal hyperbilirubinemia. Semin Perinatol. 2004 Oct;28(5):365-8. | |||||
| REF 2 | ClinicalTrials.gov (NCT01887327) Study Evaluating the Safety and Efficacy of Two Doses of Stannsoporfin in Combination With Phototherapy in Neonates With Hyperbilirubinemia. U.S. National Institutes of Health. | |||||
| REF 3 | The Protein Data Bank. Nucleic Acids Res. 2000 Jan 1;28(1):235-42. | |||||
| REF 4 | How many drug targets are there Nat Rev Drug Discov. 2006 Dec;5(12):993-6. | |||||
| REF 5 | Adenovirus-mediated heme oxygenase-1 gene delivery inhibits injury-induced vascular neointima formation. Circulation. 2001 Nov 27;104(22):2710-5. | |||||
| REF 6 | DrugBank 3.0: a comprehensive resource for 'omics' research on drugs. Nucleic Acids Res. 2011 Jan;39(Database issue):D1035-41. | |||||
| REF 7 | Crystal structures of the ferric, ferrous, and ferrous-NO forms of the Asp140Ala mutant of human heme oxygenase-1: catalytic implications. J Mol Biol. 2003 Jul 11;330(3):527-38. | |||||
| REF 8 | In-Cell Enzymology To Probe His-Heme Ligation in Heme Oxygenase Catalysis. Biochemistry. 2016 Aug 30;55(34):4836-49. | |||||
If You Find Any Error in Data or Bug in Web Service, Please Kindly Report It to Dr. Zhou and Dr. Zhang.