Target Information
| Target General Information | Top | |||||
|---|---|---|---|---|---|---|
| Target ID |
T18639
(Former ID: TTDR00925)
|
|||||
| Target Name |
Heparin-binding growth factor 1 (FGF1)
|
|||||
| Synonyms |
HBGF-1; Fibroblast growth factor 1; FGFA; FGF-1; Endothelial cell growth factor; ECGF-beta; ECGF; Beta-endothelial cell growth factor; Acidic fibroblast growth factor; AFGF
Click to Show/Hide
|
|||||
| Gene Name |
FGF1
|
|||||
| Target Type |
Clinical trial target
|
[1] | ||||
| Disease | [+] 2 Target-related Diseases | + | ||||
| 1 | Chronic arterial occlusive disease [ICD-11: BD4Z] | |||||
| 2 | Coronary atherosclerosis [ICD-11: BA80] | |||||
| Function |
Functions as potent mitogen in vitro. Acts as a ligand for FGFR1 and integrins. Binds to FGFR1 in the presence of heparin leading to FGFR1 dimerization and activation via sequential autophosphorylation on tyrosine residues which act as docking sites for interacting proteins, leading to the activation of several signaling cascades. Binds to integrin ITGAV:ITGB3. Its binding to integrin, subsequent ternary complex formation with integrin and FGFR1, and the recruitment of PTPN11 to the complex are essential for FGF1 signaling. Induces the phosphorylation and activation of FGFR1, FRS2, MAPK3/ERK1, MAPK1/ERK2 and AKT1. Can induce angiogenesis. Plays an important role in the regulation of cell survival, cell division, angiogenesis, cell differentiation and cell migration.
Click to Show/Hide
|
|||||
| BioChemical Class |
Growth factor
|
|||||
| UniProt ID | ||||||
| Sequence |
MAEGEITTFTALTEKFNLPPGNYKKPKLLYCSNGGHFLRILPDGTVDGTRDRSDQHIQLQ
LSAESVGEVYIKSTETGQYLAMDTDGLLYGSQTPNEECLFLERLEENHYNTYISKKHAEK NWFVGLKKNGSCKRGPRTHYGQKAILFLPLPVSSD Click to Show/Hide
|
|||||
| 3D Structure | Click to Show 3D Structure of This Target | PDB | ||||
| HIT2.0 ID | T75SPS | |||||
| Drugs and Modes of Action | Top | |||||
|---|---|---|---|---|---|---|
| Clinical Trial Drug(s) | [+] 1 Clinical Trial Drugs | + | ||||
| 1 | CVBT-141H | Drug Info | Phase 2 | Coronary artery disease | [2] | |
| Discontinued Drug(s) | [+] 1 Discontinued Drugs | + | ||||
| 1 | Riferminogene pecaplasmid | Drug Info | Discontinued in Phase 3 | Critical limb ischemia | [3] | |
| Mode of Action | [+] 2 Modes of Action | + | ||||
| Modulator | [+] 2 Modulator drugs | + | ||||
| 1 | CVBT-141H | Drug Info | [1] | |||
| 2 | Riferminogene pecaplasmid | Drug Info | [4] | |||
| Inhibitor | [+] 6 Inhibitor drugs | + | ||||
| 1 | 5-AMINO-NAPHTALENE-2-MONOSULFONATE | Drug Info | [5] | |||
| 2 | Formic Acid | Drug Info | [6] | |||
| 3 | N,O6-Disulfo-Glucosamine | Drug Info | [6] | |||
| 4 | Naphthalene Trisulfonate | Drug Info | [6] | |||
| 5 | O2-Sulfo-Glucuronic Acid | Drug Info | [6] | |||
| 6 | Sucrose Octasulfate | Drug Info | [6] | |||
| Cell-based Target Expression Variations | Top | |||||
|---|---|---|---|---|---|---|
| Cell-based Target Expression Variations | ||||||
| Drug Binding Sites of Target | Top | |||||
|---|---|---|---|---|---|---|
| Ligand Name: Myo-inositol hexaphosphate | Ligand Info | |||||
| Structure Description | Solution structure of human acidic fibroblast growth factor in complex with anti-angiogenic drug inositol hexaphosphate (IP6) | PDB:2K8R | ||||
| Method | Solution NMR | Resolution | N.A. | Mutation | No | [7] |
| PDB Sequence |
YKKPKLLYCS
10 NGGHFLRILP20 DGTVDGTRDR30 SDQHIQLQLS40 AESVGEVYIK50 STETGQYLAM 60 DTDGLLYGSQ70 TPNEECLFLE80 RLEENHYNTY90 ISKKHAEKNW100 FVGLKKNGSC 110 KRGPRTHYGQ120 KAILFLPLPV130 SSD
|
|||||
|
|
||||||
| Ligand Name: Naphthalene Trisulfonate | Ligand Info | |||||
| Structure Description | NMR STUDY OF ACID FIBROBLAST GROWTH FACTOR BOUND TO 1,3,6-NAPHTHALENE TRISULPHONATE, 26 STRUCTURES | PDB:1RML | ||||
| Method | Solution NMR | Resolution | N.A. | Mutation | No | [8] |
| PDB Sequence |
KPKLLYCSNG
33 GHFLRILPDG43 TVDGTRDRSD53 QHIQLQLSAE63 SVGEVYIKST73 ETGQYLAMDT 83 DGLLYGSQTP93 NEECLFLERL103 EENHYNTYIS113 KKHAEKNWFV123 GLKKNGSCKR 133 GPRTHYGQKA143 ILFLPLPVSS153 D
|
|||||
|
|
||||||
| Click to View More Binding Site Information of This Target with Different Ligands | ||||||
| Different Human System Profiles of Target | Top |
|---|---|
|
Human Similarity Proteins
of target is determined by comparing the sequence similarity of all human proteins with the target based on BLAST. The similarity proteins for a target are defined as the proteins with E-value < 0.005 and outside the protein families of the target.
A target that has fewer human similarity proteins outside its family is commonly regarded to possess a greater capacity to avoid undesired interactions and thus increase the possibility of finding successful drugs
(Brief Bioinform, 21: 649-662, 2020).
Human Tissue Distribution
of target is determined from a proteomics study that quantified more than 12,000 genes across 32 normal human tissues. Tissue Specificity (TS) score was used to define the enrichment of target across tissues.
The distribution of targets among different tissues or organs need to be taken into consideration when assessing the target druggability, as it is generally accepted that the wider the target distribution, the greater the concern over potential adverse effects
(Nat Rev Drug Discov, 20: 64-81, 2021).
Human Pathway Affiliation
of target is determined by the life-essential pathways provided on KEGG database. The target-affiliated pathways were defined based on the following two criteria (a) the pathways of the studied target should be life-essential for both healthy individuals and patients, and (b) the studied target should occupy an upstream position in the pathways and therefore had the ability to regulate biological function.
Targets involved in a fewer pathways have greater likelihood to be successfully developed, while those associated with more human pathways increase the chance of undesirable interferences with other human processes
(Pharmacol Rev, 58: 259-279, 2006).
Biological Network Descriptors
of target is determined based on a human protein-protein interactions (PPI) network consisting of 9,309 proteins and 52,713 PPIs, which were with a high confidence score of ≥ 0.95 collected from STRING database.
The network properties of targets based on protein-protein interactions (PPIs) have been widely adopted for the assessment of target’s druggability. Proteins with high node degree tend to have a high impact on network function through multiple interactions, while proteins with high betweenness centrality are regarded to be central for communication in interaction networks and regulate the flow of signaling information
(Front Pharmacol, 9, 1245, 2018;
Curr Opin Struct Biol. 44:134-142, 2017).
Human Similarity Proteins
Human Tissue Distribution
Human Pathway Affiliation
Biological Network Descriptors
|
|
|
There is no similarity protein (E value < 0.005) for this target
|
|
Note:
If a protein has TS (tissue specficity) scores at least in one tissue >= 2.5, this protein is called tissue-enriched (including tissue-enriched-but-not-specific and tissue-specific). In the plots, the vertical lines are at thresholds 2.5 and 4.
|
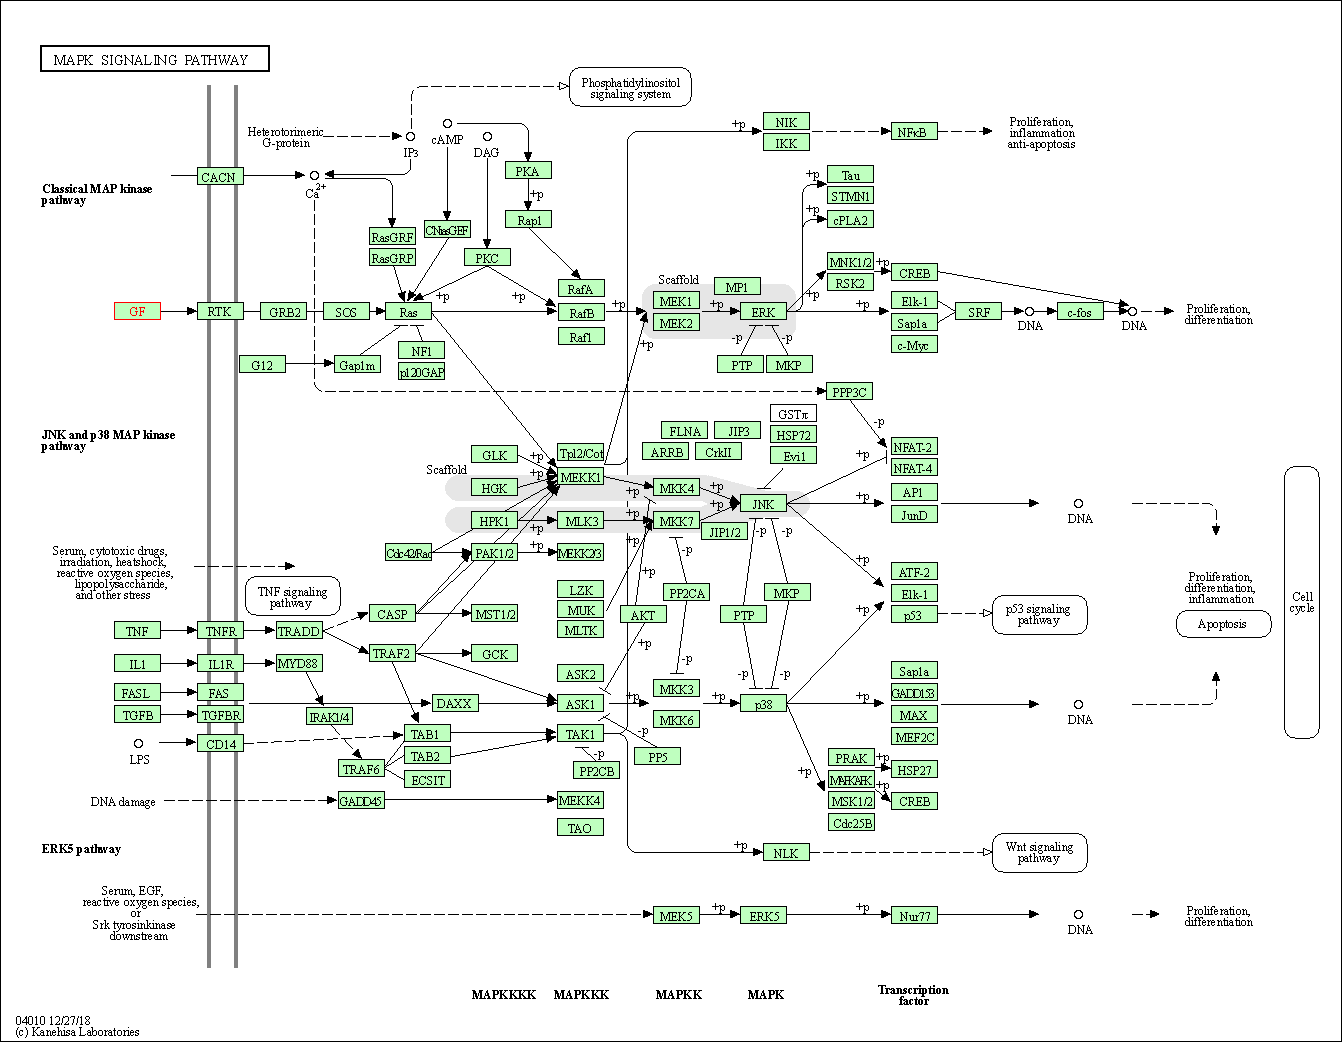
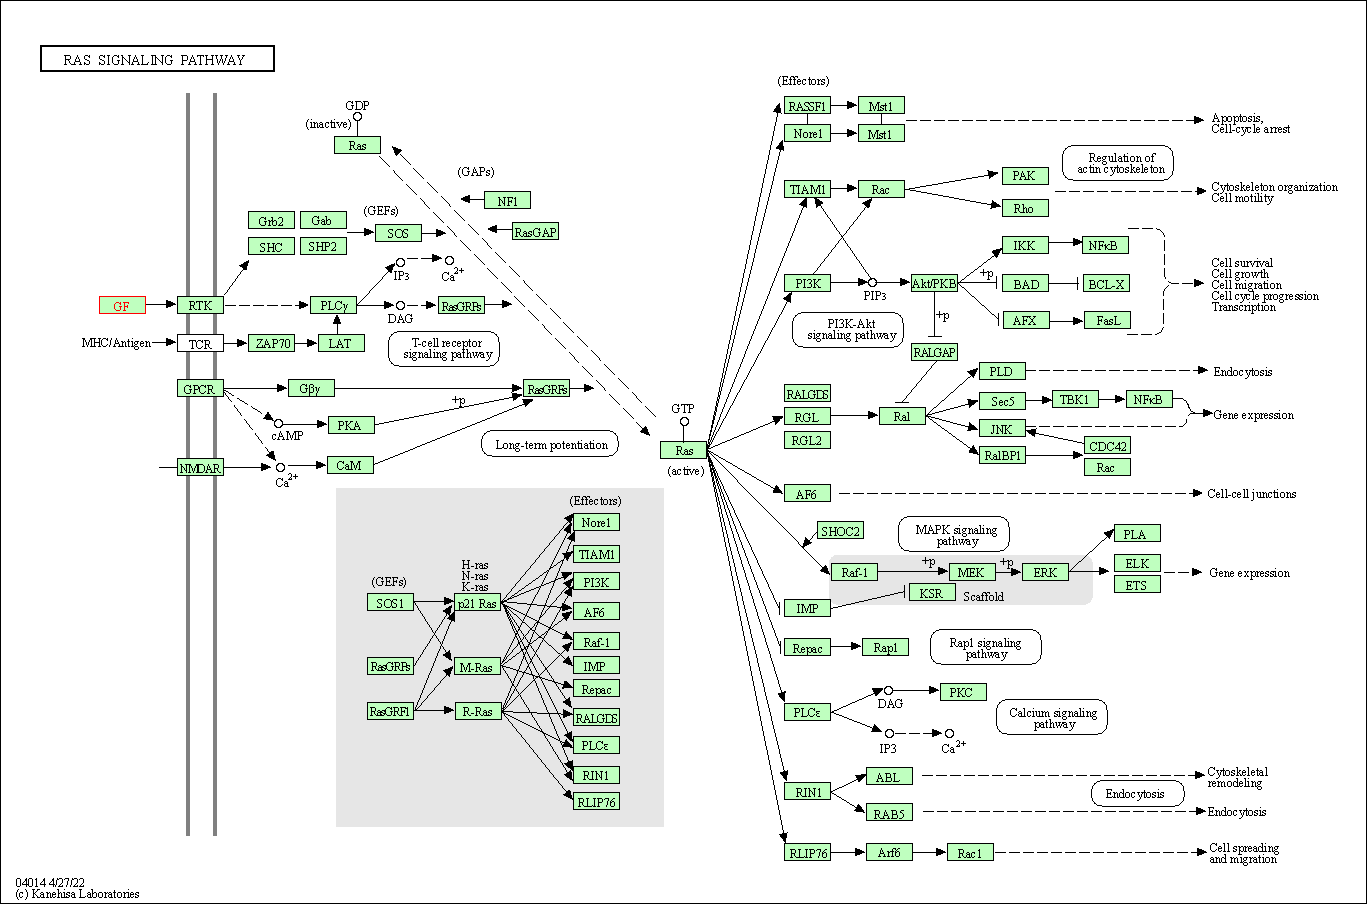
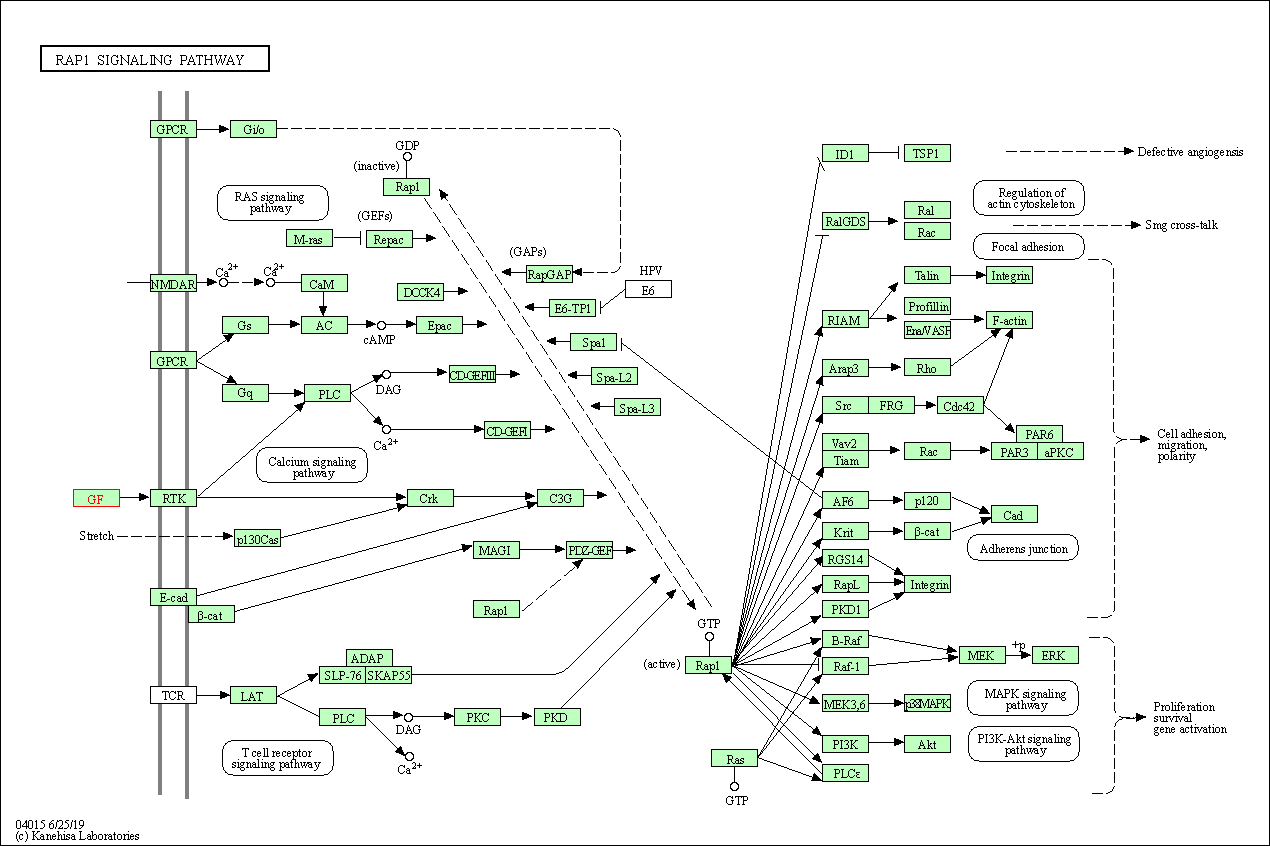
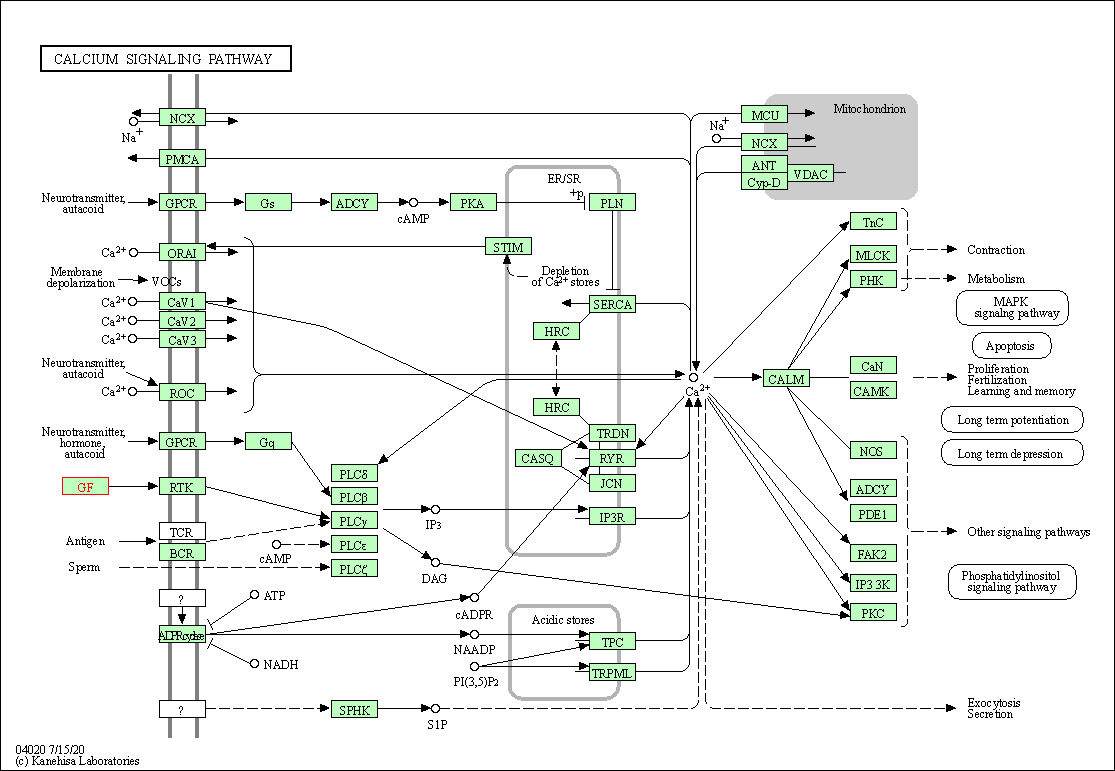
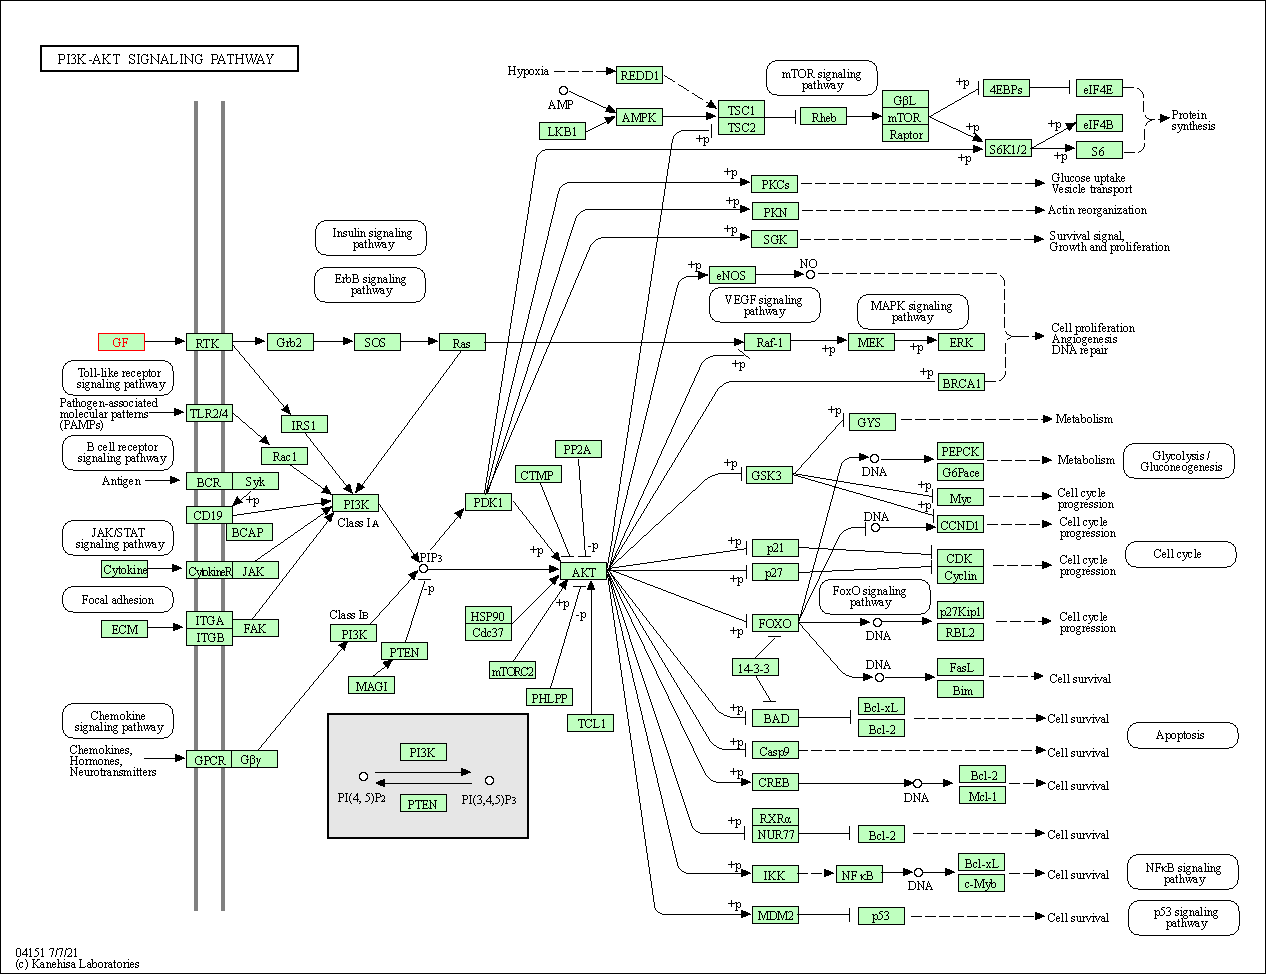
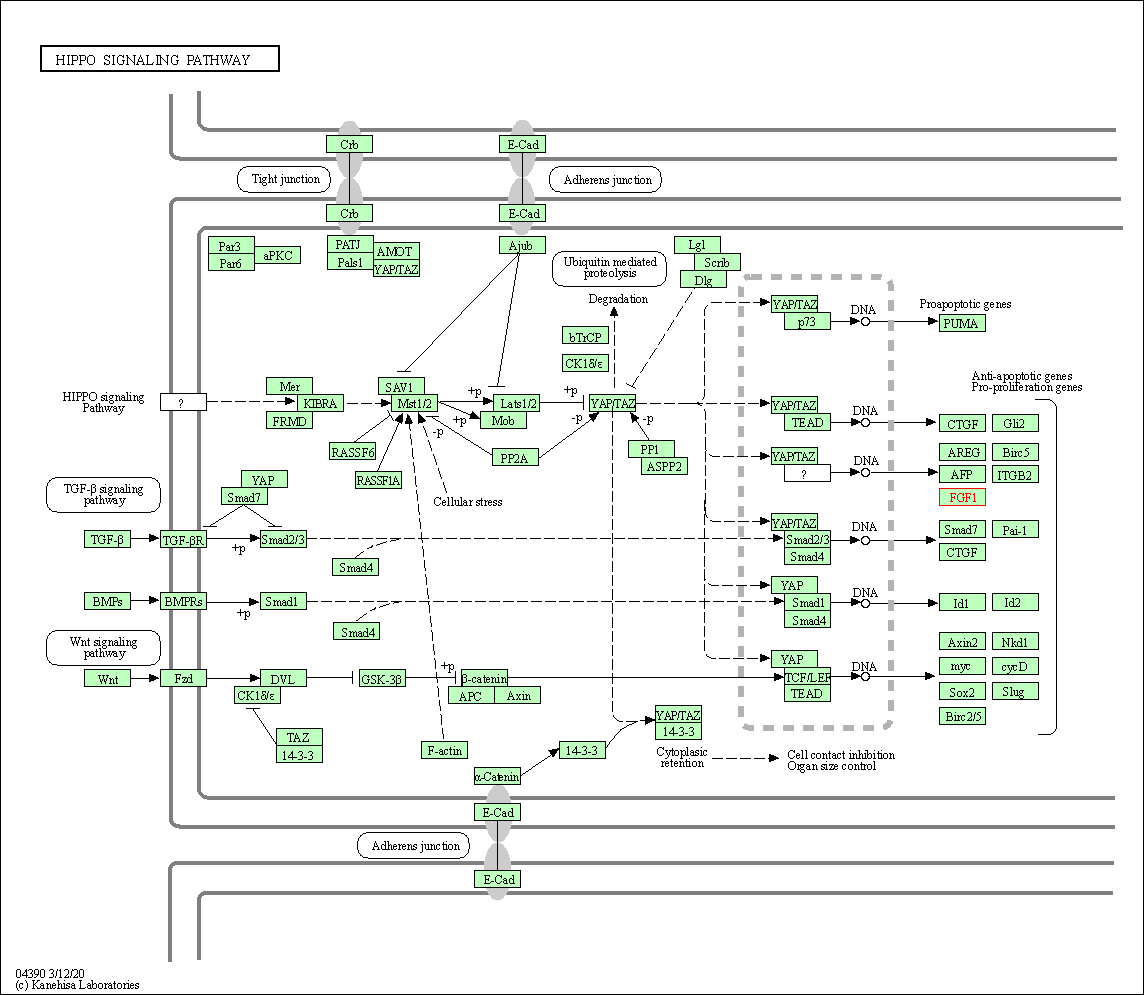
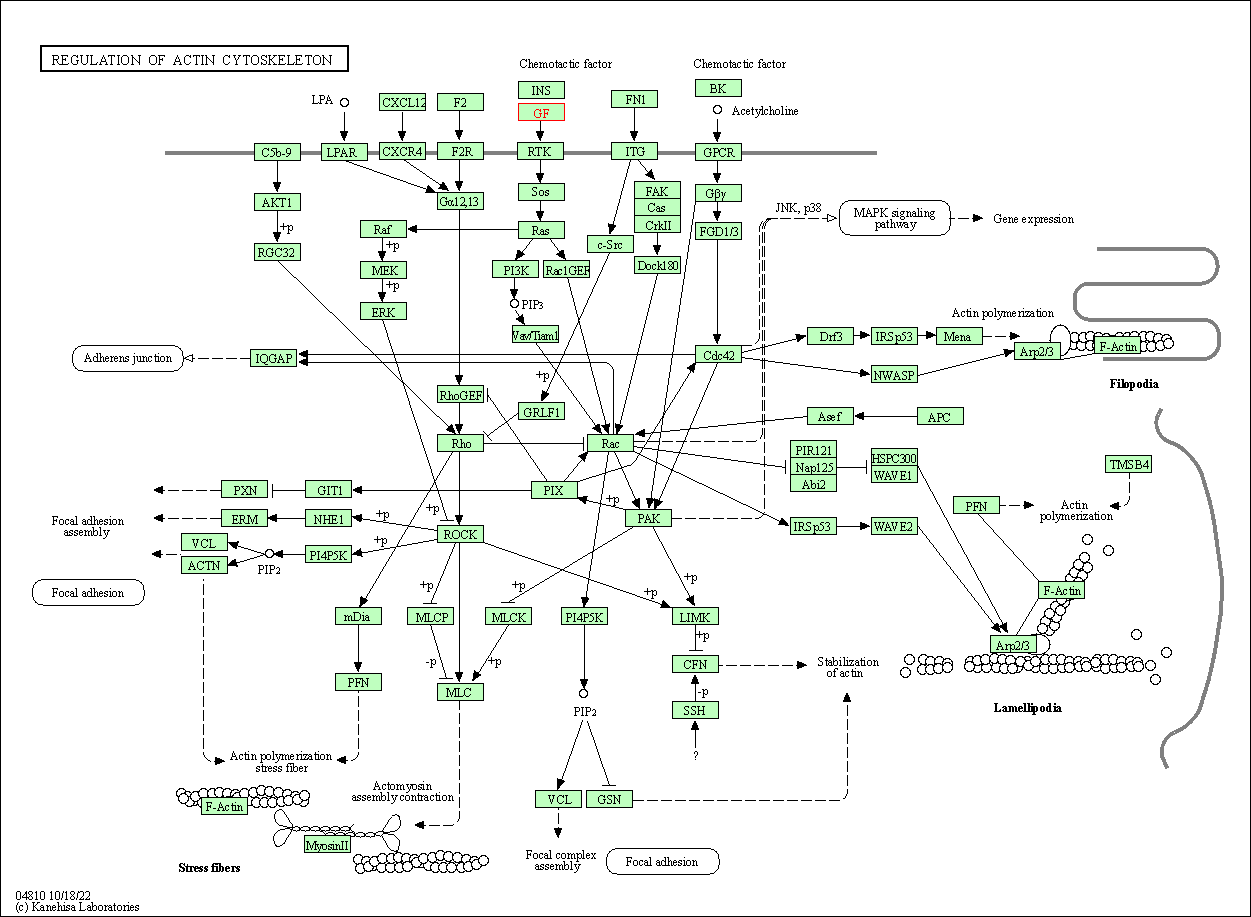
| KEGG Pathway | Pathway ID | Affiliated Target | Pathway Map |
|---|---|---|---|
| MAPK signaling pathway | hsa04010 | Affiliated Target |

|
| Class: Environmental Information Processing => Signal transduction | Pathway Hierarchy | ||
| Ras signaling pathway | hsa04014 | Affiliated Target |

|
| Class: Environmental Information Processing => Signal transduction | Pathway Hierarchy | ||
| Rap1 signaling pathway | hsa04015 | Affiliated Target |

|
| Class: Environmental Information Processing => Signal transduction | Pathway Hierarchy | ||
| Calcium signaling pathway | hsa04020 | Affiliated Target |

|
| Class: Environmental Information Processing => Signal transduction | Pathway Hierarchy | ||
| PI3K-Akt signaling pathway | hsa04151 | Affiliated Target |

|
| Class: Environmental Information Processing => Signal transduction | Pathway Hierarchy | ||
| Hippo signaling pathway | hsa04390 | Affiliated Target |

|
| Class: Environmental Information Processing => Signal transduction | Pathway Hierarchy | ||
| Regulation of actin cytoskeleton | hsa04810 | Affiliated Target |

|
| Class: Cellular Processes => Cell motility | Pathway Hierarchy | ||
| Click to Show/Hide the Information of Affiliated Human Pathways | |||
| Degree | 7 | Degree centrality | 7.52E-04 | Betweenness centrality | 1.19E-04 |
|---|---|---|---|---|---|
| Closeness centrality | 1.98E-01 | Radiality | 1.34E+01 | Clustering coefficient | 9.52E-02 |
| Neighborhood connectivity | 1.57E+01 | Topological coefficient | 2.55E-01 | Eccentricity | 13 |
| Download | Click to Download the Full PPI Network of This Target | ||||
| Drug Property Profile of Target | Top | |
|---|---|---|
| (1) Molecular Weight (mw) based Drug Clustering | (2) Octanol/Water Partition Coefficient (xlogp) based Drug Clustering | |
|
|
||
| (3) Hydrogen Bond Donor Count (hbonddonor) based Drug Clustering | (4) Hydrogen Bond Acceptor Count (hbondacc) based Drug Clustering | |
|
|
||
| (5) Rotatable Bond Count (rotbonds) based Drug Clustering | (6) Topological Polar Surface Area (polararea) based Drug Clustering | |
|
|
||
| "RO5" indicates the cutoff set by lipinski's rule of five; "D123AB" colored in GREEN denotes the no violation of any cutoff in lipinski's rule of five; "D123AB" colored in PURPLE refers to the violation of only one cutoff in lipinski's rule of five; "D123AB" colored in BLACK represents the violation of more than one cutoffs in lipinski's rule of five | ||
| Target Poor or Non Binders | Top | |||||
|---|---|---|---|---|---|---|
| Target Poor or Non Binders | ||||||
| Target Regulators | Top | |||||
|---|---|---|---|---|---|---|
| Target-regulating microRNAs | ||||||
| Target-interacting Proteins | ||||||
| Target Profiles in Patients | Top | |||||
|---|---|---|---|---|---|---|
| Target Expression Profile (TEP) |
||||||
| References | Top | |||||
|---|---|---|---|---|---|---|
| REF 1 | Clinical pipeline report, company report or official report of CVBT. | |||||
| REF 2 | Trusted, scientifically sound profiles of drug programs, clinical trials, safety reports, and company deals, written by scientists. Springer. 2015. Adis Insight (drug id 800020529) | |||||
| REF 3 | Trusted, scientifically sound profiles of drug programs, clinical trials, safety reports, and company deals, written by scientists. Springer. 2015. Adis Insight (drug id 800011879) | |||||
| REF 4 | Riferminogene pecaplasmide. Am J Cardiovasc Drugs. 2010;10(5):343-6. | |||||
| REF 5 | The Protein Data Bank. Nucleic Acids Res. 2000 Jan 1;28(1):235-42. | |||||
| REF 6 | How many drug targets are there Nat Rev Drug Discov. 2006 Dec;5(12):993-6. | |||||
| REF 7 | Solution structure of human acidic fibroblast growth factor in complex with anti-angiogenic drug inositol hexaphosphate (IP6) | |||||
| REF 8 | Solution structure of acidic fibroblast growth factor bound to 1,3, 6-naphthalenetrisulfonate: a minimal model for the anti-tumoral action of suramins and suradistas. J Mol Biol. 1998 Sep 4;281(5):899-915. | |||||
If You Find Any Error in Data or Bug in Web Service, Please Kindly Report It to Dr. Zhou and Dr. Zhang.

