Target Information
| Target General Information | Top | |||||
|---|---|---|---|---|---|---|
| Target ID |
T24965
(Former ID: TTDI03097)
|
|||||
| Target Name |
Voltage-gated calcium channel alpha Cav1.1 (CACNA1S)
|
|||||
| Synonyms |
Voltage-gated calcium channel subunit alpha Cav1.1; Voltage-dependent L-type calcium channel subunit alpha-1S; Calcium channel, L type, alpha-1 polypeptide, isoform 3, skeletal muscle; CACNL1A3; CACN1; CACH1
Click to Show/Hide
|
|||||
| Gene Name |
CACNA1S
|
|||||
| Target Type |
Literature-reported target
|
[1] | ||||
| Function |
Pore-forming, alpha-1S subunit of the voltage-gated calcium channel that gives rise to L-type calcium currents in skeletal muscle. Calcium channels containing the alpha-1S subunit play an important role in excitation-contraction coupling in skeletal muscle via their interaction with RYR1, which triggers Ca(2+) release from the sarcplasmic reticulum and ultimately results in muscle contraction. Long-lasting (L-type) calcium channels belong to the 'high-voltage activated' (HVA) group.
Click to Show/Hide
|
|||||
| BioChemical Class |
Voltage-gated ion channel
|
|||||
| UniProt ID | ||||||
| Sequence |
MEPSSPQDEGLRKKQPKKPVPEILPRPPRALFCLTLENPLRKACISIVEWKPFETIILLT
IFANCVALAVYLPMPEDDNNSLNLGLEKLEYFFLIVFSIEAAMKIIAYGFLFHQDAYLRS GWNVLDFTIVFLGVFTVILEQVNVIQSHTAPMSSKGAGLDVKALRAFRVLRPLRLVSGVP SLQVVLNSIFKAMLPLFHIALLVLFMVIIYAIIGLELFKGKMHKTCYFIGTDIVATVENE EPSPCARTGSGRRCTINGSECRGGWPGPNHGITHFDNFGFSMLTVYQCITMEGWTDVLYW VNDAIGNEWPWIYFVTLILLGSFFILNLVLGVLSGEFTKEREKAKSRGTFQKLREKQQLD EDLRGYMSWITQGEVMDVEDFREGKLSLDEGGSDTESLYEIAGLNKIIQFIRHWRQWNRI FRWKCHDIVKSKVFYWLVILIVALNTLSIASEHHNQPLWLTRLQDIANRVLLSLFTTEML MKMYGLGLRQYFMSIFNRFDCFVVCSGILEILLVESGAMTPLGISVLRCIRLLRIFKITK YWTSLSNLVASLLNSIRSIASLLLLLFLFIVIFALLGMQLFGGRYDFEDTEVRRSNFDNF PQALISVFQVLTGEDWTSMMYNGIMAYGGPSYPGMLVCIYFIILFVCGNYILLNVFLAIA VDNLAEAESLTSAQKAKAEEKKRRKMSKGLPDKSEEEKSTMAKKLEQKPKGEGIPTTAKL KIDEFESNVNEVKDPYPSADFPGDDEEDEPEIPLSPRPRPLAELQLKEKAVPIPEASSFF IFSPTNKIRVLCHRIVNATWFTNFILLFILLSSAALAAEDPIRADSMRNQILKHFDIGFT SVFTVEIVLKMTTYGAFLHKGSFCRNYFNMLDLLVVAVSLISMGLESSAISVVKILRVLR VLRPLRAINRAKGLKHVVQCMFVAISTIGNIVLVTTLLQFMFACIGVQLFKGKFFRCTDL SKMTEEECRGYYYVYKDGDPMQIELRHREWVHSDFHFDNVLSAMMSLFTVSTFEGWPQLL YKAIDSNAEDVGPIYNNRVEMAIFFIIYIILIAFFMMNIFVGFVIVTFQEQGETEYKNCE LDKNQRQCVQYALKARPLRCYIPKNPYQYQVWYIVTSSYFEYLMFALIMLNTICLGMQHY NQSEQMNHISDILNVAFTIIFTLEMILKLMAFKARGYFGDPWNVFDFLIVIGSIIDVILS EIDTFLASSGGLYCLGGGCGNVDPDESARISSAFFRLFRVMRLIKLLSRAEGVRTLLWTF IKSFQALPYVALLIVMLFFIYAVIGMQMFGKIALVDGTQINRNNNFQTFPQAVLLLFRCA TGEAWQEILLACSYGKLCDPESDYAPGEEYTCGTNFAYYYFISFYMLCAFLVINLFVAVI MDNFDYLTRDWSILGPHHLDEFKAIWAEYDPEAKGRIKHLDVVTLLRRIQPPLGFGKFCP HRVACKRLVGMNMPLNSDGTVTFNATLFALVRTALKIKTEGNFEQANEELRAIIKKIWKR TSMKLLDQVIPPIGDDEVTVGKFYATFLIQEHFRKFMKRQEEYYGYRPKKDIVQIQAGLR TIEEEAAPEICRTVSGDLAAEEELERAMVEAAMEEGIFRRTGGLFGQVDNFLERTNSLPP VMANQRPLQFAEIEMEEMESPVFLEDFPQDPRTNPLARANTNNANANVAYGNSNHSNSHV FSSVHYEREFPEETETPATRGRALGQPCRVLGPHSKPCVEMLKGLLTQRAMPRGQAPPAP CQCPRVESSMPEDRKSSTPGSLHEETPHSRSTRENTSRCSAPATALLIQKALVRGGLGTL AADANFIMATGQALADACQMEPEEVEIMATELLKGREAPEGMASSLGCLNLGSSLGSLDQ HQGSQETLIPPRL Click to Show/Hide
|
|||||
| 3D Structure | Click to Show 3D Structure of This Target | AlphaFold | ||||
| HIT2.0 ID | T91K6V | |||||
| Cell-based Target Expression Variations | Top | |||||
|---|---|---|---|---|---|---|
| Cell-based Target Expression Variations | ||||||
| Different Human System Profiles of Target | Top |
|---|---|
|
Human Similarity Proteins
of target is determined by comparing the sequence similarity of all human proteins with the target based on BLAST. The similarity proteins for a target are defined as the proteins with E-value < 0.005 and outside the protein families of the target.
A target that has fewer human similarity proteins outside its family is commonly regarded to possess a greater capacity to avoid undesired interactions and thus increase the possibility of finding successful drugs
(Brief Bioinform, 21: 649-662, 2020).
Human Tissue Distribution
of target is determined from a proteomics study that quantified more than 12,000 genes across 32 normal human tissues. Tissue Specificity (TS) score was used to define the enrichment of target across tissues.
The distribution of targets among different tissues or organs need to be taken into consideration when assessing the target druggability, as it is generally accepted that the wider the target distribution, the greater the concern over potential adverse effects
(Nat Rev Drug Discov, 20: 64-81, 2021).
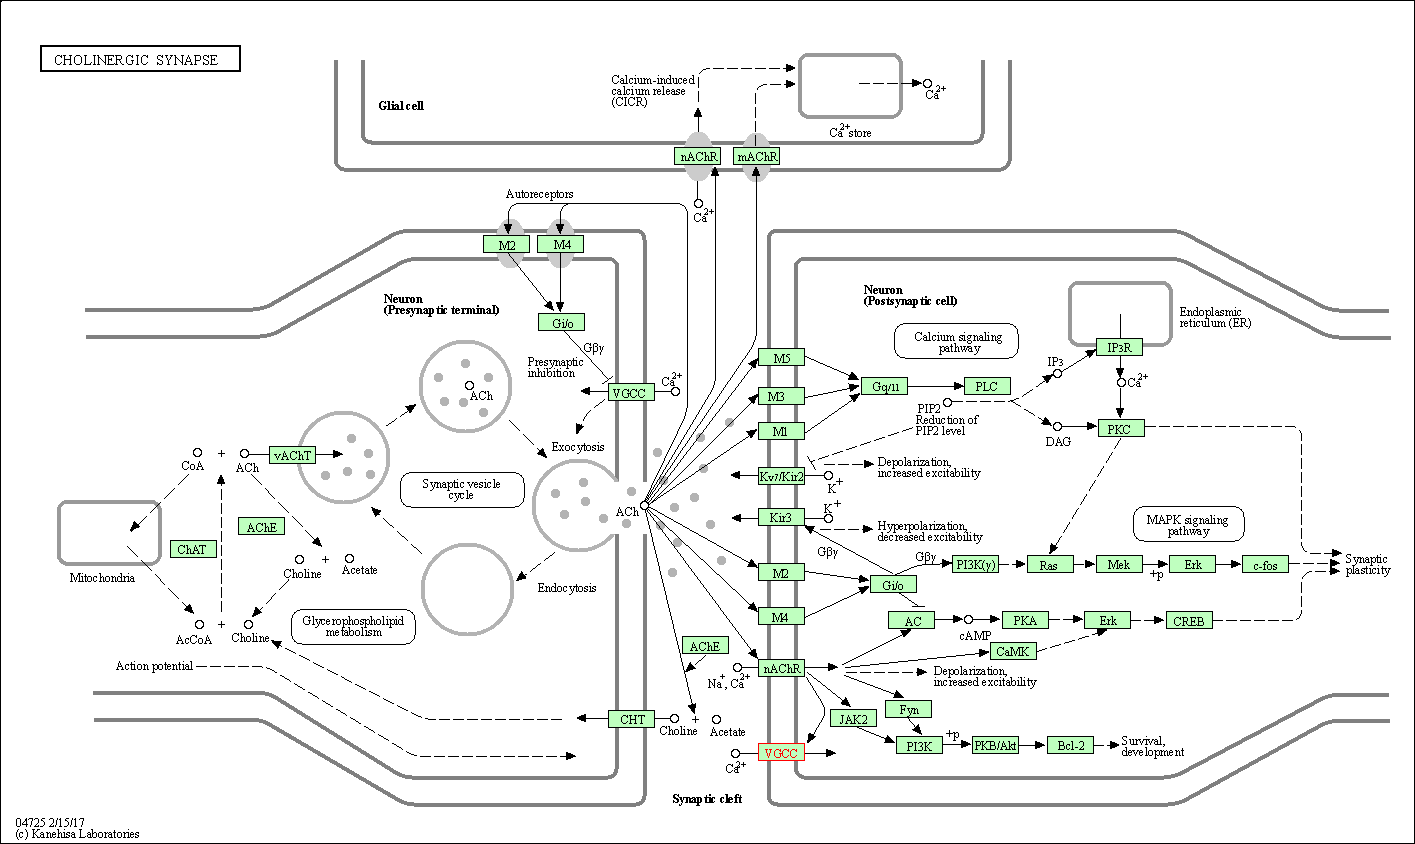
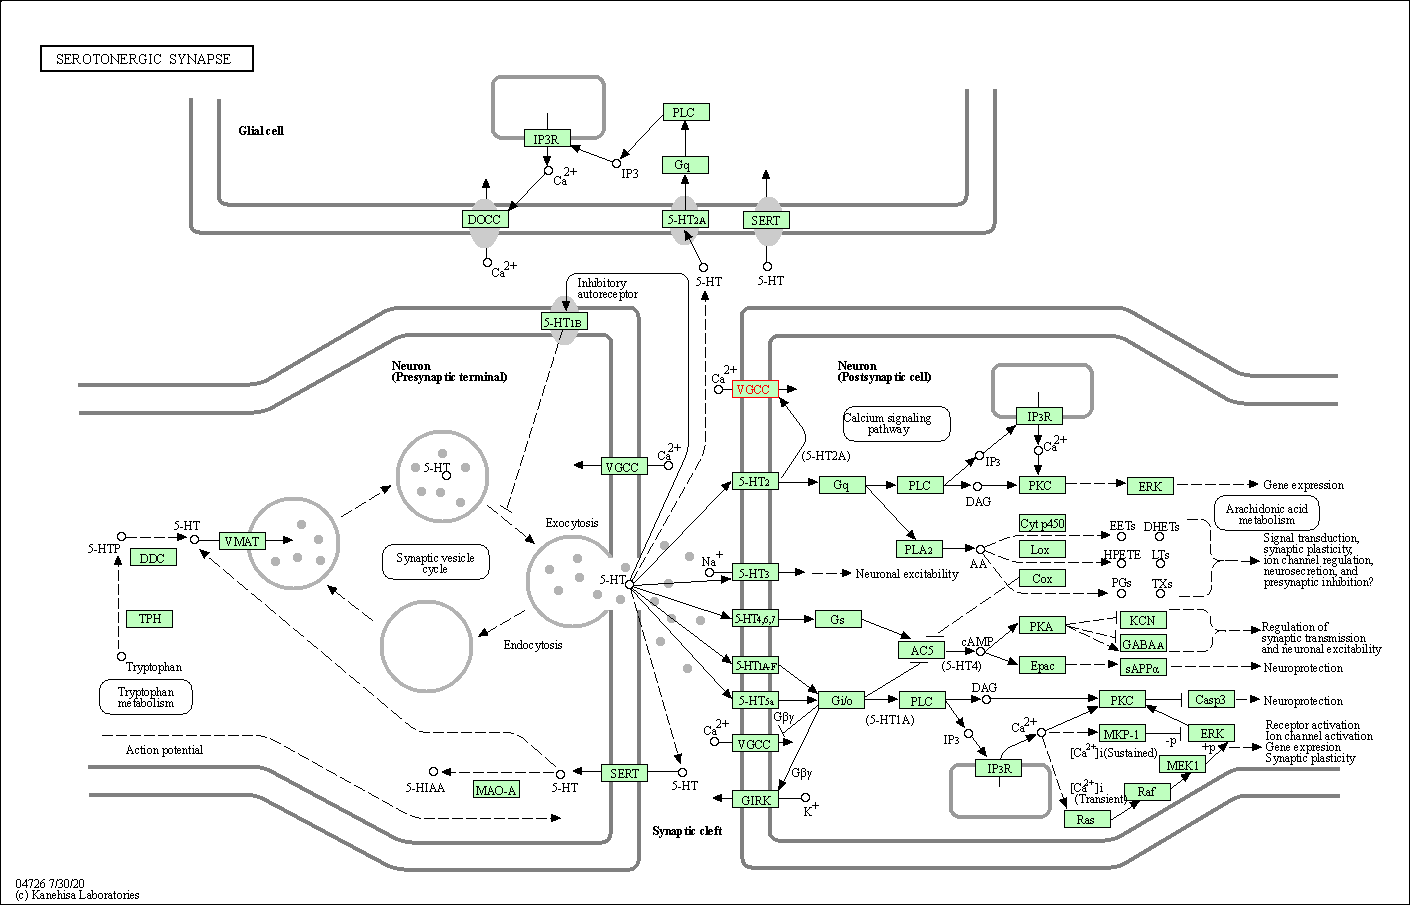
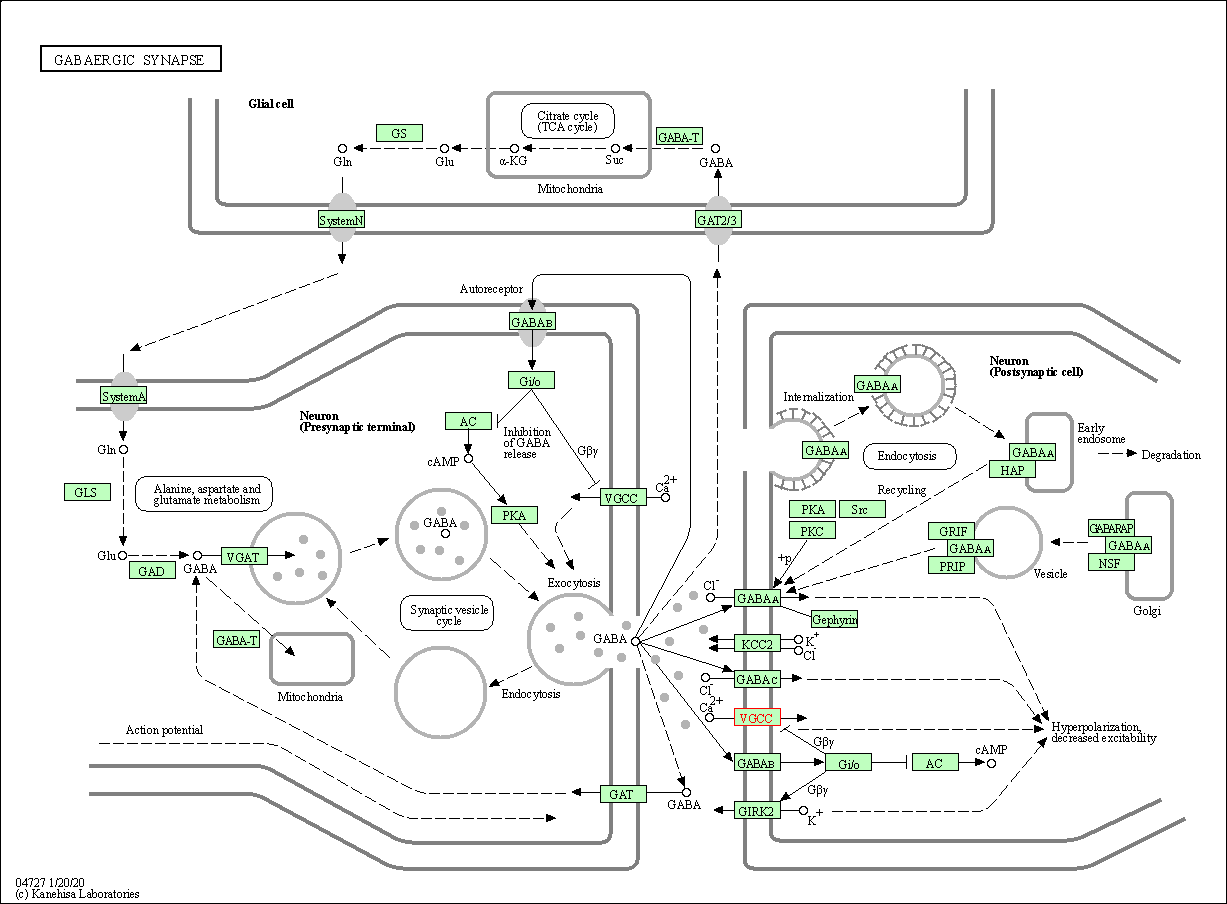
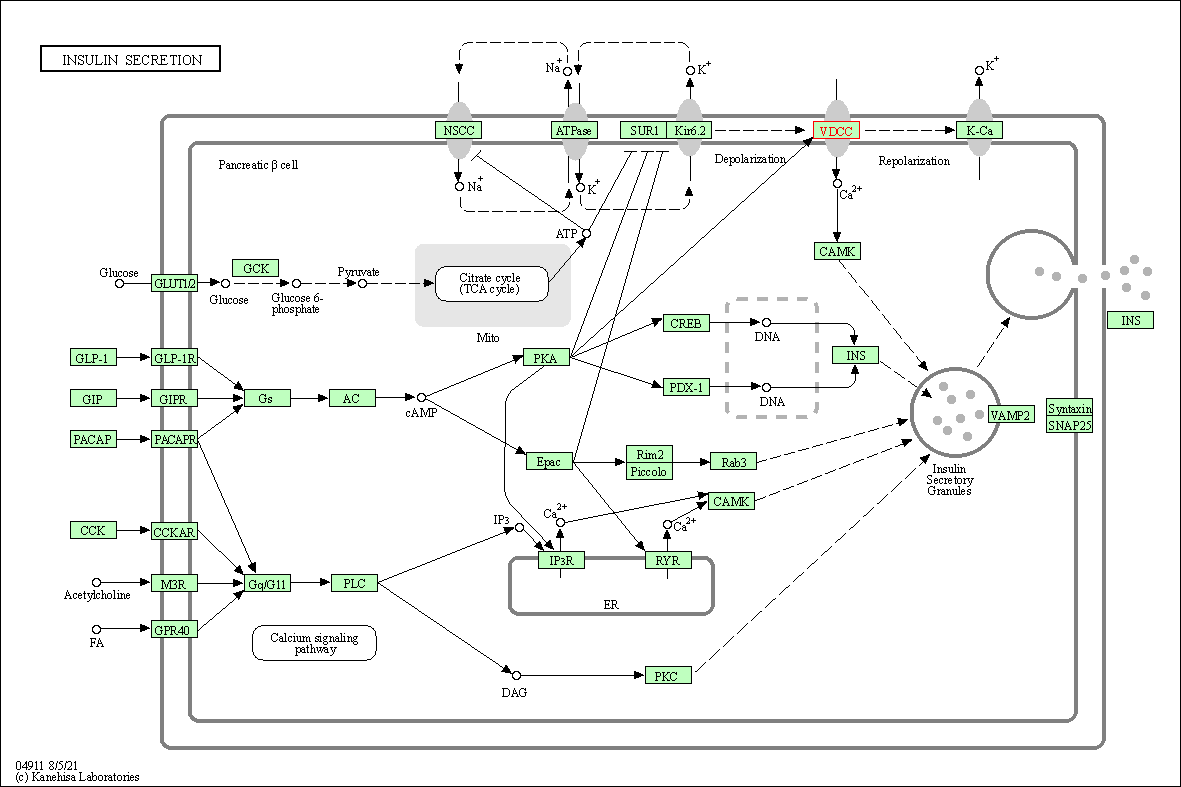
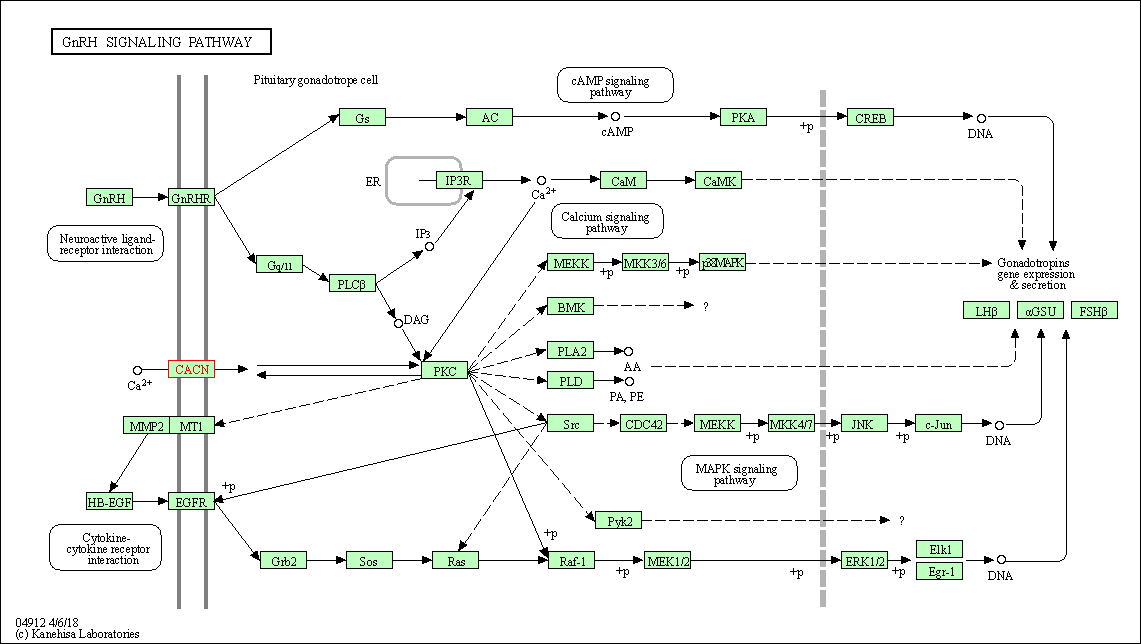
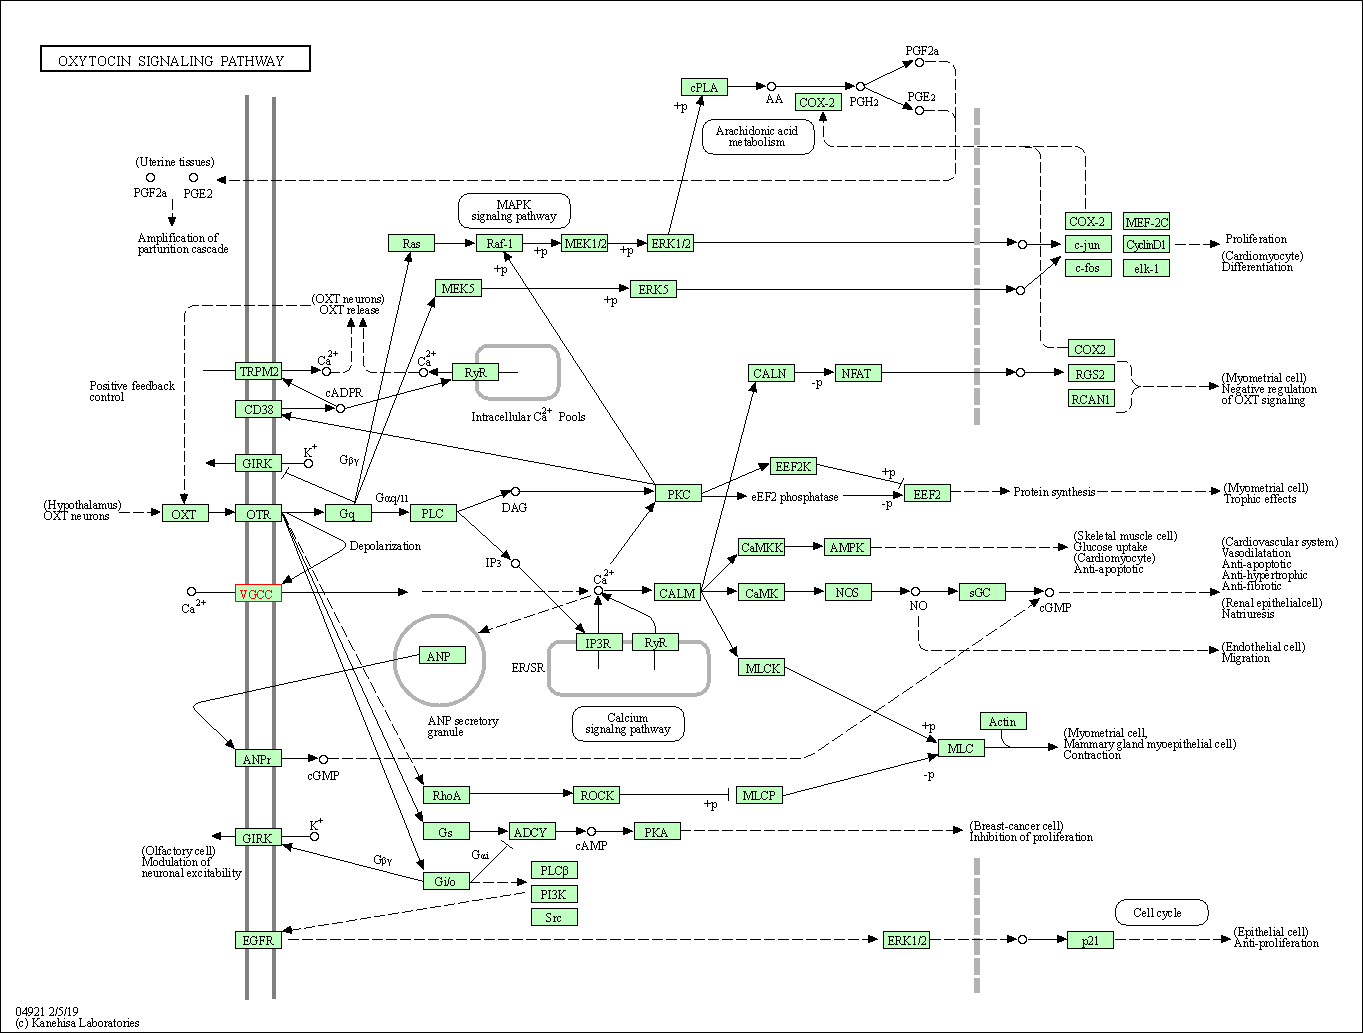
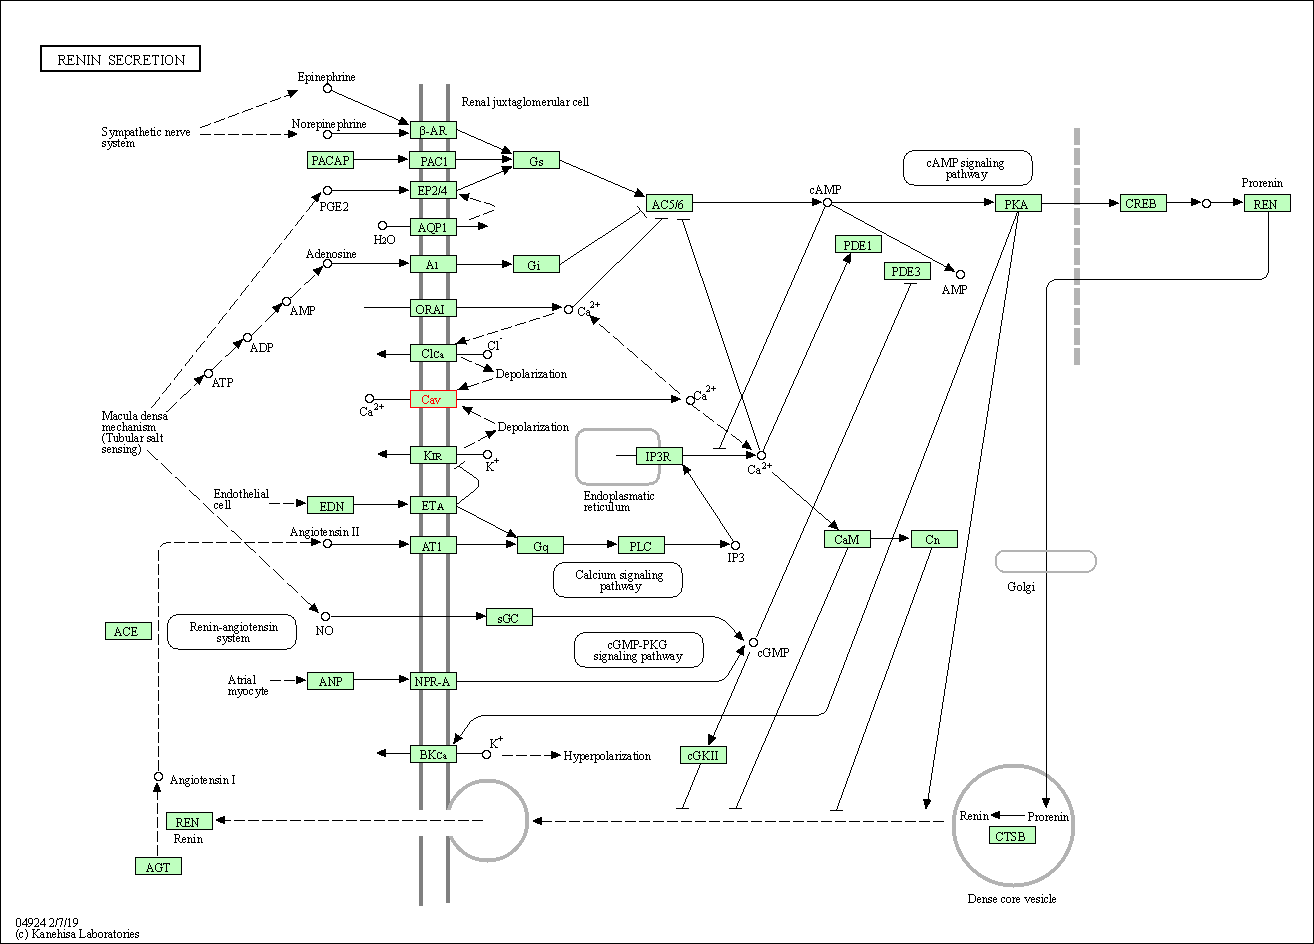
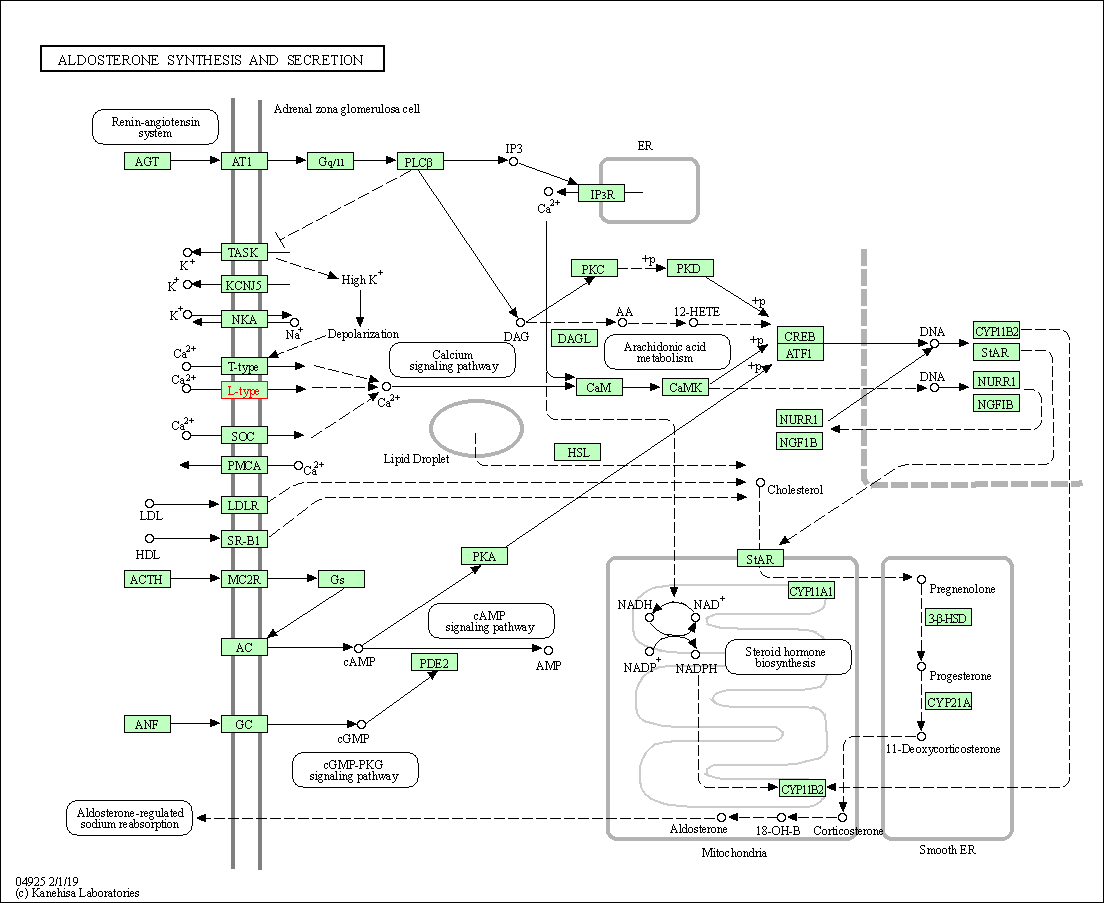
Human Pathway Affiliation
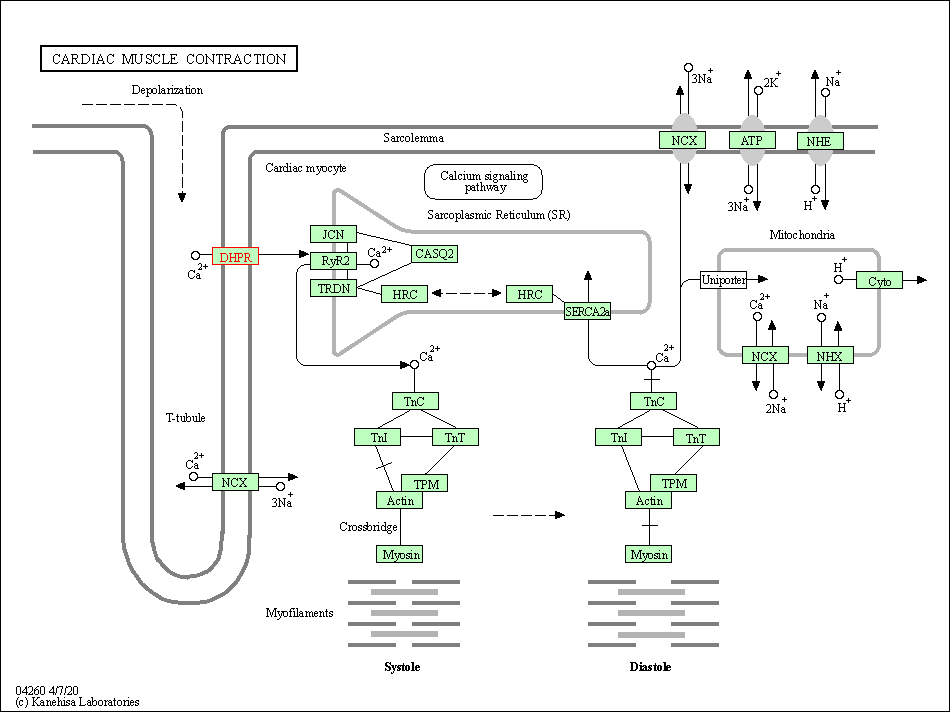
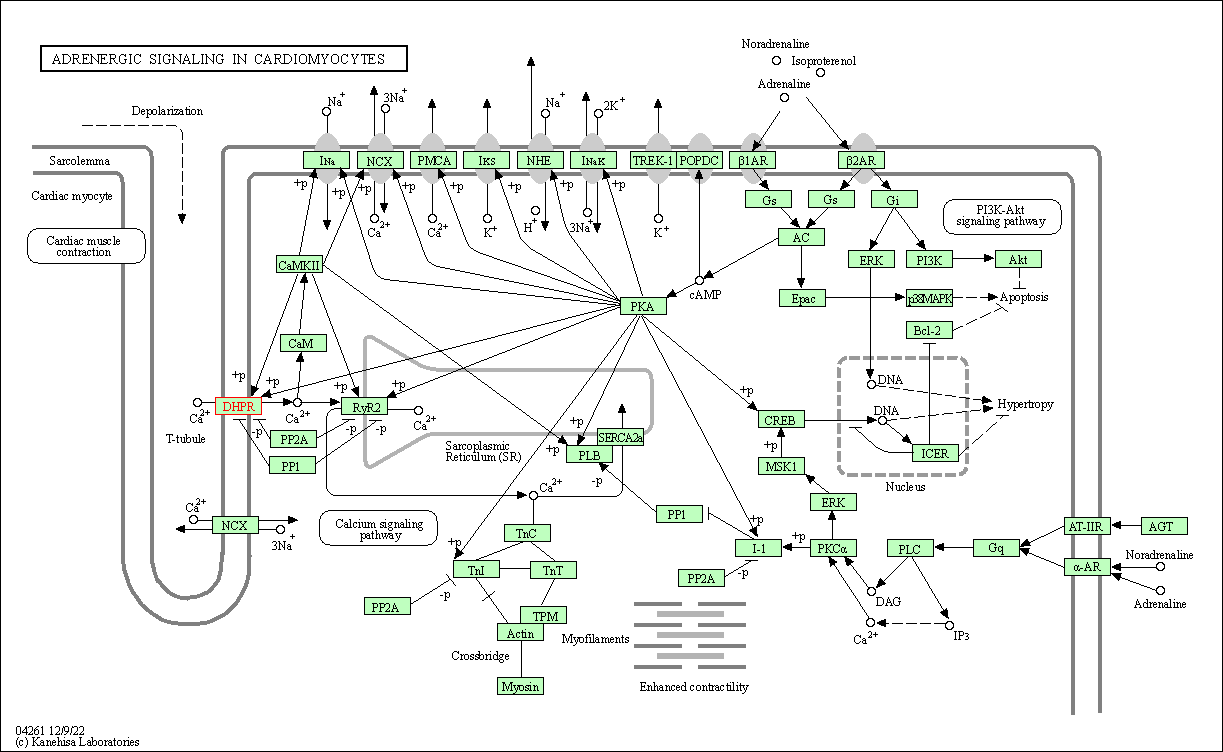
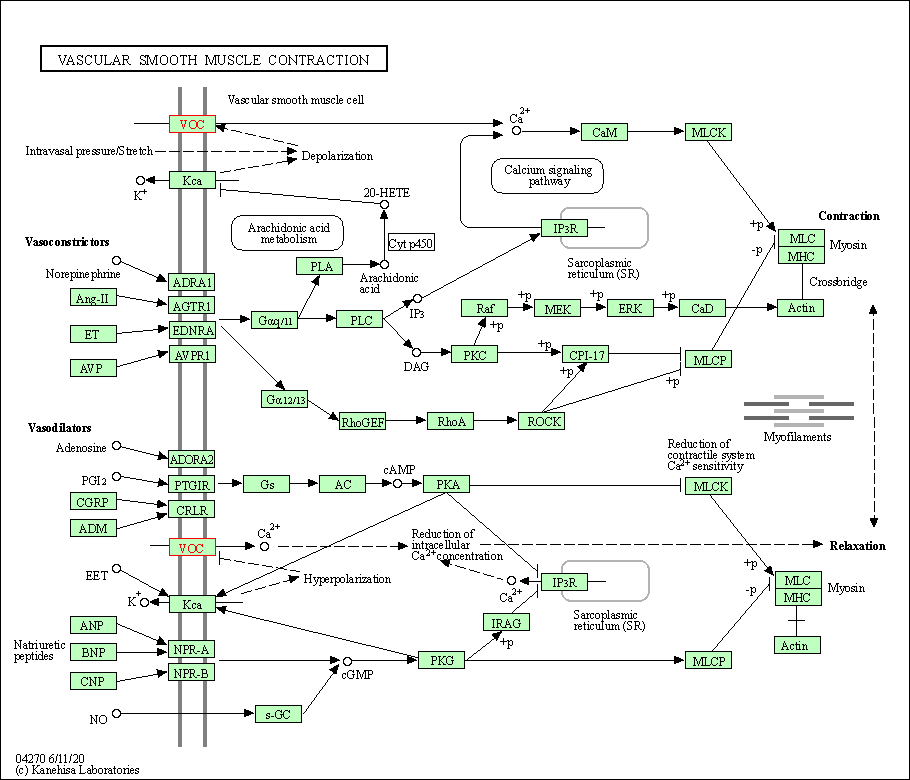
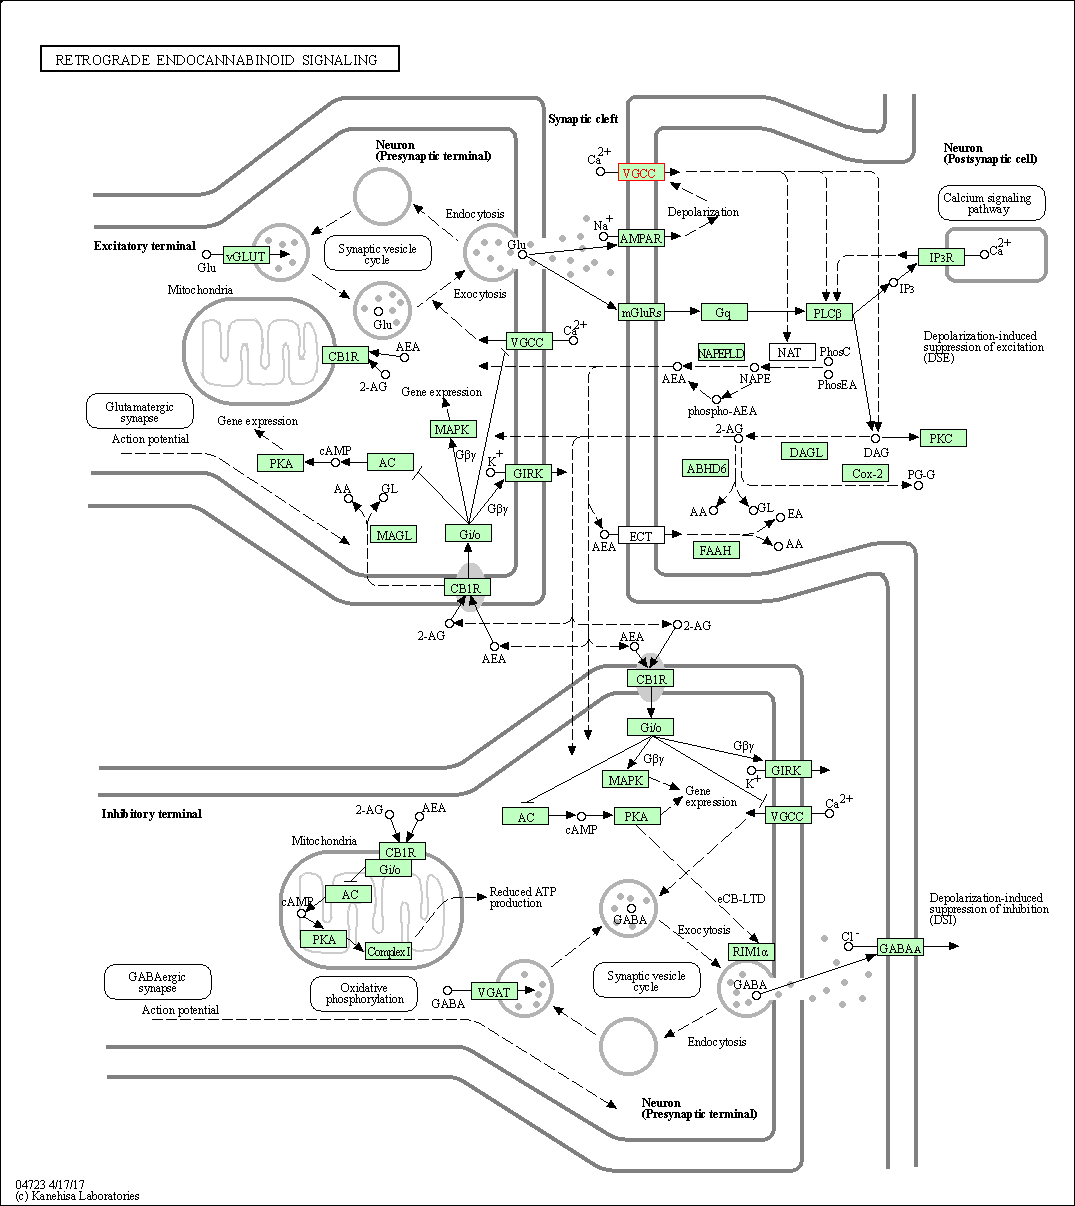
of target is determined by the life-essential pathways provided on KEGG database. The target-affiliated pathways were defined based on the following two criteria (a) the pathways of the studied target should be life-essential for both healthy individuals and patients, and (b) the studied target should occupy an upstream position in the pathways and therefore had the ability to regulate biological function.
Targets involved in a fewer pathways have greater likelihood to be successfully developed, while those associated with more human pathways increase the chance of undesirable interferences with other human processes
(Pharmacol Rev, 58: 259-279, 2006).
Biological Network Descriptors
of target is determined based on a human protein-protein interactions (PPI) network consisting of 9,309 proteins and 52,713 PPIs, which were with a high confidence score of ≥ 0.95 collected from STRING database.
The network properties of targets based on protein-protein interactions (PPIs) have been widely adopted for the assessment of target’s druggability. Proteins with high node degree tend to have a high impact on network function through multiple interactions, while proteins with high betweenness centrality are regarded to be central for communication in interaction networks and regulate the flow of signaling information
(Front Pharmacol, 9, 1245, 2018;
Curr Opin Struct Biol. 44:134-142, 2017).
Human Similarity Proteins
Human Tissue Distribution
Human Pathway Affiliation
Biological Network Descriptors
|
|
| Protein Name | Pfam ID | Percentage of Identity (%) | E value |
|---|---|---|---|
| Polycystin-2 (PKD2) | 22.481 (58/258) | 2.09E-04 |
|
Note:
If a protein has TS (tissue specficity) scores at least in one tissue >= 2.5, this protein is called tissue-enriched (including tissue-enriched-but-not-specific and tissue-specific). In the plots, the vertical lines are at thresholds 2.5 and 4.
|
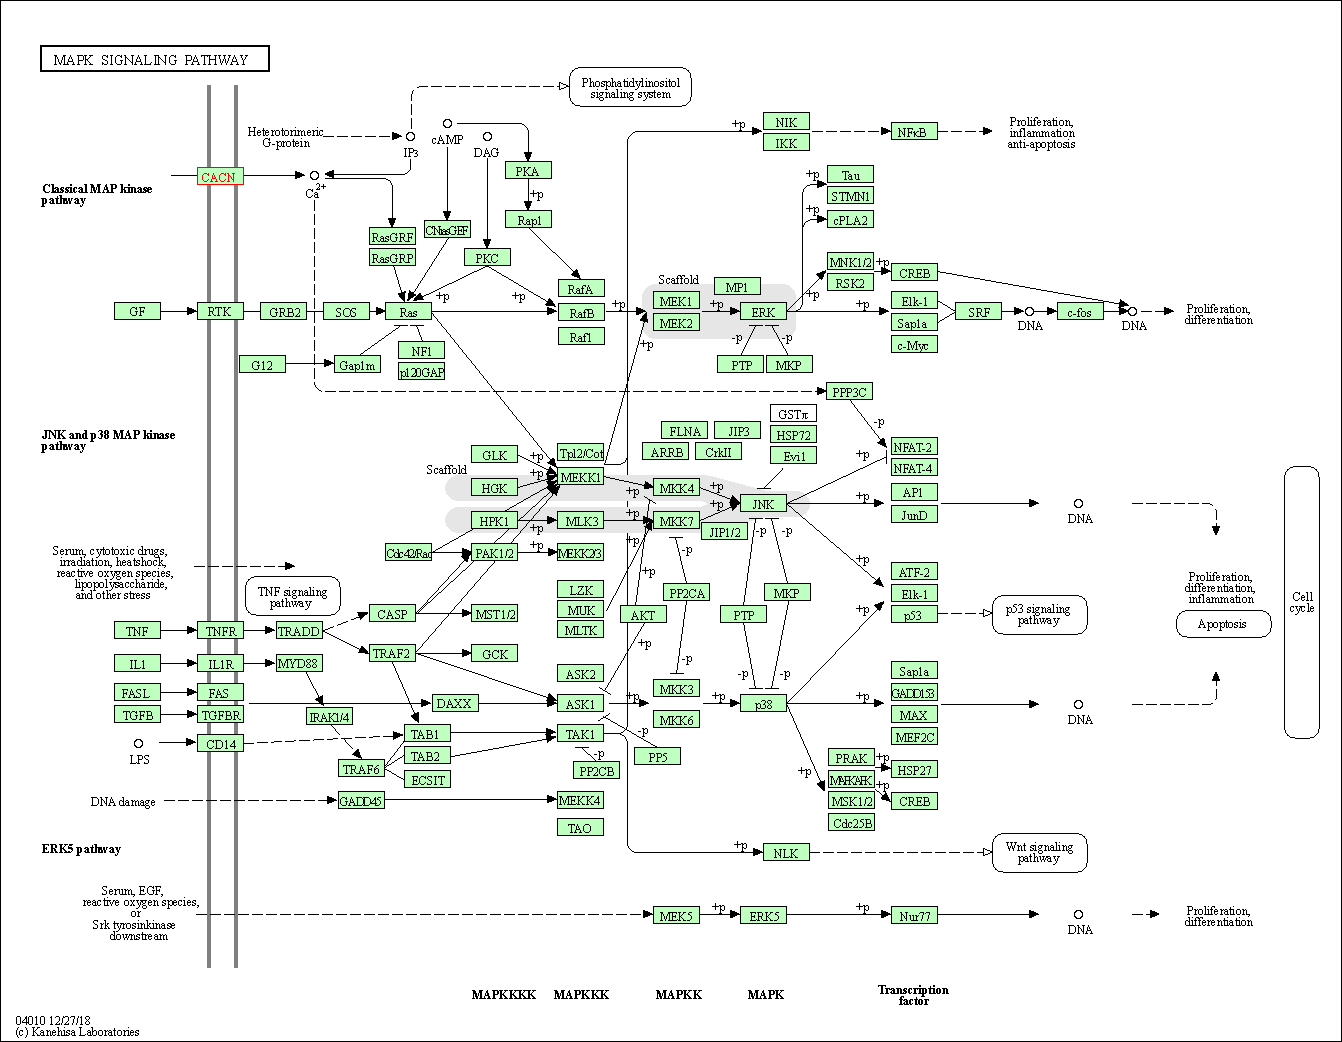
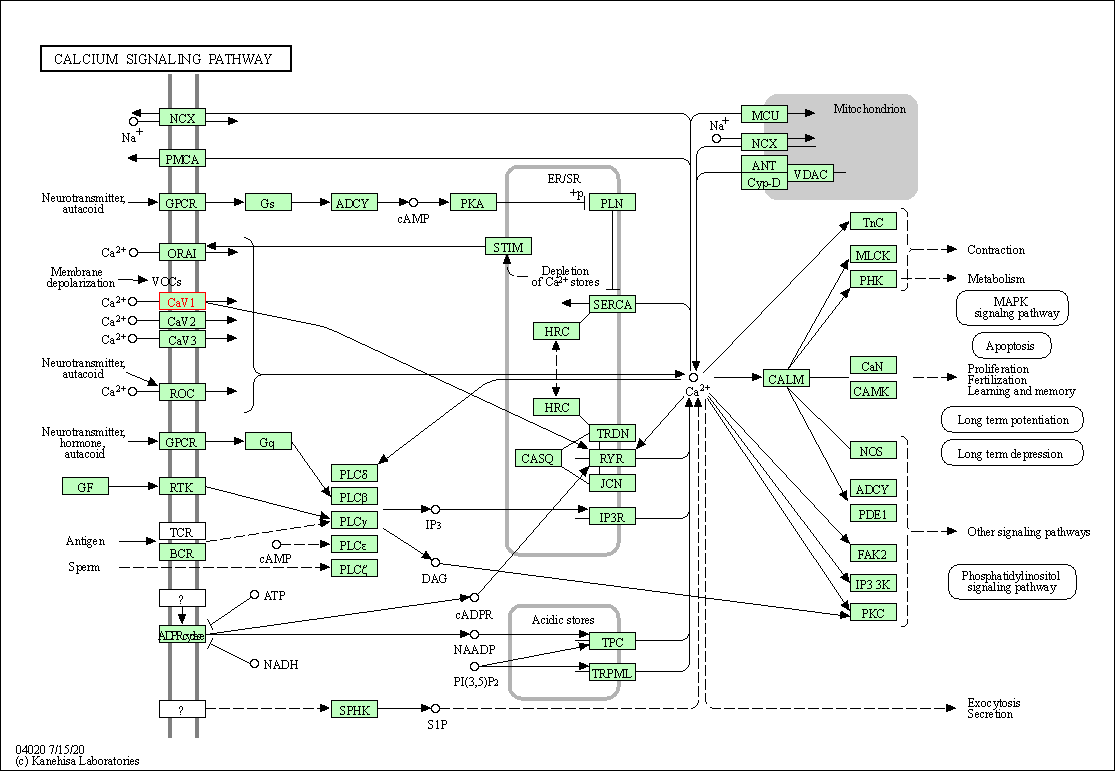
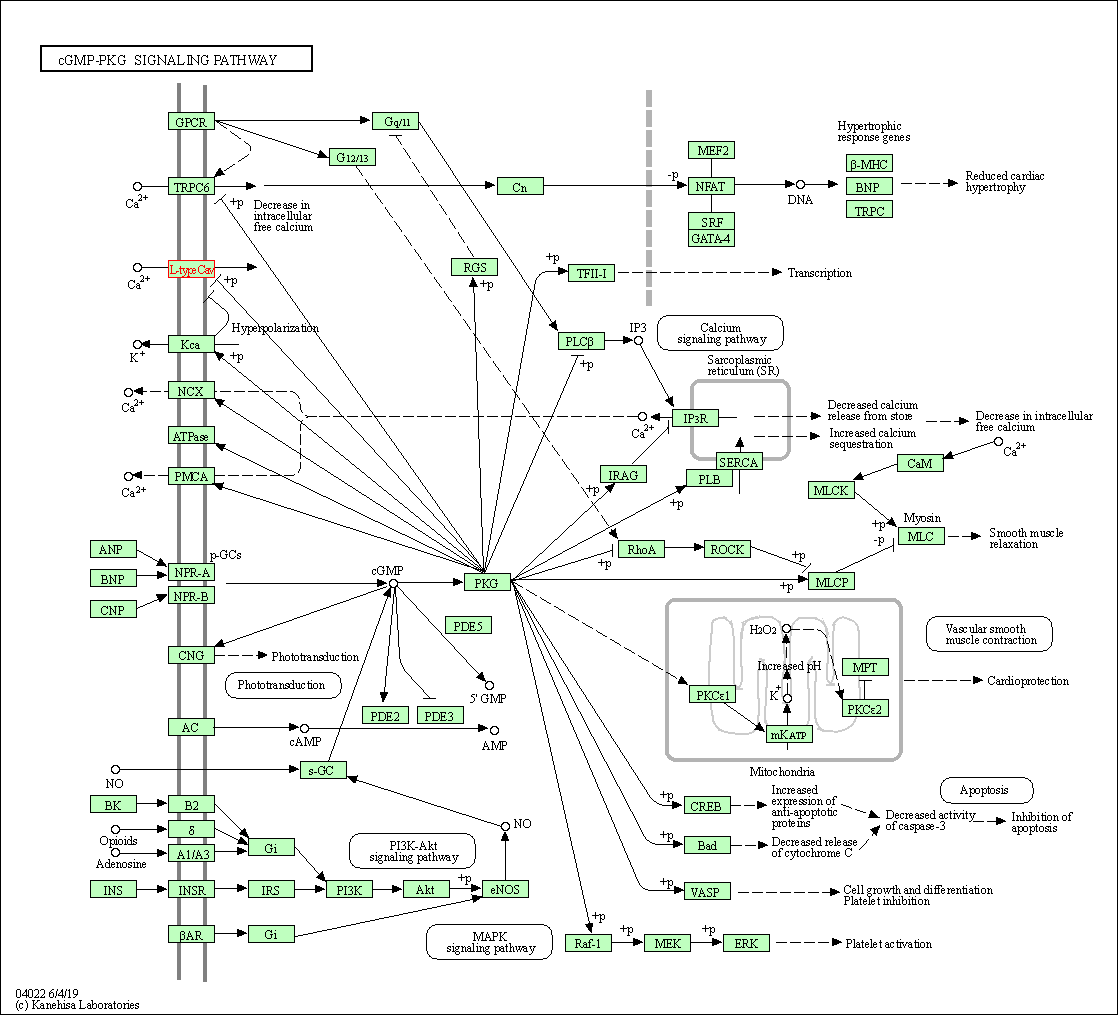
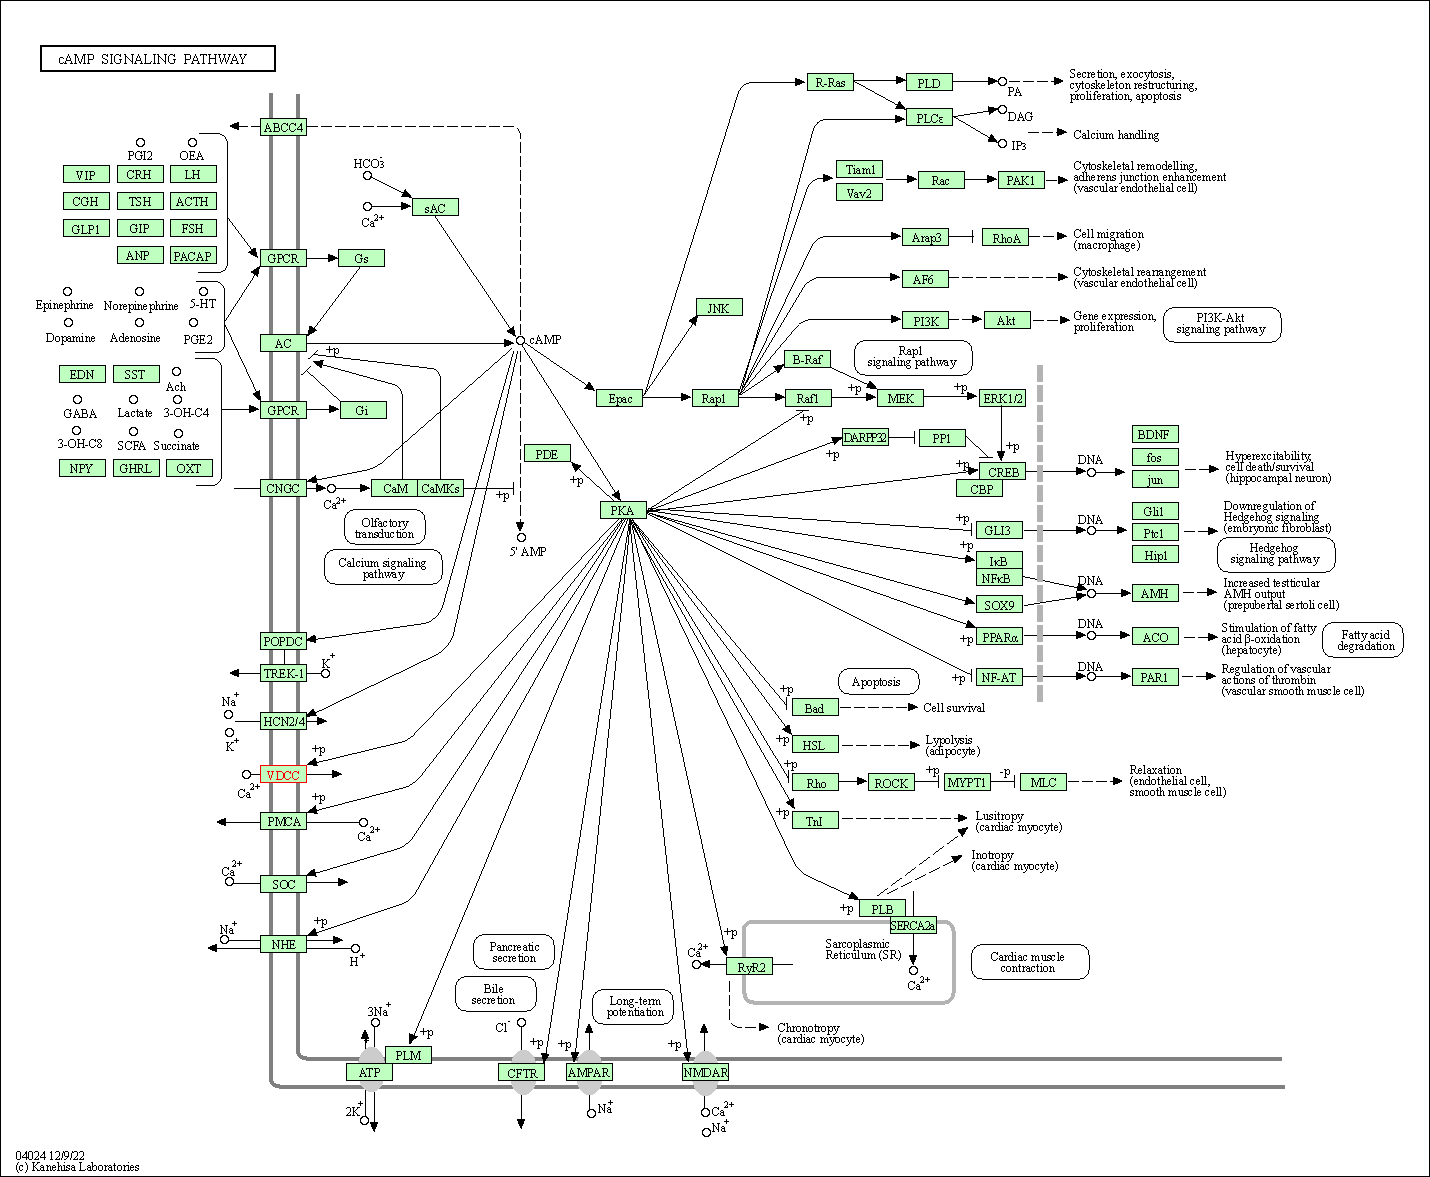
| KEGG Pathway | Pathway ID | Affiliated Target | Pathway Map |
|---|---|---|---|
| MAPK signaling pathway | hsa04010 | Affiliated Target |

|
| Class: Environmental Information Processing => Signal transduction | Pathway Hierarchy | ||
| Calcium signaling pathway | hsa04020 | Affiliated Target |

|
| Class: Environmental Information Processing => Signal transduction | Pathway Hierarchy | ||
| cGMP-PKG signaling pathway | hsa04022 | Affiliated Target |

|
| Class: Environmental Information Processing => Signal transduction | Pathway Hierarchy | ||
| cAMP signaling pathway | hsa04024 | Affiliated Target |

|
| Class: Environmental Information Processing => Signal transduction | Pathway Hierarchy | ||
| Cardiac muscle contraction | hsa04260 | Affiliated Target |

|
| Class: Organismal Systems => Circulatory system | Pathway Hierarchy | ||
| Adrenergic signaling in cardiomyocytes | hsa04261 | Affiliated Target |

|
| Class: Organismal Systems => Circulatory system | Pathway Hierarchy | ||
| Vascular smooth muscle contraction | hsa04270 | Affiliated Target |

|
| Class: Organismal Systems => Circulatory system | Pathway Hierarchy | ||
| Retrograde endocannabinoid signaling | hsa04723 | Affiliated Target |

|
| Class: Organismal Systems => Nervous system | Pathway Hierarchy | ||
| Cholinergic synapse | hsa04725 | Affiliated Target |

|
| Class: Organismal Systems => Nervous system | Pathway Hierarchy | ||
| Serotonergic synapse | hsa04726 | Affiliated Target |

|
| Class: Organismal Systems => Nervous system | Pathway Hierarchy | ||
| GABAergic synapse | hsa04727 | Affiliated Target |

|
| Class: Organismal Systems => Nervous system | Pathway Hierarchy | ||
| Insulin secretion | hsa04911 | Affiliated Target |

|
| Class: Organismal Systems => Endocrine system | Pathway Hierarchy | ||
| GnRH signaling pathway | hsa04912 | Affiliated Target |

|
| Class: Organismal Systems => Endocrine system | Pathway Hierarchy | ||
| Oxytocin signaling pathway | hsa04921 | Affiliated Target |

|
| Class: Organismal Systems => Endocrine system | Pathway Hierarchy | ||
| Renin secretion | hsa04924 | Affiliated Target |

|
| Class: Organismal Systems => Endocrine system | Pathway Hierarchy | ||
| Aldosterone synthesis and secretion | hsa04925 | Affiliated Target |

|
| Class: Organismal Systems => Endocrine system | Pathway Hierarchy | ||
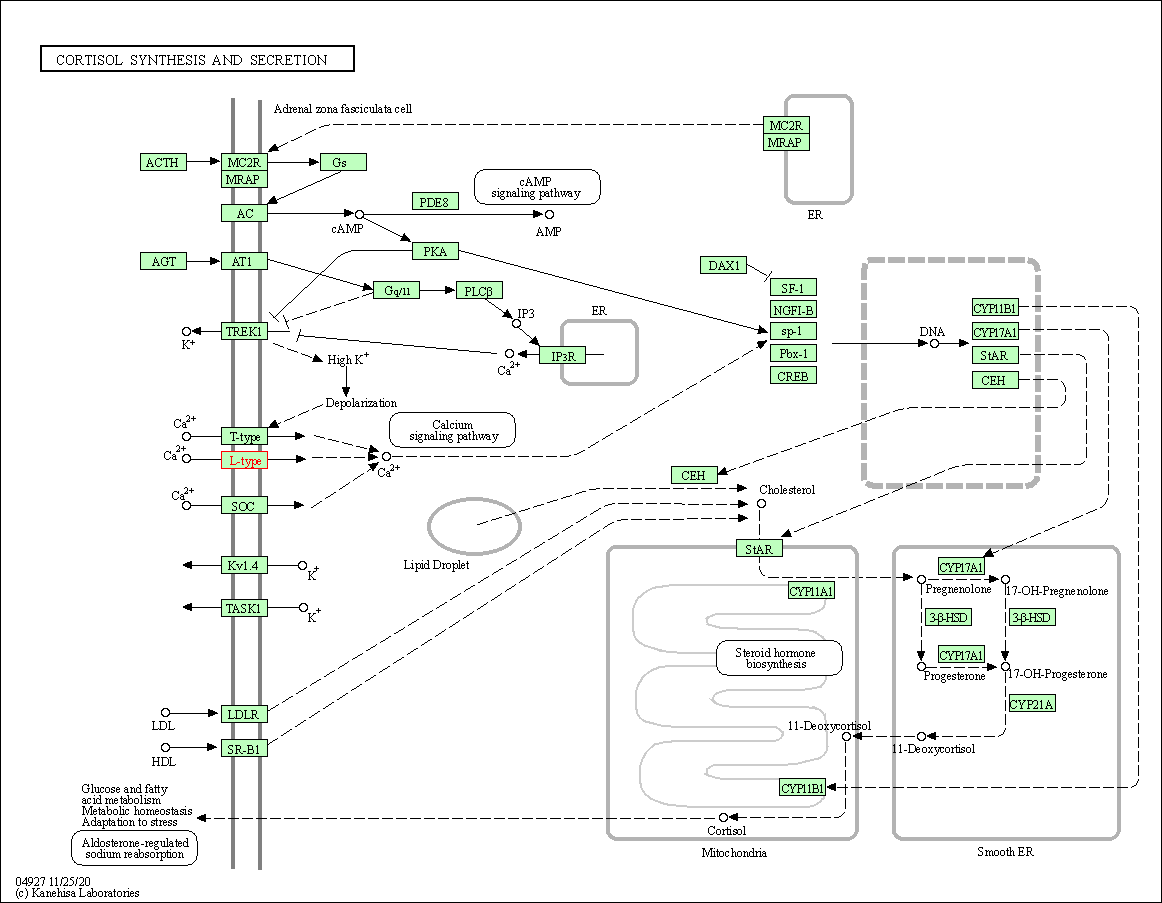
| Cortisol synthesis and secretion | hsa04927 | Affiliated Target |

|
| Class: Organismal Systems => Endocrine system | Pathway Hierarchy | ||
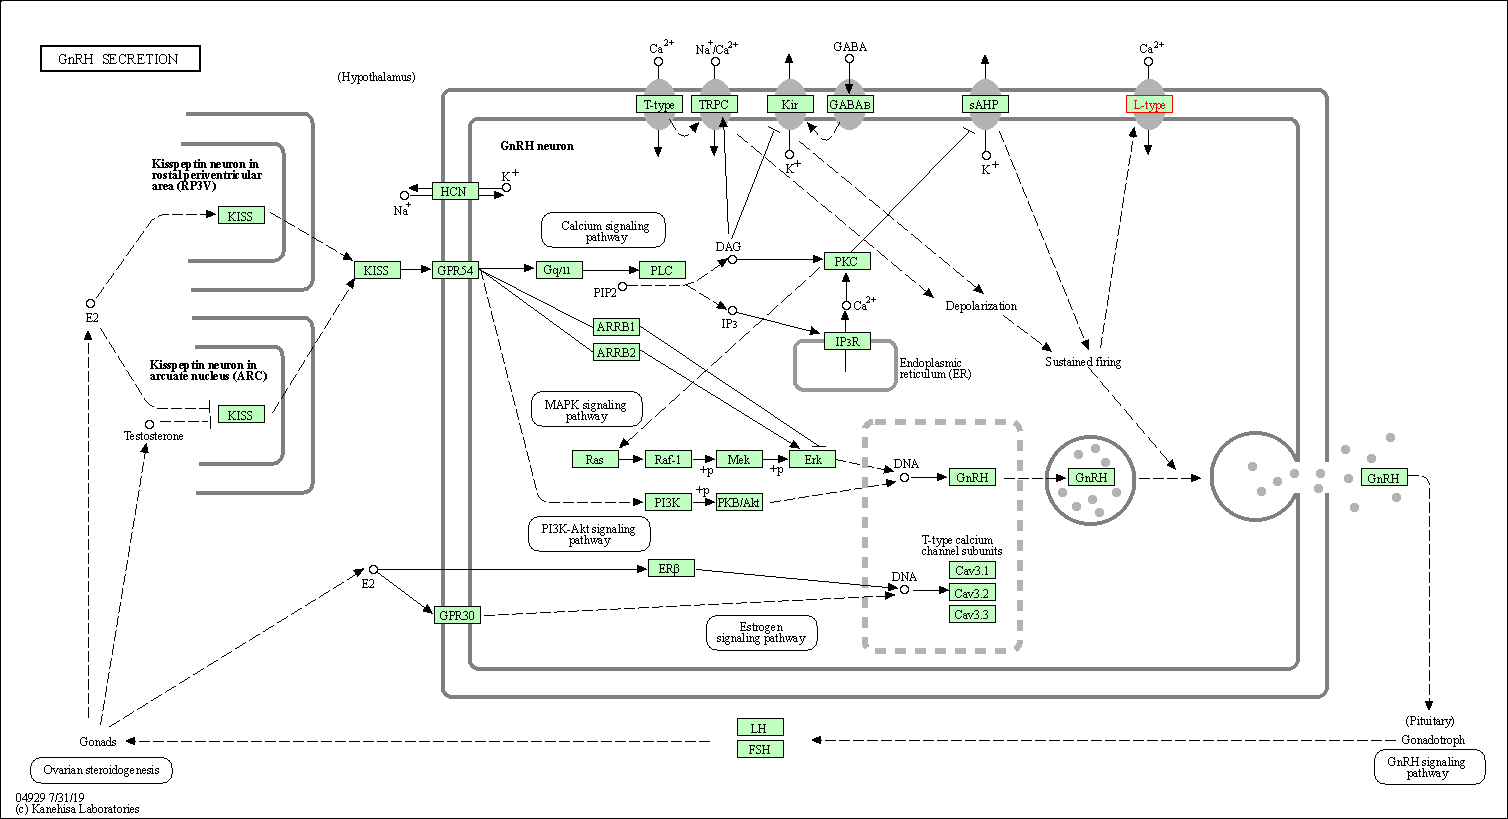
| GnRH secretion | hsa04929 | Affiliated Target |

|
| Class: Organismal Systems => Endocrine system | Pathway Hierarchy | ||
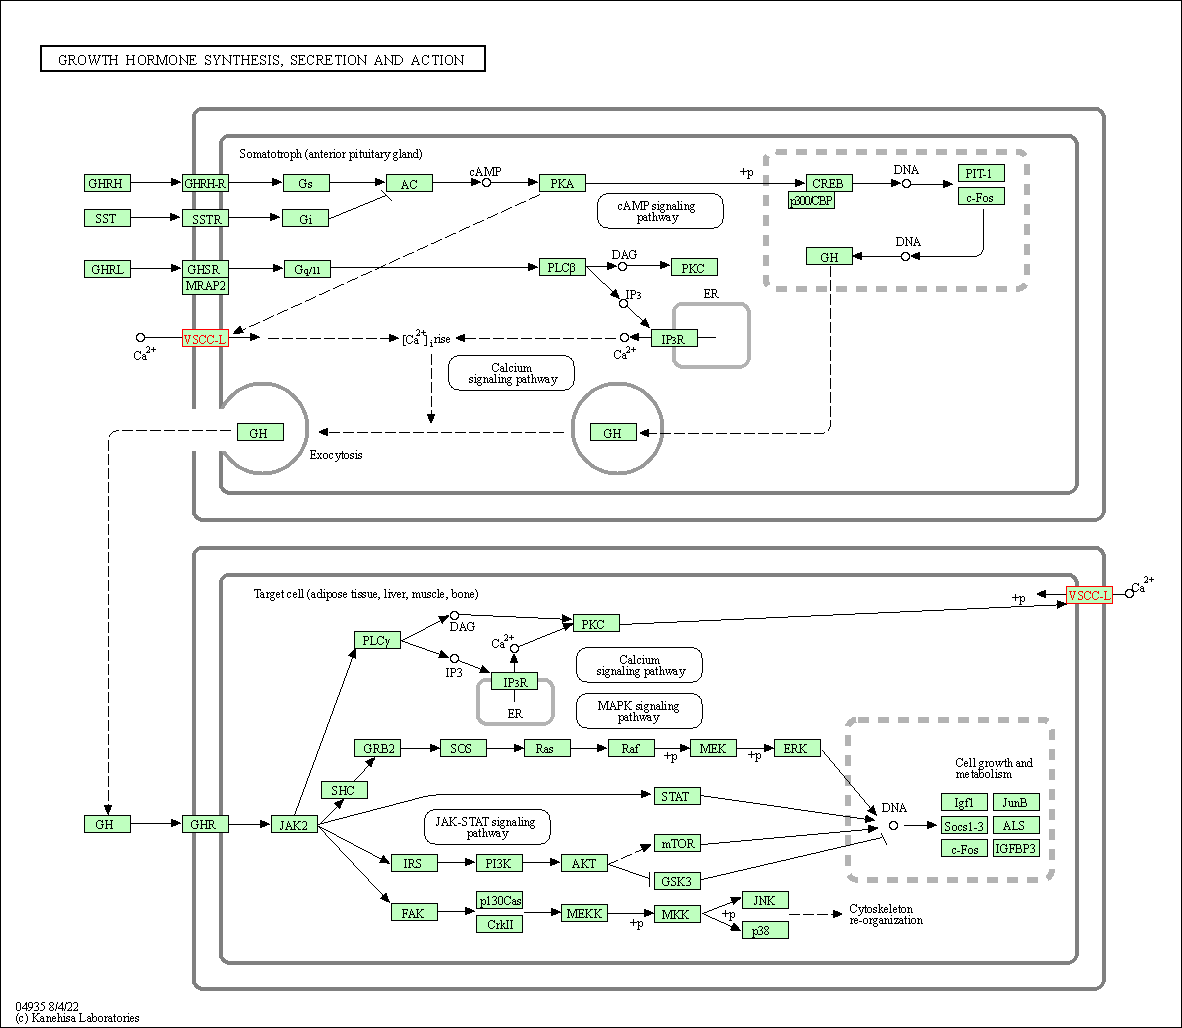
| Growth hormone synthesis, secretion and action | hsa04935 | Affiliated Target |

|
| Class: Organismal Systems => Endocrine system | Pathway Hierarchy | ||
| Click to Show/Hide the Information of Affiliated Human Pathways | |||
| Degree | 10 | Degree centrality | 1.07E-03 | Betweenness centrality | 5.82E-05 |
|---|---|---|---|---|---|
| Closeness centrality | 1.62E-01 | Radiality | 1.24E+01 | Clustering coefficient | 4.22E-01 |
| Neighborhood connectivity | 8.30E+00 | Topological coefficient | 2.77E-01 | Eccentricity | 13 |
| Download | Click to Download the Full PPI Network of This Target | ||||
| Chemical Structure based Activity Landscape of Target | Top |
|---|---|
| Drug Property Profile of Target | Top | |
|---|---|---|
| (1) Molecular Weight (mw) based Drug Clustering | (2) Octanol/Water Partition Coefficient (xlogp) based Drug Clustering | |
|
|
||
| (3) Hydrogen Bond Donor Count (hbonddonor) based Drug Clustering | (4) Hydrogen Bond Acceptor Count (hbondacc) based Drug Clustering | |
|
|
||
| (5) Rotatable Bond Count (rotbonds) based Drug Clustering | (6) Topological Polar Surface Area (polararea) based Drug Clustering | |
|
|
||
| "RO5" indicates the cutoff set by lipinski's rule of five; "D123AB" colored in GREEN denotes the no violation of any cutoff in lipinski's rule of five; "D123AB" colored in PURPLE refers to the violation of only one cutoff in lipinski's rule of five; "D123AB" colored in BLACK represents the violation of more than one cutoffs in lipinski's rule of five | ||
| References | Top | |||||
|---|---|---|---|---|---|---|
| REF 1 | URL: http://www.guidetopharmacology.org Nucleic Acids Res. 2015 Oct 12. pii: gkv1037. The IUPHAR/BPS Guide to PHARMACOLOGY in 2016: towards curated quantitative interactions between 1300 protein targets and 6000 ligands. (Target id: 528). | |||||
| REF 2 | High-affinity binding of DTZ323, a novel derivative of diltiazem, to rabbit skeletal muscle L-type Ca++ channels. J Pharmacol Exp Ther. 1997 Apr;281(1):173-9. | |||||
| REF 3 | Biochemical characterization of plasma membrane isolated from human skeletal muscle. FEBS Lett. 1985 Sep 2;188(2):222-6. | |||||
| REF 4 | (-)-[3H]Desmethoxyverapamil, a novel Ca2+ channel probe. Binding characteristics and target size analysis of its receptor in skeletal muscle. FEBS Lett. 1984 Oct 29;176(2):371-7. | |||||
If You Find Any Error in Data or Bug in Web Service, Please Kindly Report It to Dr. Zhou and Dr. Zhang.

