Target Information
Target General Information | Top | |||||
---|---|---|---|---|---|---|
Target ID |
T77594
(Former ID: TTDI02087)
|
|||||
Target Name |
Endoplasmic reticulum chaperone BiP (HSPA5)
|
|||||
Synonyms |
Immunoglobulin heavy chainbinding protein; Immunoglobulin heavy chain-binding protein; Heat shock protein family A member 5; Heat shock protein 70 family protein 5; Heat shock 70 kDa protein 5; HSP70 family protein 5; GRP78; GRP-78; Endoplasmic reticulum lumenal Ca(2+)binding protein grp78; Binding-immunoglobulin protein; BiP; 78 kDa glucose-regulated protein
Click to Show/Hide
|
|||||
Gene Name |
HSPA5
|
|||||
Target Type |
Clinical trial target
|
[1] | ||||
Disease | [+] 2 Target-related Diseases | + | ||||
1 | Melanoma [ICD-11: 2C30] | |||||
2 | Solid tumour/cancer [ICD-11: 2A00-2F9Z] | |||||
Function |
Involved in the correct folding of proteins and degradation of misfolded proteins via its interaction with DNAJC10/ERdj5, probably to facilitate the release of DNAJC10/ERdj5 from its substrate. Acts as a key repressor of the ERN1/IRE1-mediated unfolded protein response (UPR). In the unstressed endoplasmic reticulum, recruited by DNAJB9/ERdj4 to the luminal region of ERN1/IRE1, leading to disrupt the dimerization of ERN1/IRE1, thereby inactivating ERN1/IRE1. Accumulation of misfolded protein in the endoplasmic reticulum causes release of HSPA5/BiP from ERN1/IRE1, allowing homodimerization and subsequent activation of ERN1/IRE1. Plays an auxiliary role in post-translational transport of small presecretory proteins across endoplasmic reticulum (ER). May function as an allosteric modulator for SEC61 channel-forming translocon complex, likely cooperating with SEC62 to enable the productive insertion of these precursors into SEC61 channel. Appears to specifically regulate translocation of precursors having inhibitory residues in their mature region that weaken channel gating. Endoplasmic reticulum chaperone that plays a key role in protein folding and quality control in the endoplasmic reticulum lumen.
Click to Show/Hide
|
|||||
BioChemical Class |
Acid anhydride hydrolase
|
|||||
UniProt ID | ||||||
EC Number |
EC 3.6.4.10
|
|||||
Sequence |
MKLSLVAAMLLLLSAARAEEEDKKEDVGTVVGIDLGTTYSCVGVFKNGRVEIIANDQGNR
ITPSYVAFTPEGERLIGDAAKNQLTSNPENTVFDAKRLIGRTWNDPSVQQDIKFLPFKVV EKKTKPYIQVDIGGGQTKTFAPEEISAMVLTKMKETAEAYLGKKVTHAVVTVPAYFNDAQ RQATKDAGTIAGLNVMRIINEPTAAAIAYGLDKREGEKNILVFDLGGGTFDVSLLTIDNG VFEVVATNGDTHLGGEDFDQRVMEHFIKLYKKKTGKDVRKDNRAVQKLRREVEKAKRALS SQHQARIEIESFYEGEDFSETLTRAKFEELNMDLFRSTMKPVQKVLEDSDLKKSDIDEIV LVGGSTRIPKIQQLVKEFFNGKEPSRGINPDEAVAYGAAVQAGVLSGDQDTGDLVLLDVC PLTLGIETVGGVMTKLIPRNTVVPTKKSQIFSTASDNQPTVTIKVYEGERPLTKDNHLLG TFDLTGIPPAPRGVPQIEVTFEIDVNGILRVTAEDKGTGNKNKITITNDQNRLTPEEIER MVNDAEKFAEEDKKLKERIDTRNELESYAYSLKNQIGDKEKLGGKLSSEDKETMEKAVEE KIEWLESHQDADIEDFKAKKKELEEIVQPIISKLYGSAGPPPTGEEDTAEKDEL Click to Show/Hide
|
|||||
3D Structure | Click to Show 3D Structure of This Target | PDB | ||||
ADReCS ID | BADD_A01759 ; BADD_A04698 | |||||
HIT2.0 ID | T54SZZ |
Drugs and Modes of Action | Top | |||||
---|---|---|---|---|---|---|
Clinical Trial Drug(s) | [+] 3 Clinical Trial Drugs | + | ||||
1 | IT-139 | Drug Info | Phase 1 | Solid tumour/cancer | [2] | |
2 | NKP-1339 | Drug Info | Phase 1 | Solid tumour/cancer | [3] | |
3 | SAM-6 | Drug Info | Phase 1 | Melanoma | [4] | |
Mode of Action | [+] 1 Modes of Action | + | ||||
Inhibitor | [+] 2 Inhibitor drugs | + | ||||
1 | IT-139 | Drug Info | [1] | |||
2 | NKP-1339 | Drug Info | [1] |
Cell-based Target Expression Variations | Top | |||||
---|---|---|---|---|---|---|
Cell-based Target Expression Variations |
Drug Binding Sites of Target | Top | |||||||||||||||||||||||||||||||||||||||||||||||||||||||||||||||||||||||||||||||||||
---|---|---|---|---|---|---|---|---|---|---|---|---|---|---|---|---|---|---|---|---|---|---|---|---|---|---|---|---|---|---|---|---|---|---|---|---|---|---|---|---|---|---|---|---|---|---|---|---|---|---|---|---|---|---|---|---|---|---|---|---|---|---|---|---|---|---|---|---|---|---|---|---|---|---|---|---|---|---|---|---|---|---|---|---|
Ligand Name: Adenosine triphosphate | Ligand Info | |||||||||||||||||||||||||||||||||||||||||||||||||||||||||||||||||||||||||||||||||||
Structure Description | BiP-ATP2 | PDB:6ASY | ||||||||||||||||||||||||||||||||||||||||||||||||||||||||||||||||||||||||||||||||||
Method | X-ray diffraction | Resolution | 1.85 Å | Mutation | No | [6] | ||||||||||||||||||||||||||||||||||||||||||||||||||||||||||||||||||||||||||||||
PDB Sequence |
SEDVGTVVGI
33 DLGTTYSCVG43 VFKNGRVEII53 ANDQGNRITP63 SYVAFTPEGE73 RLIGDAAKNQ 83 LTSNPENTVF93 DAKRLIGRTW103 NDPSVQQDIK113 FLPFKVVEKK123 TKPYIQVDIG 133 GGQTKTFAPE143 EISAMVLTKM153 KETAEAYLGK163 KVTHAVVTVP173 AYFNDAQRQA 183 TKDAGTIAGL193 NVMRIINEPT203 AAAIAYGLDK213 REGEKNILVF223 DLGGGTFDVS 233 LLTIDNGVFE243 VVATNGDTHL253 GGEDFDQRVM263 EHFIKLYKKK273 TGKDVRKDNR 283 AVQKLRREVE293 KAKRALSSQH303 QARIEIESFY313 EGEDFSETLT323 RAKFEELNMD 333 LFRSTMKPVQ343 KVLEDSDLKK353 SDIDEIVLVG363 GSTRIPKIQQ373 LVKEFFNGKE 383 PSRGINPDEA393 VAYGAAVQAG403 VLSGDQDTGD413 LVLLDVCPLT423 LGIETVGGVM 433 TKLIPRNTVV443 PTKKSQIFSV453 GGTVTIKVYE463 GERPLTKDNH473 LLGTFDLTGI 483 PPAPRGVPQI493 EVTFEIDVNG503 ILRVTAEDKG513 TGNKNKITIT523 NDQNRLTPEE 533 IERMVNDAEK543 FAEEDKKLKE553 RIDTRNELES563 YAYSLKNQIG573 DKEKLGGKLS 583 SEDKETMEKA593 VEEKIEWLES603 HQDADIEDFK613 AKKKELEEIV623 QPIISK |
|||||||||||||||||||||||||||||||||||||||||||||||||||||||||||||||||||||||||||||||||||
☰6ASY Nodes: OProtein ▢Nucleotide ◇Chemical ▢Biopolymer Lines: Interactions at 4 Å Dynamically generated for selected residues. Nodes can be dragged or clicked. Label: Selection: Name:
PDB ID: Option 1, search with your selection (all residues are selected by default) in the loaded structures: Option 2, search with PDB ID and chain name: PDB ID: Chain Name: Option 3, search with a PDB file: Foldseek web server. 1. your selection (all residues are selected by default) in the loaded structures to 2 (Optional). Once you see the structure neighbors, you can view the alignment in iCn3D by inputing a list of PDB chain IDs or AlphaFold UniProt IDs below. The PDB chain IDs are the same as the record names such as "1HHO_A". The UniProt ID is the text between "AF-" and "-F1". For example, the UniProt ID for the record name "AF-P69905-F1-model_v4" is "P69905". Chain ID List: BCIF/MMTF ID: PDB ID: Very high (pLDDT > 90) Confident (90 > pLDDT > 70) Low (70 > pLDDT > 50) Very low (pLDDT < 50) AlphaFold Uniprot ID: PAE Map: NCBI Protein Accession: PDB File: Multiple PDB Files: The custom JSON file on residue colors has the following format for proteins("ALA" and "ARG") and nucleotides("G" and "A"): {"ALA":"#C8C8C8", "ARG":"#145AFF", ..., "G":"#008000", "A":"#6080FF", ...} Residue Color File: The custom file for the structure has two columns separated by space or tab: residue number, and score in the range of 0-100. If you click "Apply Custom Color" button, the scores 0, 50 and 100 correspond to the three colors specified below. If you click "Apply Custom Tube", the selected residues will be displayed in a style similar to "B-factor Tube". Custom File: 1. Score to Color: 0: 50: 100: or 2. You can define your own reference numbers in a custom file using Excel, and then export it as a CSV file. An example file is shown below with cells separated by commas. refnum,11,12,,21,22,,10C,11C,20CThe first row defines the reference residue numbers, which could be any strings. The 1st cell could be anything. The rest cells are reference residue numbers (e.g., 11, 21, 10C, etc.) or empty cells. Each chain has a separate row. The first cell of the second row is the chain ID "1TUP_A". The rest cells are the corresponding real residue numbers for reference residue numbers in the first row. For example, the reference numbers for residues 100, 101, and 132 in the chain 1TUP_A are 11, 12, and 22, respectively. The fourth row shows another set of reference numners for the chain "1TUP_C". It could be a chain from a different structure. To select all residues corresponding to the reference numbers, you can simplay replace ":" with "%" in the Specification. For example, "%12" selects the residue 101 in 1TUP_A and the residue 111 in 1TUP_B. ".A%12" has the chain "A" filter and selects the residue 101 in 1TUP_A. Custom File: ID1: ID2: VAST+ based on VAST: VAST+ based on TM-align: All chains will be aligned to the first chain in the comma-separated chain IDs. Each chain ID has the form of PDBID_chain (e.g., 1HHO_A, case sensitive) or UniprotID (e.g., P69905 for AlphaFold structures). Chain IDs: (Note: To align chains in custom PDB files, you could load them in "File > Open File > PDB Files (appendable)" and click "Analysis > Defined Sets". Finally select multiple chains in Defined Sets and click "File > Realign Selection".) All chains will be aligned to the first chain in the comma-separated chain IDs. Each chain ID has the form of PDBID_chain (e.g., 1HHO_A, case sensitive) or UniprotID (e.g., P69905 for AlphaFold structures). Chain IDs: The sequence alignment (followed by structure alignment) is based on residue numbers in the First/Master chain: (Note: To align chains in custom PDB files, you could load them in "File > Open File > PDB Files (appendable)" and click "Analysis > Defined Sets". Finally select multiple chains in Defined Sets and click "File > Realign Selection".) All chains will be aligned to the first chain in the comma-separated chain IDs. Each chain ID has the form of PDBID_chain (e.g., 1HHO_A, case sensitive) or UniprotID (e.g., P69905 for AlphaFold structures). Chain IDs: Each alignment is defined as " | "-separated residue lists in one line. "10-50" means a range of residues from 10 to 50. Option 1: Option 2: All chains will be aligned to the first chain in the comma-separated chain IDs. Each chain ID has the form of PDBID_chain (e.g., 1HHO_A, case sensitive) or UniprotID (e.g., P69905 for AlphaFold structures). Chain IDs: Each alignment is defined as " | "-separated residue lists in one line. "10-50" means a range of residues from 10 to 50. Please specify the mutations with a comma separated mutation list. Each mutation can be specified as "[uppercase PDB ID or AlphaFold UniProt ID]_[Chain Name]_[Residue Number]_[One Letter Mutant Residue]". E.g., the mutation of N501Y in the E chain of PDB 6M0J can be specified as "6M0J_E_501_Y". For AlphaFold structures, the "Chain ID" is "A". If you load a custom structure without PDB or UniProt ID, you can open "Seq. & Annotations" window and find the chain ID such as "stru_A". The part before the underscore is the structure ID, which can be used to specify the mutation such as "stru_A_...". Remember to choose "Show Mutation in: Current Page". Mutations: ID Type: PDB IDAlphaFold UniProt ID Show Mutation in: Current PageNew Page Mol2 File: SDF File: XYZ File: URL in the same host: Multiple mmCIF Files: mmCIF ID: Note: The "biological unit" is the biochemically active form of a biomolecule, or Note: The "biological unit" is the biochemically active form of a biomolecule, BLAST search with the protein sequence ID or FASTA sequence as input. If the protein accession is not a PDB chain, the corresponding AlphaFold UniProt structure is used. Enter a protein sequence ID (or FASTA sequence) and the aligned protein accession, which can be found using the Protein Sequence ID(NCBI protein accession of a sequence): or FASTA sequence: Aligned Protein Accession (or a chain of a PDB): ESM Metagenomic Atlas. The sequence should be less than 400 characters. For any sequence longer than 400, please see the discussion here. The sequence to structure prediction is done via FASTA sequence: Protein/Gene name: PubChem CID/Name/InchI: Chemical SMILES: Share Link URL: Collection File: Structures: 2fofc contour at default threshold or at: σ fofc contour at default threshold or at: σ 2fofc contour at default threshold or at: σ URL in the same host: fofc contour at default threshold or at: σ URL in the same host: Custom Color: Grid Size: Salt Concentration: M Potential contour at: kT/e(25.6mV at 298K) Note: Only the selected residues are used for DelPhi potential calculation by solving linear Poisson-Boltzmann equation. Grid Size: Salt Concentration: M Surface with max potential at: kT/e(25.6mV at 298K) Surface: Opacity: Wireframe: Note: Only the selected residues are used for DelPhi potential calculation by solving linear Poisson-Boltzmann equation. Potential contour at: kT/e(25.6mV at 298K) Note: Always load a PDB file before loading a PQR or DelPhi potential file. Potential contour at: kT/e(25.6mV at 298K) Grid Size: Salt Concentration: M PQR URL in the same host: Phi URL in the same host: Cube URL in the same host: Note: Always load a PDB file before loading a PQR or DelPhi potential file. Symmetry: Distance: Contact Type:
4. Sort Interactions on: to show two lines of residue nodes to show map with atom details to show interactions with strength parameters in 0-200:
(Note: you can also adjust thresholds at #1 to add/remove interactions.) 5. and select new sets 1. Select sets below or use your current selection: 2. 1. Select sets below or use your current selection. 2. 1. Select sets below or use your current selection: 2. Overall maximum RMSD: Å 3. 1. Select sets below: 2. 1. Select sets below: 2. 1. Select sets below: 2. 1. Select sets below: 2. Hold Ctrl key to select multiple nodes/lines. Green: H-Bonds; Cyan: Salt Bridge/Ionic; Grey: Contacts Magenta: Halogen Bonds; Red: π-Cation; Blue: π-Stacking Scale: Hold Ctrl key to select multiple nodes. Scale: Note: Nodes/Residues can be dragged. Both nodes and dashed lines/interactions can be clicked to select residues. Color legend for interactions (dashed lines): Green: H-Bonds; Cyan: Salt Bridge/Ionic; Grey: Contacts Magenta: Halogen Bonds; Red: π-Cation; Blue: π-Stacking Scale: Hold Ctrl key to select multiple nodes. Scale: Hold Ctrl key to select multiple nodes. Scale:
Contour at: σ Contour at: σ Contour at: % of maximum EM values 1. Select the first set: 2. Sphere with a radius: Å 3. Select the second set to apply the sphere: 4. the sphere around the first set of atoms interacting/contacting residue pairs in a file 1. Extracellular membrane Z-axis position: Å 2. intracellular membrane Z-axis position: Å 3. the adjusted membranes 1. Z-axis position of the first X-Y plane: Å 2. Z-axis position of the second X-Y plane: Å 3. the region between the planes to Defined Sets 2. Size: 3. Color: 4. Pick TWO atoms while holding "Alt" key 5. 2. Size: 3. Color: 4. 1. Pick TWO atoms while holding "Alt" key 2. Line Color: 3. 1. Pick TWO atoms while holding "Alt" key 2. Color: 3. 1. Select two sets
3. 1. Select two sets
2. Line style: 3. Line radius: 4. Color: 5. Opacity: 6. 1. Select a set: 2. Shape: 3. Radius: 4. Color: 5. Opacity: 6. 1. Select sets for pairwise distances
Note: Each set is represented by a vector, which is the X-axis of the principle axes. The angles between the vectors are then calculated. 1. Select sets for pairwise angles
1. Pick TWO atoms while holding "Alt" key 2. Coil Radius: (for coils, default 0.3) Stick Radius: (for sticks, default 0.4) Cross-Linkage Radius: (for cross-linkages, default 0.4) Trace Radius: (for C alpha trace, O3' trace, default 0.4) Ribbon Thickness: (for helix and sheet ribbons, nucleotide ribbons, default 0.2) Protein Ribbon Width: (for helix and sheet ribbons, default 1.3) Nucleotide Ribbon Width: (for nucleotide ribbons, default 0.8) Ball Scale: (for styles 'Ball and Stick' and 'Dot', default 0.3) 1. Shininess: (for the shininess of the 3D objects, default 40) 2. Three directional lights: Key Light: (for the light strength of the key light, default 0.8) Fill Light: (for the light strength of the fill light, default 0.4) Back Light: (for the light strength of the back light, default 0.2) 3. Thickness: Line Radius: (for stabilizers, hydrogen bonds, distance lines, default 0.1) Coil Radius: (for coils, default 0.3) Stick Radius: (for sticks, default 0.4) Cross-Linkage Radius: (for cross-linkages, default 0.4) Trace Radius: (for C alpha trace, O3' trace, default 0.4) Ribbon Thickness: (for helix and sheet ribbons, nucleotide ribbons, default 0.2) Protein Ribbon Width: (for helix and sheet ribbons, default 1.3) Nucleotide Ribbon Width: (for nucleotide ribbons, default 0.8) Ball Scale: (for styles 'Ball and Stick' and 'Dot', default 0.3) 4. Show Glycan Cartoon: (0: hide, 1: show, default 0) 5. Show Membrane: (0: hide, 1: show, default 1) 6. Enlarge Command Window: (0: Regular, 1: Large, default 0) 1. URLs Used in Browsers Please copy one of the URLs below. They show the same result. (To add a title to share link, click "Windows > Your Note" and click "File > Share Link" again.) Original URL with commands: Lifelong Short URL:(To replace this URL, send a pull request to update share.html at iCn3D GitHub) Lifelong Short URL + Window Title:(To update the window title, click "Analysis > Your Note/Window Title".) 2. Commands Used in Jupyter Noteboook Please copy the following commands into a cell in Jupyter Notebook to show the same result. More details are at https://github.com/ncbi/icn3d/tree/master/jupyternotebook. Annotations:
Zoom: mouse wheel; Move: left button; Select Multiple Nodes: Ctrl Key and drag an Area Force on Nodes: Label Size: Internal Edges: Color each residue based on the percentage of solvent accessilbe surface area. The color ranges from blue, to white, to red for a percentage of 0, 35(variable), and 100, respectively. Middle Percentage(White): % Select residue based on the percentage of solvent accessilbe surface area. The values are in the range of 0-100. Min Percentage: % Max Percentage: % Select residue based on B-factor/pLDDT. The values are in the range of 0-100. Min B-factor/pLDDT: % Max B-factor/pLDDT: % X: Y: Z: Vector 2, X: Y: Z: The angle is: degree. 1: 5: 9: 13: 2: 6: 10: 14: 3: 7: 11: 15: Choose an Ig template for selected residues: Choose an Ig template to align with selected residues: |
ASP34
3.915
LEU35
4.540
GLY36
3.326
THR37
2.660
THR38
3.028
TYR39
3.242
LYS96
2.736
GLU201
2.871
ASP224
4.765
GLY226
3.366
GLY227
2.734
GLY228
3.040
THR229
2.803
GLY255
3.388
|
|||||||||||||||||||||||||||||||||||||||||||||||||||||||||||||||||||||||||||||||||||
Click to View More Binding Site Information of This Target and Ligand Pair | ||||||||||||||||||||||||||||||||||||||||||||||||||||||||||||||||||||||||||||||||||||
Ligand Name: Adenosine monophosphate | Ligand Info | |||||||||||||||||||||||||||||||||||||||||||||||||||||||||||||||||||||||||||||||||||
Structure Description | A novel and unique ATP hydrolysis to AMP by a human Hsp70 BiP | PDB:7N1R | ||||||||||||||||||||||||||||||||||||||||||||||||||||||||||||||||||||||||||||||||||
Method | X-ray diffraction | Resolution | 2.03 Å | Mutation | No | [7] | ||||||||||||||||||||||||||||||||||||||||||||||||||||||||||||||||||||||||||||||
PDB Sequence |
SEDVGTVVGI
33 DLGTTYSCVG43 VFKNGRVEII53 ANDQGNRITP63 SYVAFTPEGE73 RLIGDAAKNQ 83 LTSNPENTVF93 DAKRLIGRTW103 NDPSVQQDIK113 FLPFKVVEKK123 TKPYIQVDIG 133 GGQTKTFAPE143 EISAMVLTKM153 KETAEAYLGK163 KVTHAVVTVP173 AYFNDAQRQA 183 TKDAGTIAGL193 NVMRIINEPT203 AAAIAYGLDK213 REGEKNILVF223 DLGGGTFDVS 233 LLTIDNGVFE243 VVATNGDTHL253 GGEDFDQRVM263 EHFIKLYKKK273 TGKDVRKDNR 283 AVQKLRREVE293 KAKRALSSQH303 QARIEIESFY313 EGEDFSETLT323 RAKFEELNMD 333 LFRSTMKPVQ343 KVLEDSDLKK353 SDIDEIVLVG363 GSTRIPKIQQ373 LVKEFFNGKE 383 PSRGINPDEA393 VAYGAAVQAG403 VLSGDQDTGD413 LVLLDVCPLT423 LGIETVGGVM 433 TKLIPRNTVV443 PTKKSQIFSV453 GGTVTIKVYE463 GERPLTKDNH473 LLGTFDLTGI 483 PPAPRGVPQI493 EVTFEIDVNG503 ILRVTAEDKG513 TGNKNKITIT523 NDQNRLTPEE 533 IERMVNDAEK543 FAEEDKKLKE553 RIDTRNELES563 YAYSLKNQIG573 DKEKLGGKLS 583 SEDKETMEKA593 VEEKIEWLES603 HQDADIEDFK613 AKKKELEEIV623 QPIISK |
|||||||||||||||||||||||||||||||||||||||||||||||||||||||||||||||||||||||||||||||||||
☰7N1R Nodes: OProtein ▢Nucleotide ◇Chemical ▢Biopolymer Lines: Interactions at 4 Å Dynamically generated for selected residues. Nodes can be dragged or clicked. Label: Selection: Name:
PDB ID: Option 1, search with your selection (all residues are selected by default) in the loaded structures: Option 2, search with PDB ID and chain name: PDB ID: Chain Name: Option 3, search with a PDB file: Foldseek web server. 1. your selection (all residues are selected by default) in the loaded structures to 2 (Optional). Once you see the structure neighbors, you can view the alignment in iCn3D by inputing a list of PDB chain IDs or AlphaFold UniProt IDs below. The PDB chain IDs are the same as the record names such as "1HHO_A". The UniProt ID is the text between "AF-" and "-F1". For example, the UniProt ID for the record name "AF-P69905-F1-model_v4" is "P69905". Chain ID List: BCIF/MMTF ID: PDB ID: Very high (pLDDT > 90) Confident (90 > pLDDT > 70) Low (70 > pLDDT > 50) Very low (pLDDT < 50) AlphaFold Uniprot ID: PAE Map: NCBI Protein Accession: PDB File: Multiple PDB Files: The custom JSON file on residue colors has the following format for proteins("ALA" and "ARG") and nucleotides("G" and "A"): {"ALA":"#C8C8C8", "ARG":"#145AFF", ..., "G":"#008000", "A":"#6080FF", ...} Residue Color File: The custom file for the structure has two columns separated by space or tab: residue number, and score in the range of 0-100. If you click "Apply Custom Color" button, the scores 0, 50 and 100 correspond to the three colors specified below. If you click "Apply Custom Tube", the selected residues will be displayed in a style similar to "B-factor Tube". Custom File: 1. Score to Color: 0: 50: 100: or 2. You can define your own reference numbers in a custom file using Excel, and then export it as a CSV file. An example file is shown below with cells separated by commas. refnum,11,12,,21,22,,10C,11C,20CThe first row defines the reference residue numbers, which could be any strings. The 1st cell could be anything. The rest cells are reference residue numbers (e.g., 11, 21, 10C, etc.) or empty cells. Each chain has a separate row. The first cell of the second row is the chain ID "1TUP_A". The rest cells are the corresponding real residue numbers for reference residue numbers in the first row. For example, the reference numbers for residues 100, 101, and 132 in the chain 1TUP_A are 11, 12, and 22, respectively. The fourth row shows another set of reference numners for the chain "1TUP_C". It could be a chain from a different structure. To select all residues corresponding to the reference numbers, you can simplay replace ":" with "%" in the Specification. For example, "%12" selects the residue 101 in 1TUP_A and the residue 111 in 1TUP_B. ".A%12" has the chain "A" filter and selects the residue 101 in 1TUP_A. Custom File: ID1: ID2: VAST+ based on VAST: VAST+ based on TM-align: All chains will be aligned to the first chain in the comma-separated chain IDs. Each chain ID has the form of PDBID_chain (e.g., 1HHO_A, case sensitive) or UniprotID (e.g., P69905 for AlphaFold structures). Chain IDs: (Note: To align chains in custom PDB files, you could load them in "File > Open File > PDB Files (appendable)" and click "Analysis > Defined Sets". Finally select multiple chains in Defined Sets and click "File > Realign Selection".) All chains will be aligned to the first chain in the comma-separated chain IDs. Each chain ID has the form of PDBID_chain (e.g., 1HHO_A, case sensitive) or UniprotID (e.g., P69905 for AlphaFold structures). Chain IDs: The sequence alignment (followed by structure alignment) is based on residue numbers in the First/Master chain: (Note: To align chains in custom PDB files, you could load them in "File > Open File > PDB Files (appendable)" and click "Analysis > Defined Sets". Finally select multiple chains in Defined Sets and click "File > Realign Selection".) All chains will be aligned to the first chain in the comma-separated chain IDs. Each chain ID has the form of PDBID_chain (e.g., 1HHO_A, case sensitive) or UniprotID (e.g., P69905 for AlphaFold structures). Chain IDs: Each alignment is defined as " | "-separated residue lists in one line. "10-50" means a range of residues from 10 to 50. Option 1: Option 2: All chains will be aligned to the first chain in the comma-separated chain IDs. Each chain ID has the form of PDBID_chain (e.g., 1HHO_A, case sensitive) or UniprotID (e.g., P69905 for AlphaFold structures). Chain IDs: Each alignment is defined as " | "-separated residue lists in one line. "10-50" means a range of residues from 10 to 50. Please specify the mutations with a comma separated mutation list. Each mutation can be specified as "[uppercase PDB ID or AlphaFold UniProt ID]_[Chain Name]_[Residue Number]_[One Letter Mutant Residue]". E.g., the mutation of N501Y in the E chain of PDB 6M0J can be specified as "6M0J_E_501_Y". For AlphaFold structures, the "Chain ID" is "A". If you load a custom structure without PDB or UniProt ID, you can open "Seq. & Annotations" window and find the chain ID such as "stru_A". The part before the underscore is the structure ID, which can be used to specify the mutation such as "stru_A_...". Remember to choose "Show Mutation in: Current Page". Mutations: ID Type: PDB IDAlphaFold UniProt ID Show Mutation in: Current PageNew Page Mol2 File: SDF File: XYZ File: URL in the same host: Multiple mmCIF Files: mmCIF ID: Note: The "biological unit" is the biochemically active form of a biomolecule, or Note: The "biological unit" is the biochemically active form of a biomolecule, BLAST search with the protein sequence ID or FASTA sequence as input. If the protein accession is not a PDB chain, the corresponding AlphaFold UniProt structure is used. Enter a protein sequence ID (or FASTA sequence) and the aligned protein accession, which can be found using the Protein Sequence ID(NCBI protein accession of a sequence): or FASTA sequence: Aligned Protein Accession (or a chain of a PDB): ESM Metagenomic Atlas. The sequence should be less than 400 characters. For any sequence longer than 400, please see the discussion here. The sequence to structure prediction is done via FASTA sequence: Protein/Gene name: PubChem CID/Name/InchI: Chemical SMILES: Share Link URL: Collection File: Structures: 2fofc contour at default threshold or at: σ fofc contour at default threshold or at: σ 2fofc contour at default threshold or at: σ URL in the same host: fofc contour at default threshold or at: σ URL in the same host: Custom Color: Grid Size: Salt Concentration: M Potential contour at: kT/e(25.6mV at 298K) Note: Only the selected residues are used for DelPhi potential calculation by solving linear Poisson-Boltzmann equation. Grid Size: Salt Concentration: M Surface with max potential at: kT/e(25.6mV at 298K) Surface: Opacity: Wireframe: Note: Only the selected residues are used for DelPhi potential calculation by solving linear Poisson-Boltzmann equation. Potential contour at: kT/e(25.6mV at 298K) Note: Always load a PDB file before loading a PQR or DelPhi potential file. Potential contour at: kT/e(25.6mV at 298K) Grid Size: Salt Concentration: M PQR URL in the same host: Phi URL in the same host: Cube URL in the same host: Note: Always load a PDB file before loading a PQR or DelPhi potential file. Symmetry: Distance: Contact Type:
4. Sort Interactions on: to show two lines of residue nodes to show map with atom details to show interactions with strength parameters in 0-200:
(Note: you can also adjust thresholds at #1 to add/remove interactions.) 5. and select new sets 1. Select sets below or use your current selection: 2. 1. Select sets below or use your current selection. 2. 1. Select sets below or use your current selection: 2. Overall maximum RMSD: Å 3. 1. Select sets below: 2. 1. Select sets below: 2. 1. Select sets below: 2. 1. Select sets below: 2. Hold Ctrl key to select multiple nodes/lines. Green: H-Bonds; Cyan: Salt Bridge/Ionic; Grey: Contacts Magenta: Halogen Bonds; Red: π-Cation; Blue: π-Stacking Scale: Hold Ctrl key to select multiple nodes. Scale: Note: Nodes/Residues can be dragged. Both nodes and dashed lines/interactions can be clicked to select residues. Color legend for interactions (dashed lines): Green: H-Bonds; Cyan: Salt Bridge/Ionic; Grey: Contacts Magenta: Halogen Bonds; Red: π-Cation; Blue: π-Stacking Scale: Hold Ctrl key to select multiple nodes. Scale: Hold Ctrl key to select multiple nodes. Scale:
Contour at: σ Contour at: σ Contour at: % of maximum EM values 1. Select the first set: 2. Sphere with a radius: Å 3. Select the second set to apply the sphere: 4. the sphere around the first set of atoms interacting/contacting residue pairs in a file 1. Extracellular membrane Z-axis position: Å 2. intracellular membrane Z-axis position: Å 3. the adjusted membranes 1. Z-axis position of the first X-Y plane: Å 2. Z-axis position of the second X-Y plane: Å 3. the region between the planes to Defined Sets 2. Size: 3. Color: 4. Pick TWO atoms while holding "Alt" key 5. 2. Size: 3. Color: 4. 1. Pick TWO atoms while holding "Alt" key 2. Line Color: 3. 1. Pick TWO atoms while holding "Alt" key 2. Color: 3. 1. Select two sets
3. 1. Select two sets
2. Line style: 3. Line radius: 4. Color: 5. Opacity: 6. 1. Select a set: 2. Shape: 3. Radius: 4. Color: 5. Opacity: 6. 1. Select sets for pairwise distances
Note: Each set is represented by a vector, which is the X-axis of the principle axes. The angles between the vectors are then calculated. 1. Select sets for pairwise angles
1. Pick TWO atoms while holding "Alt" key 2. Coil Radius: (for coils, default 0.3) Stick Radius: (for sticks, default 0.4) Cross-Linkage Radius: (for cross-linkages, default 0.4) Trace Radius: (for C alpha trace, O3' trace, default 0.4) Ribbon Thickness: (for helix and sheet ribbons, nucleotide ribbons, default 0.2) Protein Ribbon Width: (for helix and sheet ribbons, default 1.3) Nucleotide Ribbon Width: (for nucleotide ribbons, default 0.8) Ball Scale: (for styles 'Ball and Stick' and 'Dot', default 0.3) 1. Shininess: (for the shininess of the 3D objects, default 40) 2. Three directional lights: Key Light: (for the light strength of the key light, default 0.8) Fill Light: (for the light strength of the fill light, default 0.4) Back Light: (for the light strength of the back light, default 0.2) 3. Thickness: Line Radius: (for stabilizers, hydrogen bonds, distance lines, default 0.1) Coil Radius: (for coils, default 0.3) Stick Radius: (for sticks, default 0.4) Cross-Linkage Radius: (for cross-linkages, default 0.4) Trace Radius: (for C alpha trace, O3' trace, default 0.4) Ribbon Thickness: (for helix and sheet ribbons, nucleotide ribbons, default 0.2) Protein Ribbon Width: (for helix and sheet ribbons, default 1.3) Nucleotide Ribbon Width: (for nucleotide ribbons, default 0.8) Ball Scale: (for styles 'Ball and Stick' and 'Dot', default 0.3) 4. Show Glycan Cartoon: (0: hide, 1: show, default 0) 5. Show Membrane: (0: hide, 1: show, default 1) 6. Enlarge Command Window: (0: Regular, 1: Large, default 0) 1. URLs Used in Browsers Please copy one of the URLs below. They show the same result. (To add a title to share link, click "Windows > Your Note" and click "File > Share Link" again.) Original URL with commands: Lifelong Short URL:(To replace this URL, send a pull request to update share.html at iCn3D GitHub) Lifelong Short URL + Window Title:(To update the window title, click "Analysis > Your Note/Window Title".) 2. Commands Used in Jupyter Noteboook Please copy the following commands into a cell in Jupyter Notebook to show the same result. More details are at https://github.com/ncbi/icn3d/tree/master/jupyternotebook. Annotations:
Zoom: mouse wheel; Move: left button; Select Multiple Nodes: Ctrl Key and drag an Area Force on Nodes: Label Size: Internal Edges: Color each residue based on the percentage of solvent accessilbe surface area. The color ranges from blue, to white, to red for a percentage of 0, 35(variable), and 100, respectively. Middle Percentage(White): % Select residue based on the percentage of solvent accessilbe surface area. The values are in the range of 0-100. Min Percentage: % Max Percentage: % Select residue based on B-factor/pLDDT. The values are in the range of 0-100. Min B-factor/pLDDT: % Max B-factor/pLDDT: % X: Y: Z: Vector 2, X: Y: Z: The angle is: degree. 1: 5: 9: 13: 2: 6: 10: 14: 3: 7: 11: 15: Choose an Ig template for selected residues: Choose an Ig template to align with selected residues: |
||||||||||||||||||||||||||||||||||||||||||||||||||||||||||||||||||||||||||||||||||||
Click to View More Binding Site Information of This Target with Different Ligands |
Different Human System Profiles of Target | Top |
---|---|
Human Similarity Proteins
of target is determined by comparing the sequence similarity of all human proteins with the target based on BLAST. The similarity proteins for a target are defined as the proteins with E-value < 0.005 and outside the protein families of the target.
A target that has fewer human similarity proteins outside its family is commonly regarded to possess a greater capacity to avoid undesired interactions and thus increase the possibility of finding successful drugs
(Brief Bioinform, 21: 649-662, 2020).
Human Tissue Distribution
of target is determined from a proteomics study that quantified more than 12,000 genes across 32 normal human tissues. Tissue Specificity (TS) score was used to define the enrichment of target across tissues.
The distribution of targets among different tissues or organs need to be taken into consideration when assessing the target druggability, as it is generally accepted that the wider the target distribution, the greater the concern over potential adverse effects
(Nat Rev Drug Discov, 20: 64-81, 2021).
Human Pathway Affiliation
of target is determined by the life-essential pathways provided on KEGG database. The target-affiliated pathways were defined based on the following two criteria (a) the pathways of the studied target should be life-essential for both healthy individuals and patients, and (b) the studied target should occupy an upstream position in the pathways and therefore had the ability to regulate biological function.
Targets involved in a fewer pathways have greater likelihood to be successfully developed, while those associated with more human pathways increase the chance of undesirable interferences with other human processes
(Pharmacol Rev, 58: 259-279, 2006).
Biological Network Descriptors
of target is determined based on a human protein-protein interactions (PPI) network consisting of 9,309 proteins and 52,713 PPIs, which were with a high confidence score of ≥ 0.95 collected from STRING database.
The network properties of targets based on protein-protein interactions (PPIs) have been widely adopted for the assessment of target’s druggability. Proteins with high node degree tend to have a high impact on network function through multiple interactions, while proteins with high betweenness centrality are regarded to be central for communication in interaction networks and regulate the flow of signaling information
(Front Pharmacol, 9, 1245, 2018;
Curr Opin Struct Biol. 44:134-142, 2017).
Human Similarity Proteins
Human Tissue Distribution
Human Pathway Affiliation
Biological Network Descriptors
|
Protein Name | Pfam ID | Percentage of Identity (%) | E value |
---|---|---|---|
Ankyrin repeat domain-containing protein 45 (ANKRD45) | 40.000 (30/75) | 4.49E-09 |
Note:
If a protein has TS (tissue specficity) scores at least in one tissue >= 2.5, this protein is called tissue-enriched (including tissue-enriched-but-not-specific and tissue-specific). In the plots, the vertical lines are at thresholds 2.5 and 4.
|
KEGG Pathway | Pathway ID | Affiliated Target | Pathway Map |
---|---|---|---|
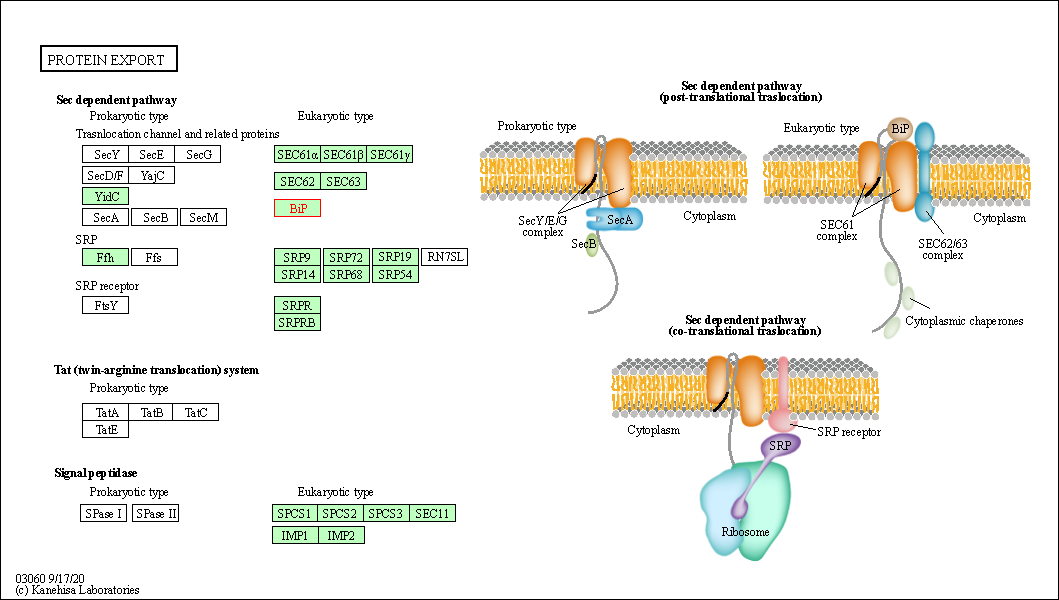
Protein export | hsa03060 | Affiliated Target |
|
Class: Genetic Information Processing => Folding, sorting and degradation | Pathway Hierarchy | ||
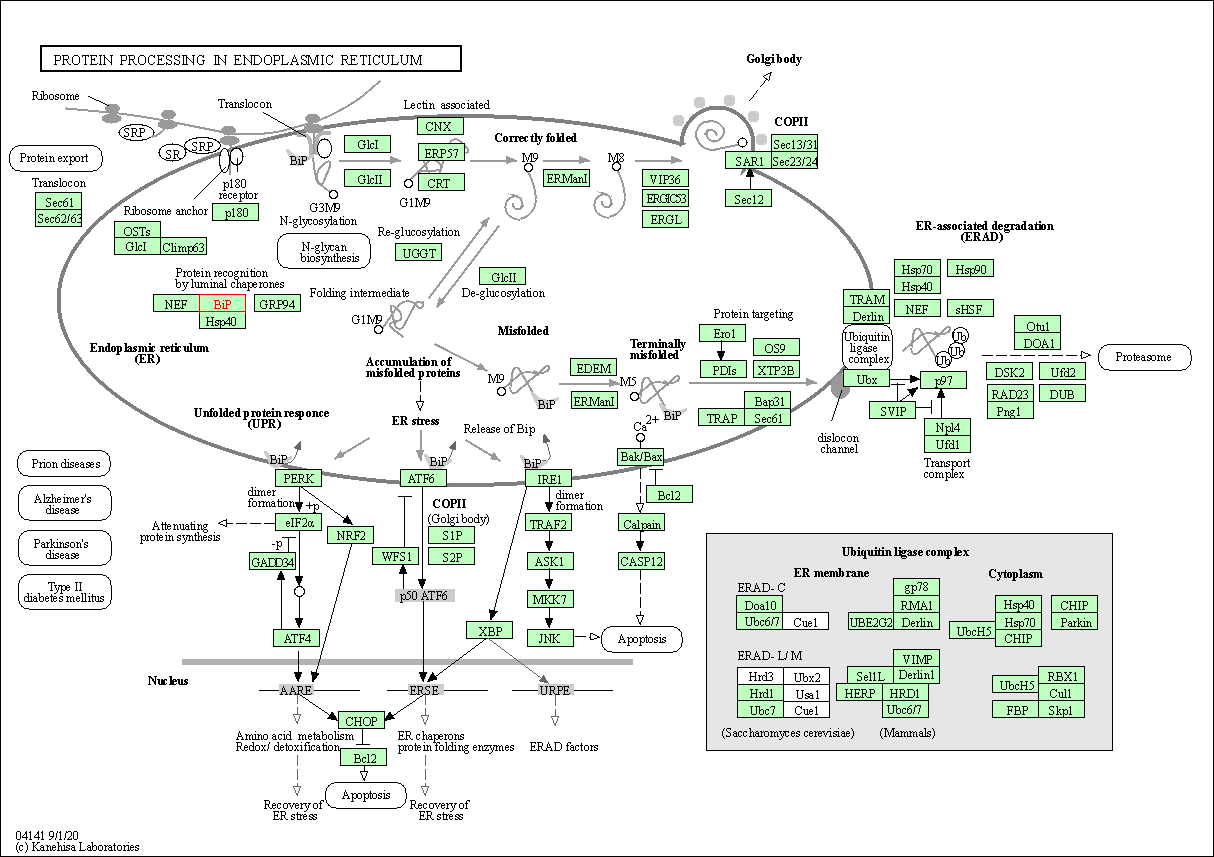
Protein processing in endoplasmic reticulum | hsa04141 | Affiliated Target |
|
Class: Genetic Information Processing => Folding, sorting and degradation | Pathway Hierarchy | ||
Antigen processing and presentation | hsa04612 | Affiliated Target |
|
Class: Organismal Systems => Immune system | Pathway Hierarchy | ||
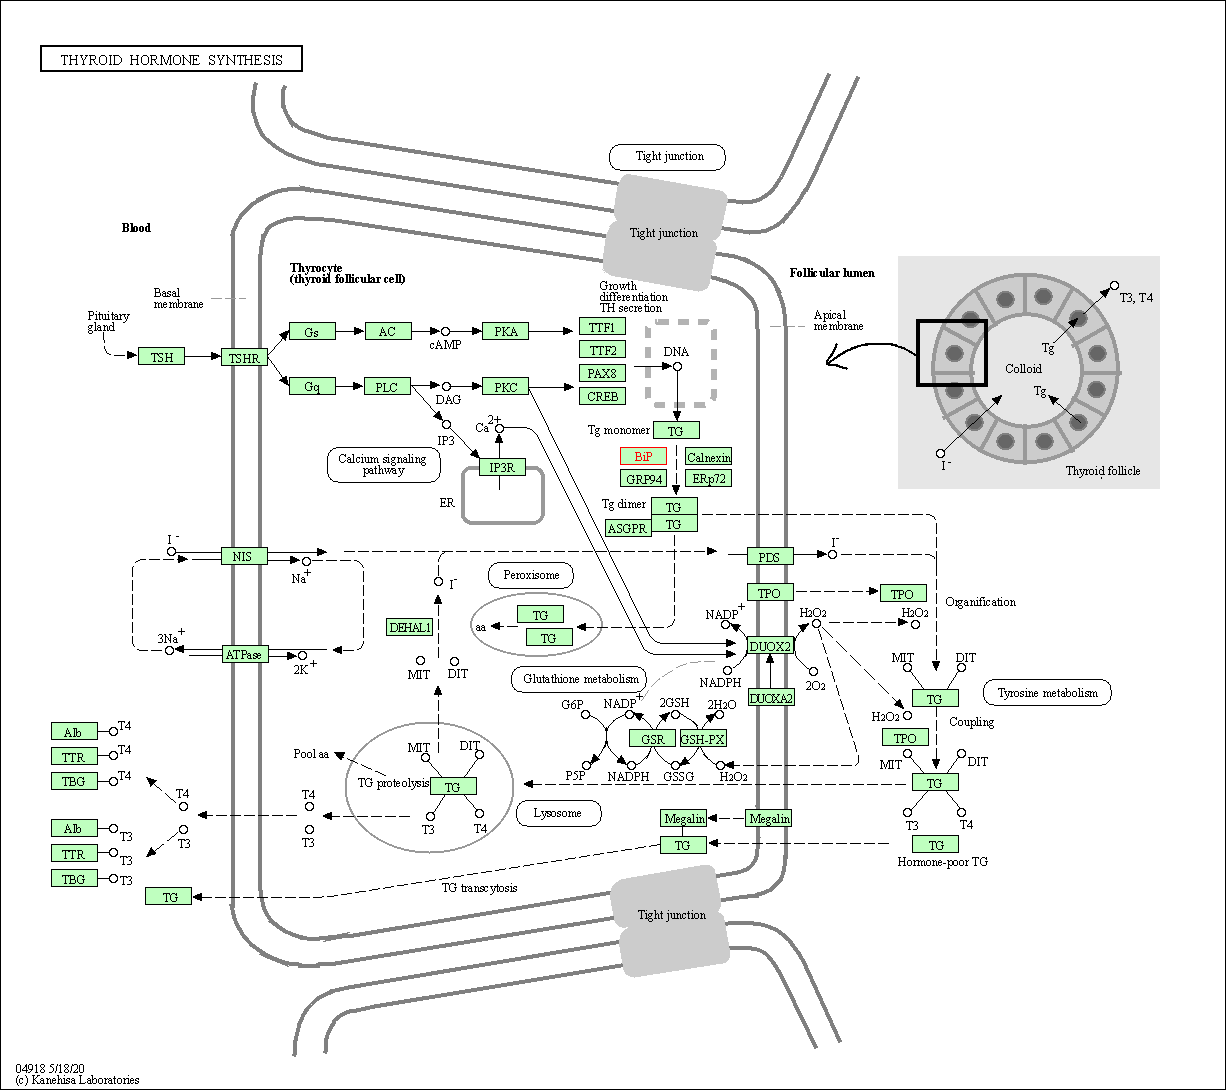
Thyroid hormone synthesis | hsa04918 | Affiliated Target |
|
Class: Organismal Systems => Endocrine system | Pathway Hierarchy |
Degree | 46 | Degree centrality | 4.94E-03 | Betweenness centrality | 6.64E-03 |
---|---|---|---|---|---|
Closeness centrality | 2.52E-01 | Radiality | 1.44E+01 | Clustering coefficient | 5.41E-02 |
Neighborhood connectivity | 2.08E+01 | Topological coefficient | 3.35E-02 | Eccentricity | 11 |
Download | Click to Download the Full PPI Network of This Target | ||||
Chemical Structure based Activity Landscape of Target | Top |
---|---|
Target Regulators | Top | |||||
---|---|---|---|---|---|---|
Target-regulating microRNAs | ||||||
Target-interacting Proteins |
Target Profiles in Patients | Top | |||||
---|---|---|---|---|---|---|
Target Expression Profile (TEP) |
Target Affiliated Biological Pathways | Top | |||||
---|---|---|---|---|---|---|
KEGG Pathway | [+] 5 KEGG Pathways | + | ||||
1 | Protein export | |||||
2 | Protein processing in endoplasmic reticulum | |||||
3 | Antigen processing and presentation | |||||
4 | Thyroid hormone synthesis | |||||
5 | Prion diseases | |||||
NetPath Pathway | [+] 2 NetPath Pathways | + | ||||
1 | TSH Signaling Pathway | |||||
2 | TCR Signaling Pathway | |||||
Panther Pathway | [+] 2 Panther Pathways | + | ||||
1 | Apoptosis signaling pathway | |||||
2 | Parkinson disease | |||||
Pathwhiz Pathway | [+] 1 Pathwhiz Pathways | + | ||||
1 | Retinol Metabolism | |||||
Reactome | [+] 2 Reactome Pathways | + | ||||
1 | Platelet degranulation | |||||
2 | Regulation of HSF1-mediated heat shock response | |||||
WikiPathways | [+] 6 WikiPathways | + | ||||
1 | MAPK Signaling Pathway | |||||
2 | Apoptosis-related network due to altered Notch3 in ovarian cancer | |||||
3 | Activation of Chaperone Genes by ATF6-alpha | |||||
4 | Parkin-Ubiquitin Proteasomal System pathway | |||||
5 | Unfolded Protein Response | |||||
6 | Response to elevated platelet cytosolic Ca2+ |
References | Top | |||||
---|---|---|---|---|---|---|
REF 1 | NKP-1339, a first-in-class anticancer drug showing mild side effects and activity in patients suffering from advanced refractory cancer. BMC Pharmacol Toxicol. 2012; 13(Suppl 1): A82. | |||||
REF 2 | Trusted, scientifically sound profiles of drug programs, clinical trials, safety reports, and company deals, written by scientists. Springer. 2015. Adis Insight (drug id 800034247) | |||||
REF 3 | ClinicalTrials.gov (NCT01415297) Dose Escalation Study of NKP-1339 to Treat Advanced Solid Tumors. U.S. National Institutes of Health. | |||||
REF 4 | ClinicalTrials.gov (NCT01727778) Safety and Preliminary Efficacy Study of the Antibody PAT-SM6 in Patients With Relapsed or Refractory Multiple Myeloma. U.S. National Institutes of Health. | |||||
REF 5 | A new tumor-specific variant of GRP78 as target for antibody-based therapy. Lab Invest. 2008 Apr;88(4):375-86. | |||||
REF 6 | Conformation transitions of the polypeptide-binding pocket support an active substrate release from Hsp70s. Nat Commun. 2017 Oct 31;8(1):1201. | |||||
REF 7 | A novel and unique ATP hydrolysis to AMP by a human Hsp70 Binding immunoglobin protein (BiP). Protein Sci. 2022 Apr;31(4):797-810. |
If You Find Any Error in Data or Bug in Web Service, Please Kindly Report It to Dr. Zhou and Dr. Zhang.