Target Information
| Target General Information | Top | |||||
|---|---|---|---|---|---|---|
| Target ID |
T89458
(Former ID: TTDR00963)
|
|||||
| Target Name |
HepG2 glucose transporter (SLC2A1)
|
|||||
| Synonyms |
Solute carrier family 2, facilitated glucose transporter member 1; HepG2 glucosetransporter; Glucose transporter type 1, erythrocyte/brain; GLUT1; GLUT-1
Click to Show/Hide
|
|||||
| Gene Name |
SLC2A1
|
|||||
| Target Type |
Preclinical target
|
[1] | ||||
| Disease | [+] 1 Target-related Diseases | + | ||||
| 1 | Skin disease [ICD-11: EA00-EM0Z] | |||||
| Function |
Facilitative glucose transporter. This isoform may be responsible for constitutive or basal glucose uptake. Has a very broad substrate specificity; can transport a wide range of aldoses including both pentoses and hexoses.
Click to Show/Hide
|
|||||
| BioChemical Class |
Major facilitator
|
|||||
| UniProt ID | ||||||
| Sequence |
MEPSSKKLTGRLMLAVGGAVLGSLQFGYNTGVINAPQKVIEEFYNQTWVHRYGESILPTT
LTTLWSLSVAIFSVGGMIGSFSVGLFVNRFGRRNSMLMMNLLAFVSAVLMGFSKLGKSFE MLILGRFIIGVYCGLTTGFVPMYVGEVSPTALRGALGTLHQLGIVVGILIAQVFGLDSIM GNKDLWPLLLSIIFIPALLQCIVLPFCPESPRFLLINRNEENRAKSVLKKLRGTADVTHD LQEMKEESRQMMREKKVTILELFRSPAYRQPILIAVVLQLSQQLSGINAVFYYSTSIFEK AGVQQPVYATIGSGIVNTAFTVVSLFVVERAGRRTLHLIGLAGMAGCAILMTIALALLEQ LPWMSYLSIVAIFGFVAFFEVGPGPIPWFIVAELFSQGPRPAAIAVAGFSNWTSNFIVGM CFQYVEQLCGPYVFIIFTVLLVLFFIFTYFKVPETKGRTFDEIASGFRQGGASQSDKTPE ELFHPLGADSQV Click to Show/Hide
|
|||||
| 3D Structure | Click to Show 3D Structure of This Target | PDB | ||||
| ADReCS ID | BADD_A01328 ; BADD_A05962 | |||||
| HIT2.0 ID | T42PUG | |||||
| Drugs and Modes of Action | Top | |||||
|---|---|---|---|---|---|---|
| Preclinical Drug(s) | [+] 1 Preclinical Drugs | + | ||||
| 1 | WZB-117 | Drug Info | Preclinical | Skin fibrosis | [2] | |
| Mode of Action | [+] 1 Modes of Action | + | ||||
| Inhibitor | [+] 1 Inhibitor drugs | + | ||||
| 1 | WZB-117 | Drug Info | [3] | |||
| Cell-based Target Expression Variations | Top | |||||
|---|---|---|---|---|---|---|
| Cell-based Target Expression Variations | ||||||
| Drug Binding Sites of Target | Top | |||||
|---|---|---|---|---|---|---|
| Ligand Name: Preverex | Ligand Info | |||||
| Structure Description | Human GLUT1 in complex with Cytochalasin B | PDB:5EQI | ||||
| Method | X-ray diffraction | Resolution | 3.00 Å | Mutation | No | [4] |
| PDB Sequence |
TGRLMLAVGG
18 AVLGSLQFGY28 NTGVINAPQK38 VIEEFYNQTW48 VHRYGESILP58 TTLTTLWSLS 68 VAIFSVGGMI78 GSFSVGLFVN88 RFGRRNSMLM98 MNLLAFVSAV108 LMGFSKLGKS 118 FEMLILGRFI128 IGVYCGLTTG138 FVPMYVGEVS148 PTALRGALGT158 LHQLGIVVGI 168 LIAQVFGLDS178 IMGNKDLWPL188 LLSIIFIPAL198 LQCIVLPFCP208 ESPRFLLINR 218 NEENRAKSVL228 KKLRGTADVT238 HDLQEMKEES248 RQMMREKKVT258 ILELFRSPAY 268 RQPILIAVVL278 QLSQQLSGIN288 AVFYYSTSIF298 EKAGVQQPVY308 ATIGSGIVNT 318 AFTVVSLFVV328 ERAGRRTLHL338 IGLAGMAGCA348 ILMTIALALL358 EQLPWMSYLS 368 IVAIFGFVAF378 FEVGPGPIPW388 FIVAELFSQG398 PRPAAIAVAG408 FSNWTSNFIV 418 GMCFQYVEQL428 CGPYVFIIFT438 VLLVLFFIFT448 YFKVPET
|
|||||
|
|
PHE26
2.986
THR30
4.736
SER80
2.728
GLY134
4.435
THR137
2.099
GLY138
4.505
PRO141
3.068
HIS160
3.015
GLN161
2.123
ILE164
2.530
VAL165
4.188
ILE168
3.740
GLN279
4.948
GLN282
2.039
GLN283
2.669
ILE287
3.044
ASN288
2.463
PHE291
3.195
|
|||||
| Ligand Name: B-Nonylglucoside | Ligand Info | |||||
| Structure Description | Crystal structure of human sugar transporter GLUT1 (SLC2A1) in the inward conformation | PDB:6THA | ||||
| Method | X-ray diffraction | Resolution | 2.40 Å | Mutation | No | [5] |
| PDB Sequence |
LTGRLMLAVG
17 GAVLGSLQFG27 YNTGVINAPQ37 KVIEEFYNQT47 WVHRYGESIL57 PTTLTTLWSL 67 SVAIFSVGGM77 IGSFSVGLFV87 NRFGRRNSML97 MMNLLAFVSA107 VLMGFSKLGK 117 SFEMLILGRF127 IIGVYCGLTT137 GFVPMYVGEV147 SPTALRGALG157 TLHQLGIVVG 167 ILIAQVFGLD177 SIMGNKDLWP187 LLLSIIFIPA197 LLQCIVLPFC207 PESPRFLLIN 217 RNEENRAKSV227 LKKLRGTADV237 THDLQEMKEE247 SRQMMREKKV257 TILELFRSPA 267 YRQPILIAVV277 LQLSQQLSGI287 NAVFYYSTSI297 FEKAGVQQPV307 YATIGSGIVN 317 TAFTVVSLFV327 VERAGRRTLH337 LIGLAGMAGC347 AILMTIALAL357 LEQLPWMSYL 367 SIVAIFGFVA377 FFEVGPGPIP387 WFIVAELFSQ397 GPRPAAIAVA407 GFSNWTSNFI 417 VGMCFQYVEQ427 LCGPYVFIIF437 TVLLVLFFIF447 TYFKVPET
|
|||||
|
|
THR30
3.546
ARG93
3.152
ASN94
3.162
LEU97
4.234
MET98
4.160
PRO141
3.821
GLY157
4.438
HIS160
4.032
GLN161
3.295
ILE164
4.681
VAL165
3.720
ILE168
3.738
GLU209
2.574
LEU214
4.590
ARG218
2.773
|
|||||
| Click to View More Binding Site Information of This Target and Ligand Pair | ||||||
| Click to View More Binding Site Information of This Target with Different Ligands | ||||||
| Different Human System Profiles of Target | Top |
|---|---|
|
Human Similarity Proteins
of target is determined by comparing the sequence similarity of all human proteins with the target based on BLAST. The similarity proteins for a target are defined as the proteins with E-value < 0.005 and outside the protein families of the target.
A target that has fewer human similarity proteins outside its family is commonly regarded to possess a greater capacity to avoid undesired interactions and thus increase the possibility of finding successful drugs
(Brief Bioinform, 21: 649-662, 2020).
Human Tissue Distribution
of target is determined from a proteomics study that quantified more than 12,000 genes across 32 normal human tissues. Tissue Specificity (TS) score was used to define the enrichment of target across tissues.
The distribution of targets among different tissues or organs need to be taken into consideration when assessing the target druggability, as it is generally accepted that the wider the target distribution, the greater the concern over potential adverse effects
(Nat Rev Drug Discov, 20: 64-81, 2021).
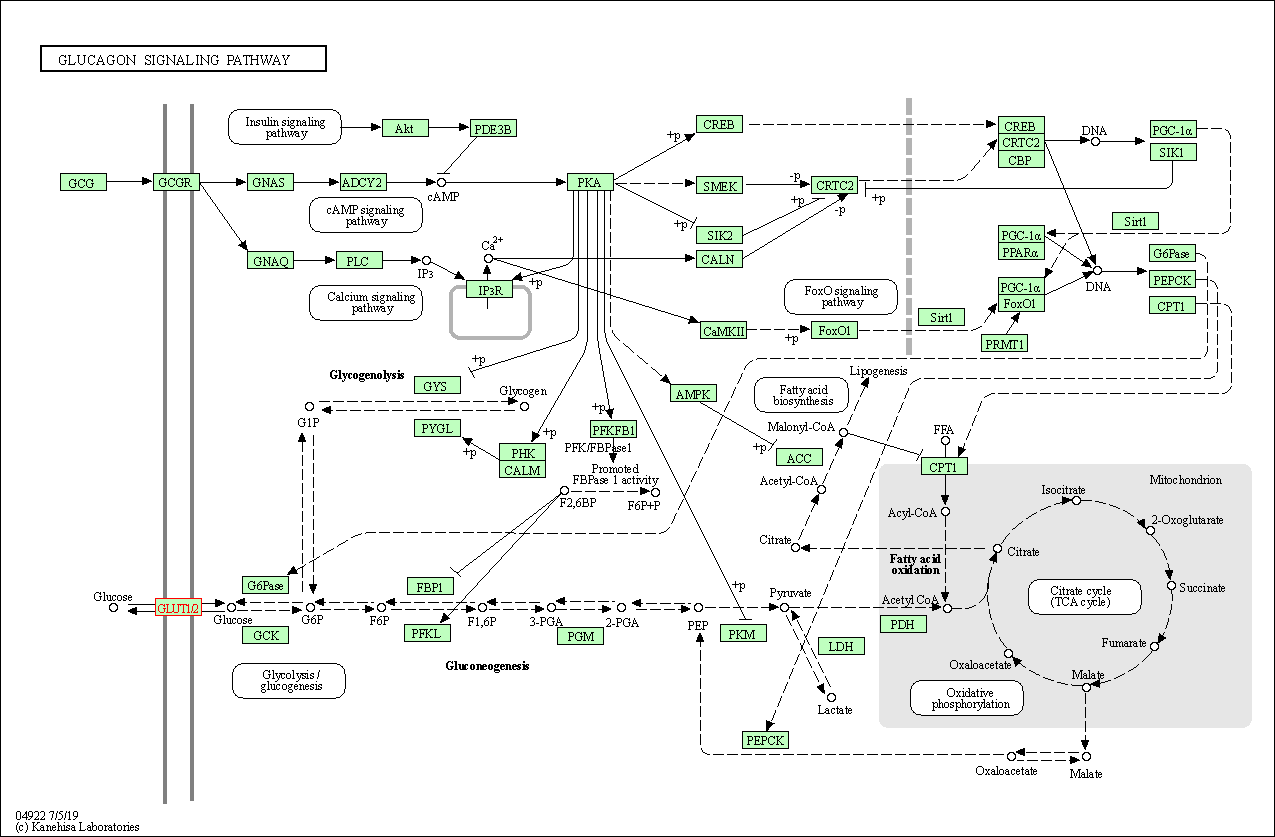
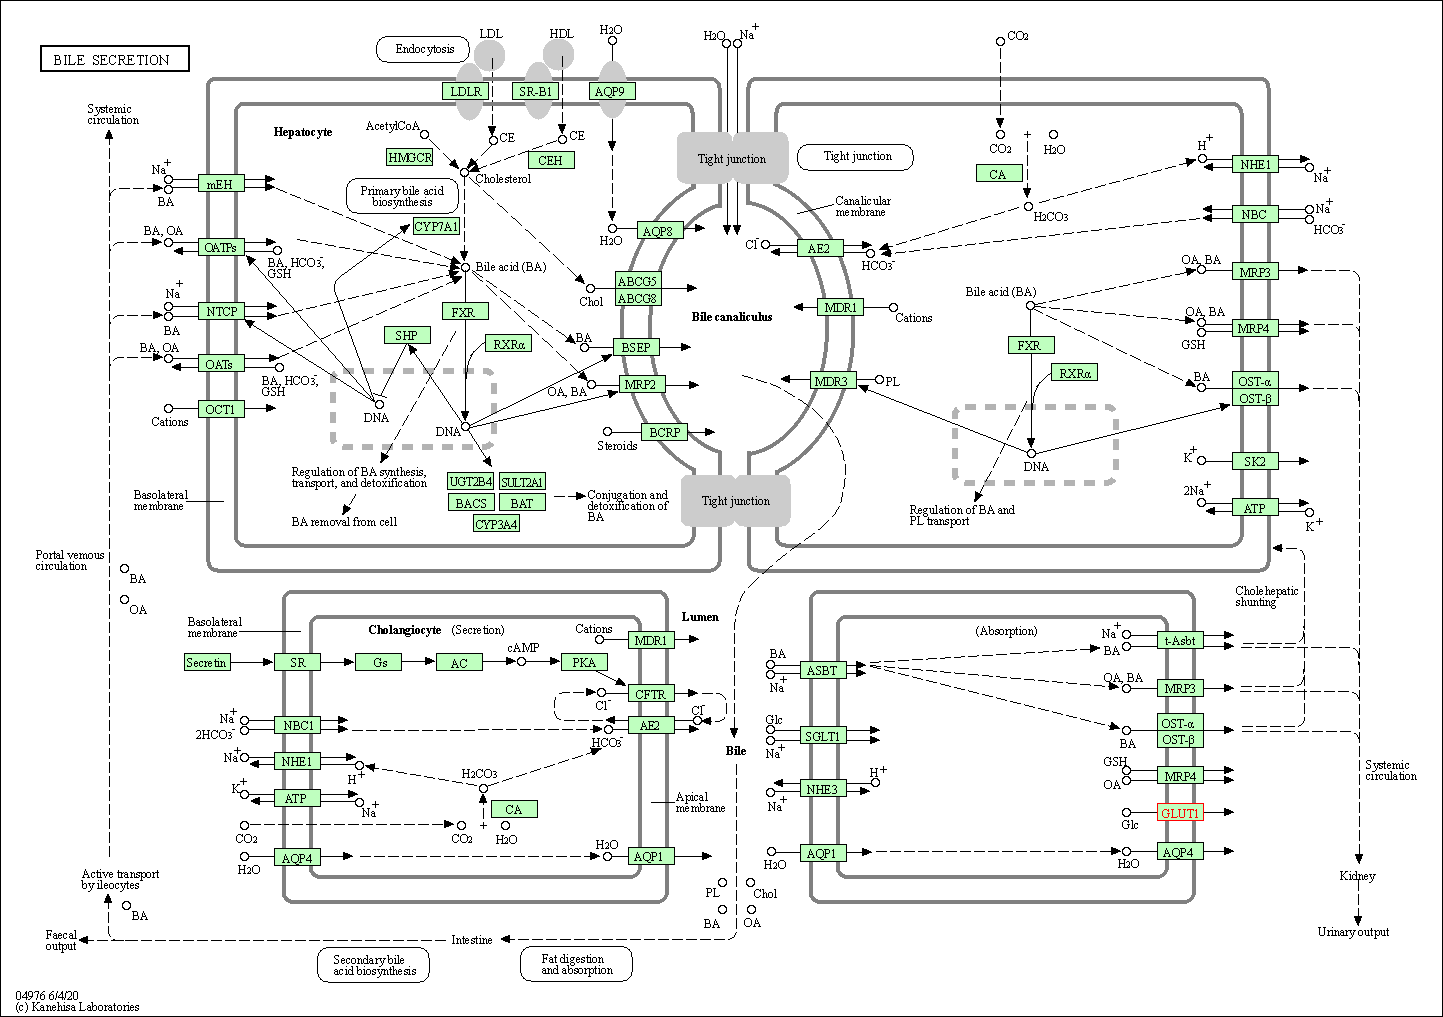
Human Pathway Affiliation
of target is determined by the life-essential pathways provided on KEGG database. The target-affiliated pathways were defined based on the following two criteria (a) the pathways of the studied target should be life-essential for both healthy individuals and patients, and (b) the studied target should occupy an upstream position in the pathways and therefore had the ability to regulate biological function.
Targets involved in a fewer pathways have greater likelihood to be successfully developed, while those associated with more human pathways increase the chance of undesirable interferences with other human processes
(Pharmacol Rev, 58: 259-279, 2006).
Biological Network Descriptors
of target is determined based on a human protein-protein interactions (PPI) network consisting of 9,309 proteins and 52,713 PPIs, which were with a high confidence score of ≥ 0.95 collected from STRING database.
The network properties of targets based on protein-protein interactions (PPIs) have been widely adopted for the assessment of target’s druggability. Proteins with high node degree tend to have a high impact on network function through multiple interactions, while proteins with high betweenness centrality are regarded to be central for communication in interaction networks and regulate the flow of signaling information
(Front Pharmacol, 9, 1245, 2018;
Curr Opin Struct Biol. 44:134-142, 2017).
Human Similarity Proteins
Human Tissue Distribution
Human Pathway Affiliation
Biological Network Descriptors
|
|
| Protein Name | Pfam ID | Percentage of Identity (%) | E value |
|---|---|---|---|
| Organic cation transporter 3 (OCT3) | 23.744 (104/438) | 1.33E-08 | |
| Solute carrier family 22 member 7 (SLC22A7) | 24.021 (92/383) | 1.45E-06 |
|
Note:
If a protein has TS (tissue specficity) scores at least in one tissue >= 2.5, this protein is called tissue-enriched (including tissue-enriched-but-not-specific and tissue-specific). In the plots, the vertical lines are at thresholds 2.5 and 4.
|
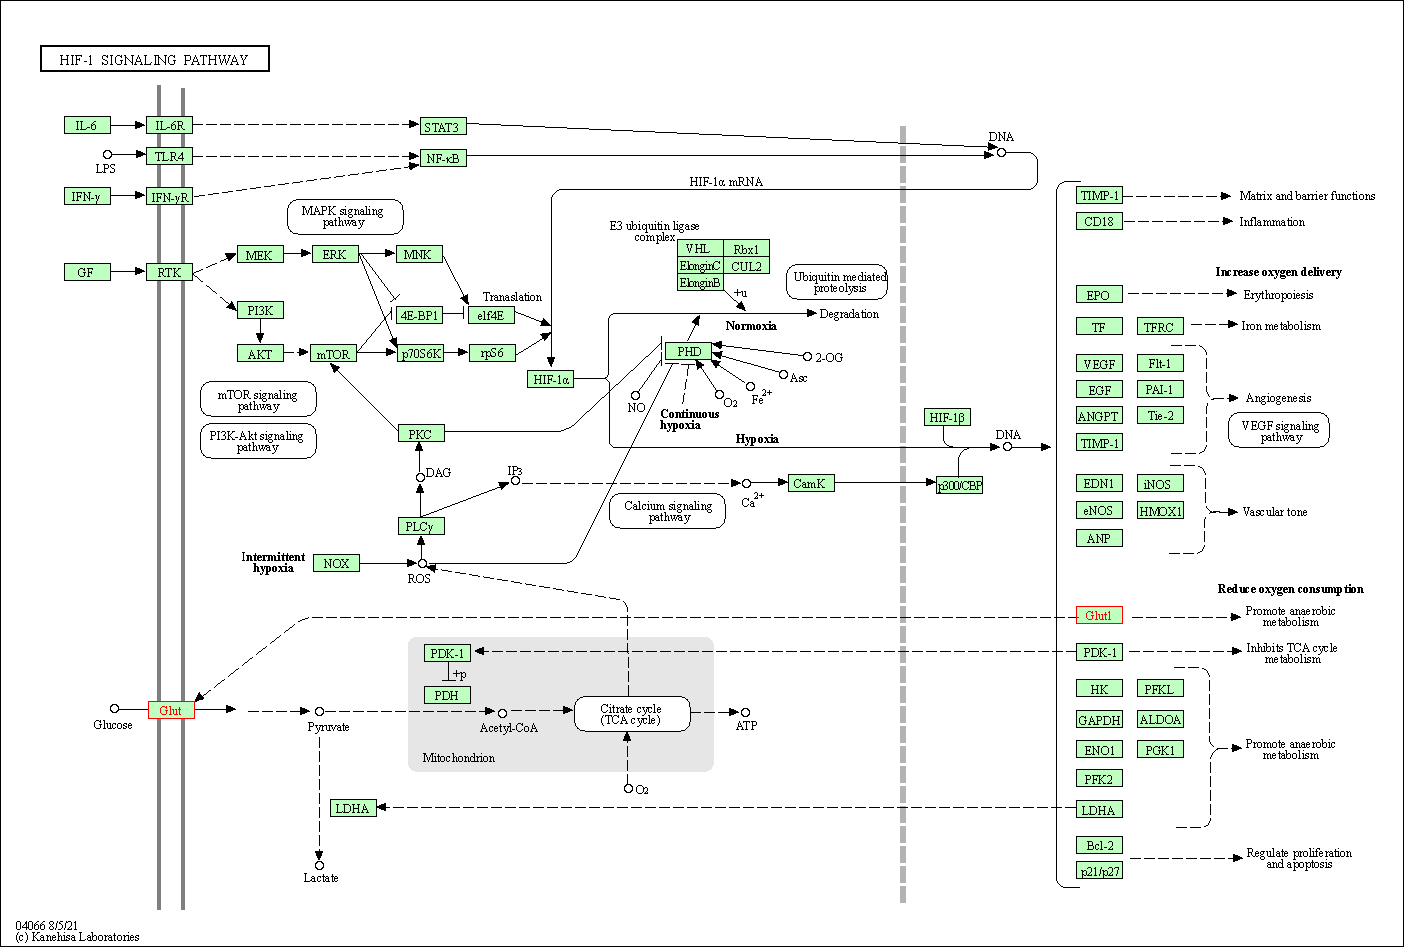
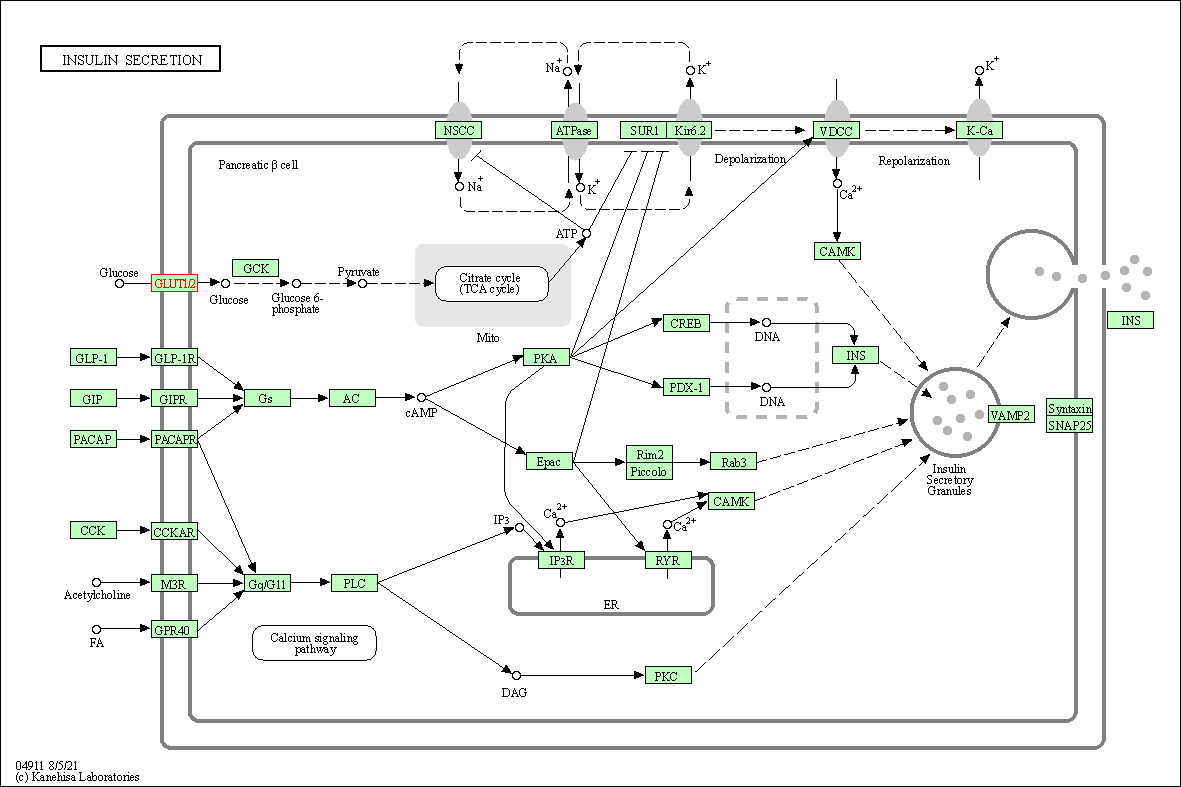
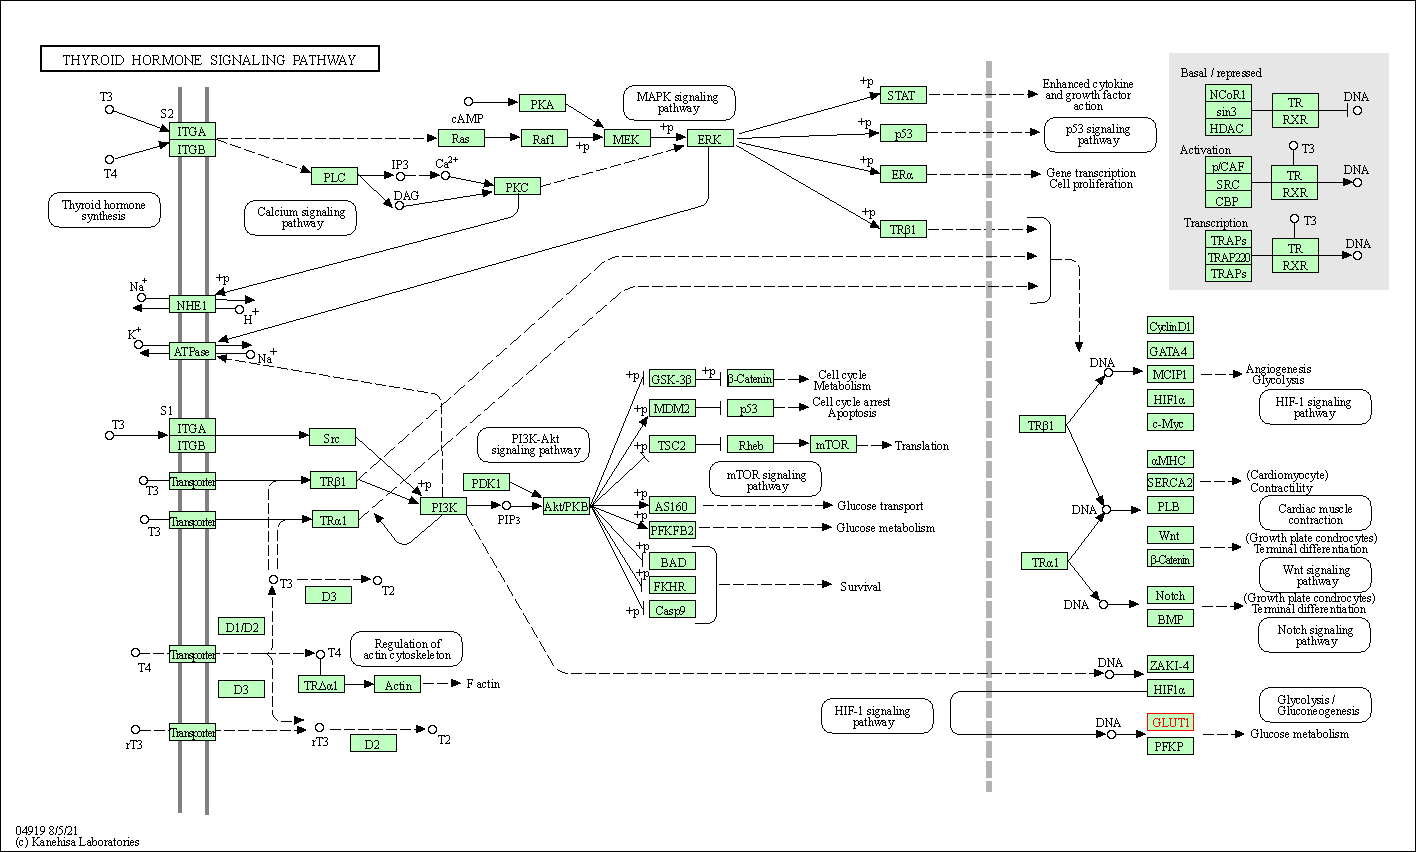
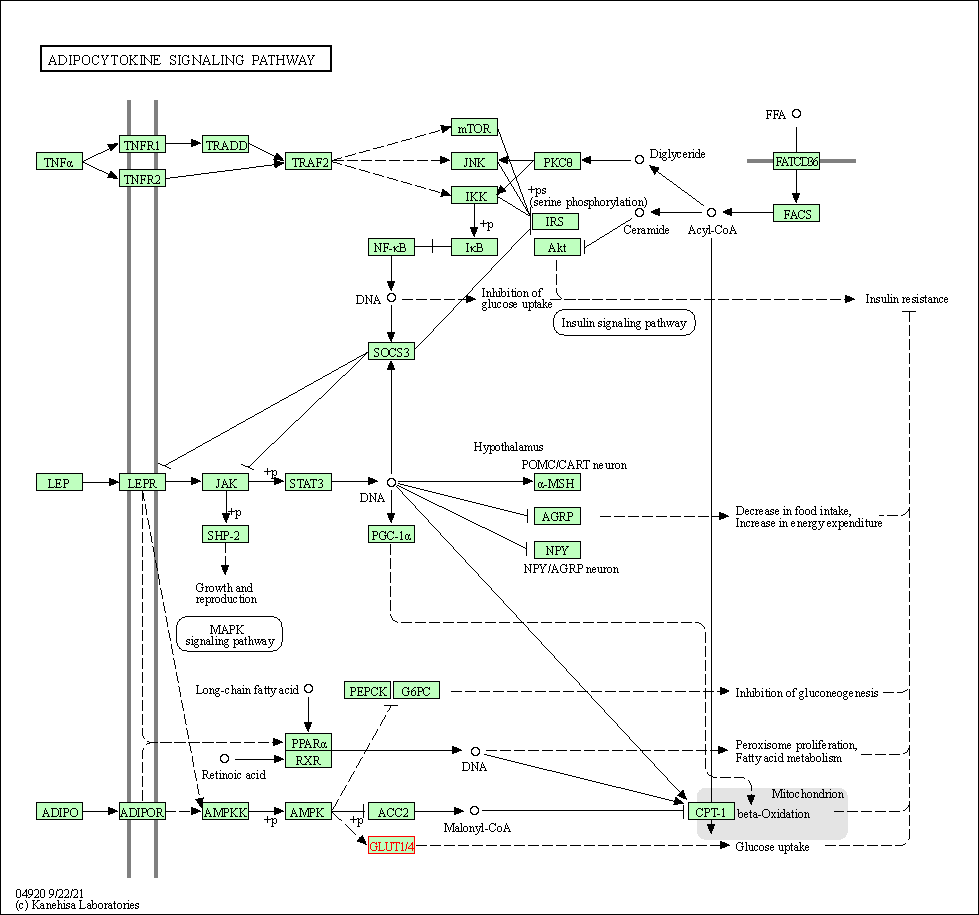
| KEGG Pathway | Pathway ID | Affiliated Target | Pathway Map |
|---|---|---|---|
| HIF-1 signaling pathway | hsa04066 | Affiliated Target |

|
| Class: Environmental Information Processing => Signal transduction | Pathway Hierarchy | ||
| Insulin secretion | hsa04911 | Affiliated Target |

|
| Class: Organismal Systems => Endocrine system | Pathway Hierarchy | ||
| Thyroid hormone signaling pathway | hsa04919 | Affiliated Target |

|
| Class: Organismal Systems => Endocrine system | Pathway Hierarchy | ||
| Adipocytokine signaling pathway | hsa04920 | Affiliated Target |

|
| Class: Organismal Systems => Endocrine system | Pathway Hierarchy | ||
| Glucagon signaling pathway | hsa04922 | Affiliated Target |

|
| Class: Organismal Systems => Endocrine system | Pathway Hierarchy | ||
| Bile secretion | hsa04976 | Affiliated Target |

|
| Class: Organismal Systems => Digestive system | Pathway Hierarchy | ||
| Click to Show/Hide the Information of Affiliated Human Pathways | |||
| Degree | 2 | Degree centrality | 2.15E-04 | Betweenness centrality | 2.02E-04 |
|---|---|---|---|---|---|
| Closeness centrality | 1.70E-01 | Radiality | 1.27E+01 | Clustering coefficient | 0.00E+00 |
| Neighborhood connectivity | 3.50E+00 | Topological coefficient | 5.00E-01 | Eccentricity | 13 |
| Download | Click to Download the Full PPI Network of This Target | ||||
| Chemical Structure based Activity Landscape of Target | Top |
|---|---|
| Target Poor or Non Binders | Top | |||||
|---|---|---|---|---|---|---|
| Target Poor or Non Binders | ||||||
| Target Regulators | Top | |||||
|---|---|---|---|---|---|---|
| Target-regulating microRNAs | ||||||
| References | Top | |||||
|---|---|---|---|---|---|---|
| REF 1 | GLUT1 messenger RNA and protein induction relates to the malignant transformation of cervical cancer. Am J Clin Pathol. 2003 Nov;120(5):691-8. | |||||
| REF 2 | Targeting metabolic dysregulation for fibrosis therapy. Nat Rev Drug Discov. 2020 Jan;19(1):57-75. | |||||
| REF 3 | Quercetin inhibits glucose transport by binding to an exofacial site on GLUT1. Biochimie. 2018 Aug;151:107-114. | |||||
| REF 4 | Mechanism of inhibition of human glucose transporter GLUT1 is conserved between cytochalasin B and phenylalanine amides. Proc Natl Acad Sci U S A. 2016 Apr 26;113(17):4711-6. | |||||
| REF 5 | Structural comparison of GLUT1 to GLUT3 reveal transport regulation mechanism in sugar porter family. Life Sci Alliance. 2021 Feb 3;4(4):e202000858. | |||||
If You Find Any Error in Data or Bug in Web Service, Please Kindly Report It to Dr. Zhou and Dr. Zhang.

