

Target expression details
| Target General Information | |||||
|---|---|---|---|---|---|
| Target ID | T43189 | ||||
| Target Name | Tubulin | ||||
| Synonyms | Tubulin beta-4 chain; Tubulin beta-III; TUBB3 | ||||
| Target Type | Successful | ||||
| Gene Name | TUBB3 | ||||
| Biochemical Class | Tubulin family | ||||
| UniProt ID | TBA1A_HUMAN||TBA1B_HUMAN||TBA1C_HUMAN||TBA3C_HUMAN||TBA3E_HUMAN||TBA4A_HUMAN||TBA8_HUMAN||TBB1_HUMAN||TBB2A_HUMAN||TBB2B_HUMAN||TBB3_HUMAN||TBB4A_HUMAN||TBB4B_HUMAN||TBB5_HUMAN||TBB6_HUMAN||TBB8_HUMAN | ||||
| Target Gene Expression Profiles in the Disease-Relevant Drug Targeted Tissue of the Patients and Healthy Individuals | |||||
| Disease | Breast cancer | ||||
| Example drug | Cabazitaxel | Approved | [1], [2], [3] | ||
| Tissue | Breast tissue | ||||
| Level of differential expression between the patients in the disease section of the tissue and the tissues of healthy individual | Fold-change: 0.30 Z-score: 0.59 P-value: 4.29E-15 |
||||
| Level of differential expression between the patients in the disease section of the tissue and the patients in the normal section of the tissue adjacent to the disease section | Fold-change: 0.24 Z-score: 0.38 P-value: 3.00E-03 |
||||
|
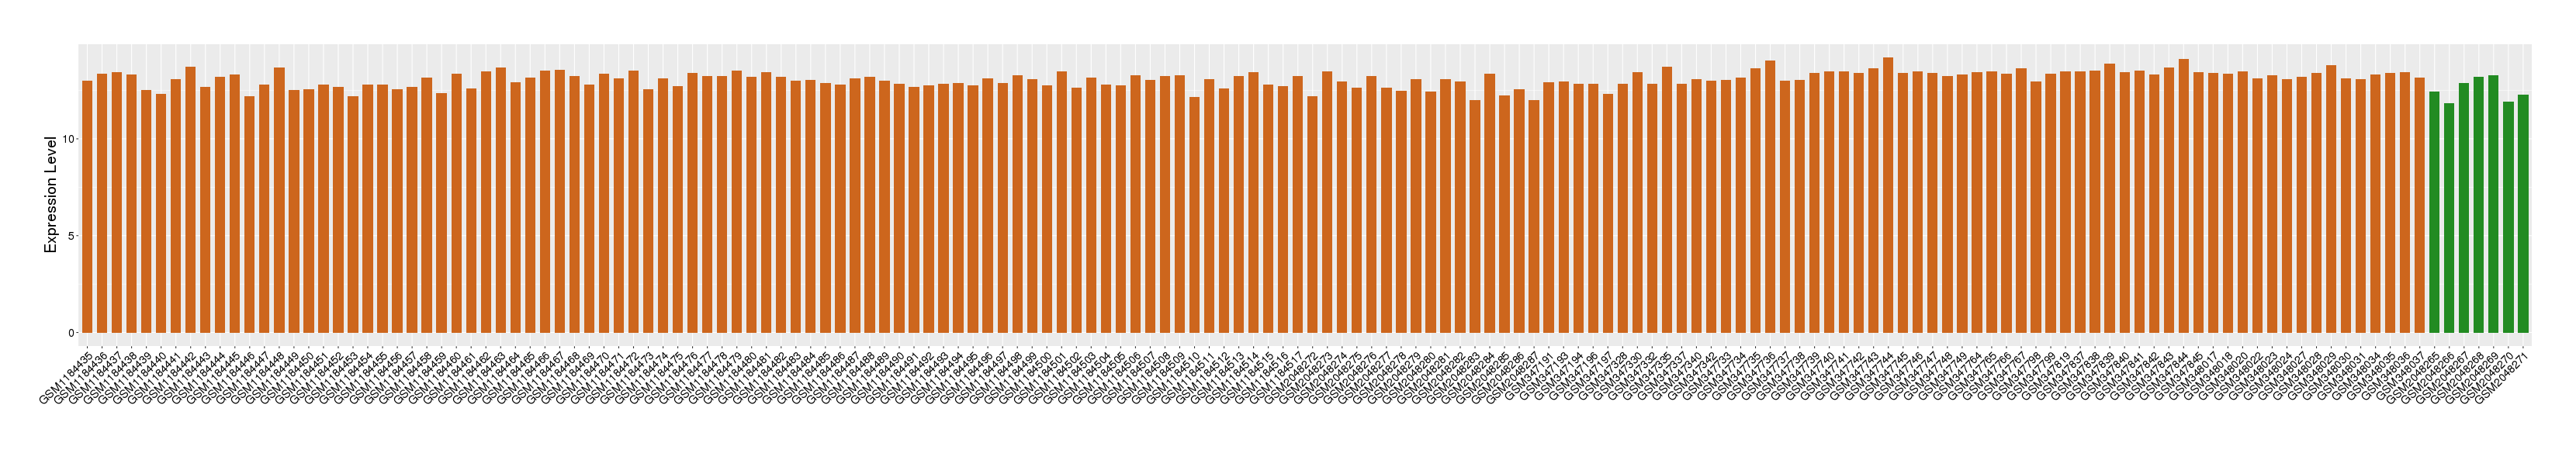
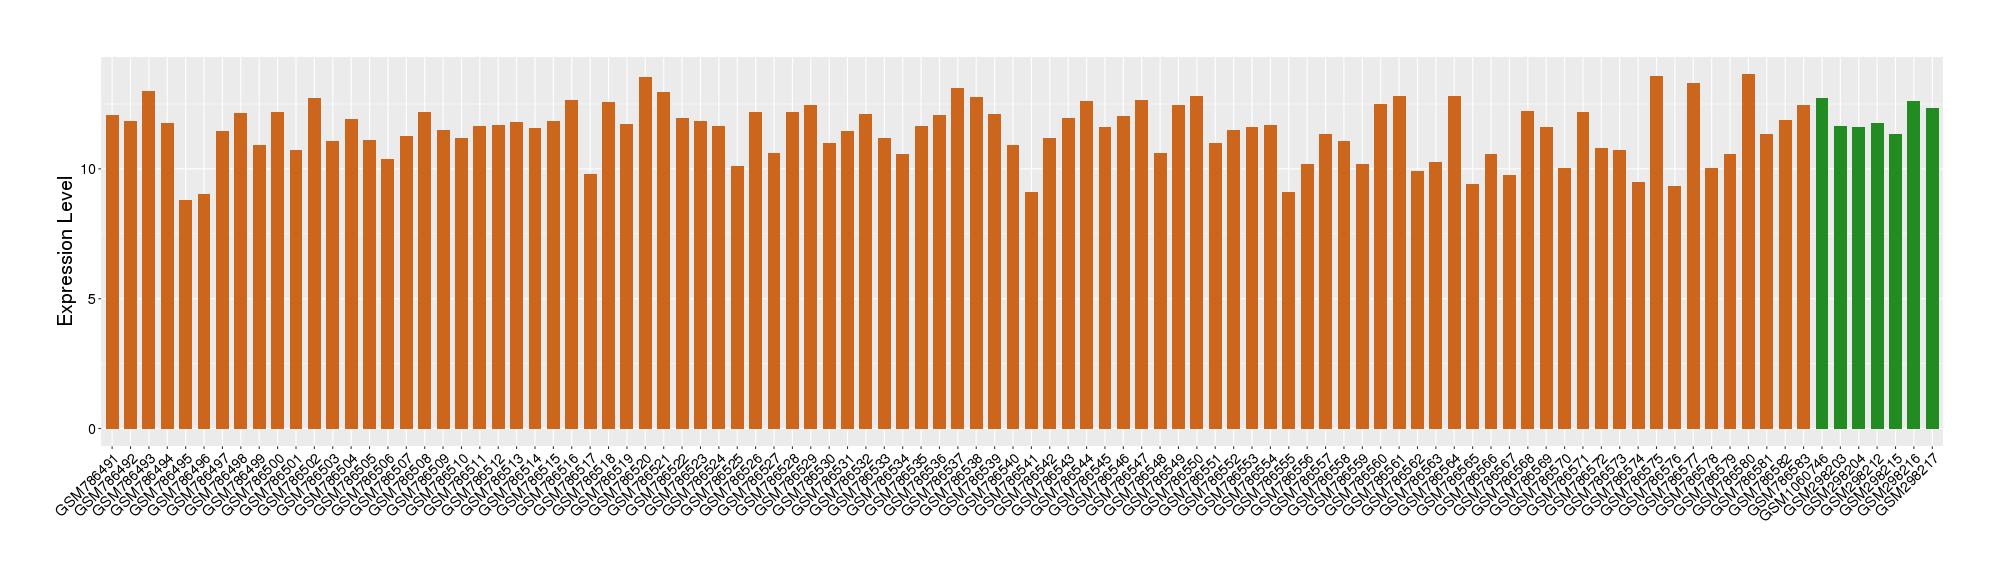
Target gene expression profiles of the patients in the disease section of the tissue
Target gene expression profiles of the patients in the normal section of the tissue adjacent to the disease section
Target gene expression profiles in the tissue of healthy individual

|
|||||
| Disease | Rheumatoid arthritis | ||||
| Example drug | Colchicine | Approved | [4], [5], [6], [3] | ||
| Tissue | Synovial tissue | ||||
| Level of differential expression between the patients in the disease section of the tissue and the tissues of healthy individual | Fold-change: 0.71 Z-score: 1.23 P-value: 4.60E-02 |
||||
|
Target gene expression profiles of the patients in the disease section of the tissue
Target gene expression profiles in the tissue of healthy individual
|
|||||
| Disease | Ovarian cancer | ||||
| Example drug | Epothilon | Phase 3 | [7], [3] | ||
| Tissue | Ovarian tissue | ||||
| Level of differential expression between the patients in the disease section of the tissue and the tissues of healthy individual | Fold-change: 0.35 Z-score: 0.43 P-value: 7.94E-02 |
||||
| Level of differential expression between the patients in the disease section of the tissue and the patients in the normal section of the tissue adjacent to the disease section | Fold-change: 1.00 Z-score: 0.60 P-value: 7.32E-01 |
||||
|
Target gene expression profiles of the patients in the disease section of the tissue
Target gene expression profiles of the patients in the normal section of the tissue adjacent to the disease section
Target gene expression profiles in the tissue of healthy individual

|
|||||
| Disease | Bladder cancer | ||||
| Example drug | Larotaxel | Discontinued in Phase 3 | [8], [3] | ||
| Tissue | Bladder tissue | ||||
| Level of differential expression between the patients in the disease section of the tissue and the tissues of healthy individual | Fold-change: -0.12 Z-score: -0.23 P-value: 4.53E-02 |
||||
|
Target gene expression profiles of the patients in the disease section of the tissue
Target gene expression profiles in the tissue of healthy individual
|
|||||
| Disease | Lung cancer | ||||
| Tissue | Lung tissue | ||||
| Level of differential expression between the patients in the disease section of the tissue and the tissues of healthy individual | Fold-change: 0.28 Z-score: 0.72 P-value: 5.46E-09 |
||||
| Level of differential expression between the patients in the disease section of the tissue and the patients in the normal section of the tissue adjacent to the disease section | Fold-change: 0.17 Z-score: 0.34 P-value: 1.54E-02 |
||||
|
Target gene expression profiles of the patients in the disease section of the tissue
Target gene expression profiles of the patients in the normal section of the tissue adjacent to the disease section
Target gene expression profiles in the tissue of healthy individual

|
|||||
| Disease | Sarcoma | ||||
| Tissue | Muscle tissue | ||||
| Level of differential expression between the patients in the disease section of the tissue and the tissues of healthy individual | Fold-change: 1.86 Z-score: 3.42 P-value: 2.73E-287 |
||||
| Level of differential expression between the patients in the disease section of the tissue and the patients in the normal section of the tissue adjacent to the disease section | Fold-change: 2.06 Z-score: 4.67 P-value: 2.24E-03 |
||||
|
Target gene expression profiles of the patients in the disease section of the tissue
Target gene expression profiles of the patients in the normal section of the tissue adjacent to the disease section
Target gene expression profiles in the tissue of healthy individual

|
|||||
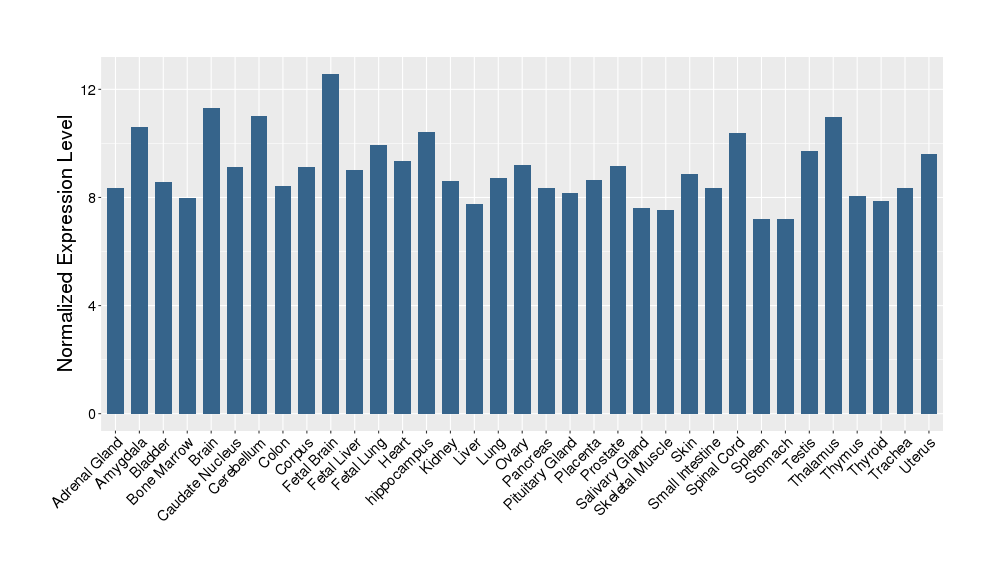
| Target Gene Expression Profiles in Other Tissues of Healthy Individuals | |||||
|
|||||
| Reference | |||||
| REF 1 | Mullard A: 2010 FDA drug approvals. Nat Rev Drug Discov. 2011 Feb;10(2):82-5. | ||||
| REF 2 | (http://www.guidetopharmacology.org/) Nucleic Acids Res. 2015 Oct 12. pii: gkv1037. The IUPHAR/BPS Guide to PHARMACOLOGY in 2016: towards curated quantitative interactions between 1300 protein targets and 6000 ligands. (Ligand id: 6798). | ||||
| REF 3 | NCBI GEO: archive for functional genomics data sets--update. | ||||
| REF 4 | FDA Approved Drug Products from FDA Official Website. 2009. Application Number: (ANDA) 084279. | ||||
| REF 5 | (http://www.guidetopharmacology.org/) Nucleic Acids Res. 2015 Oct 12. pii: gkv1037. The IUPHAR/BPS Guide to PHARMACOLOGY in 2016: towards curated quantitative interactions between 1300 protein targets and 6000 ligands. (Ligand id: 7526). | ||||
| REF 6 | Drugs@FDA. U.S. Food and Drug Administration. U.S. Department of Health & Human Services. 2015 | ||||
| REF 7 | Emerging drugs for ovarian cancer. Expert Opin Emerg Drugs. 2008 Sep;13(3):523-36. | ||||
| REF 8 | Trusted, scientifically sound profiles of drug programs, clinical trials, safety reports, and company deals, written by scientists. Springer. 2015. Adis Insight (drug id 800010227) | ||||
If You Find Any Error in Data or Bug in Web Service, Please Kindly Report It to Dr. Zhou and Dr. Zhang.