

Target expression details
| Target General Information | |||||
|---|---|---|---|---|---|
| Target ID | T57700 | ||||
| Target Name | Proto-oncogene c-Kit | ||||
| Synonyms | C-kit; CD117 antigen; Proto-oncogene tyrosine-protein kinase Kit; SCFR; KIT | ||||
| Target Type | Successful | ||||
| Gene Name | KIT | ||||
| Biochemical Class | Kinase | ||||
| UniProt ID | KIT_HUMAN | ||||
| Target Gene Expression Profiles in the Disease-Relevant Drug Targeted Tissue of the Patients and Healthy Individuals | |||||
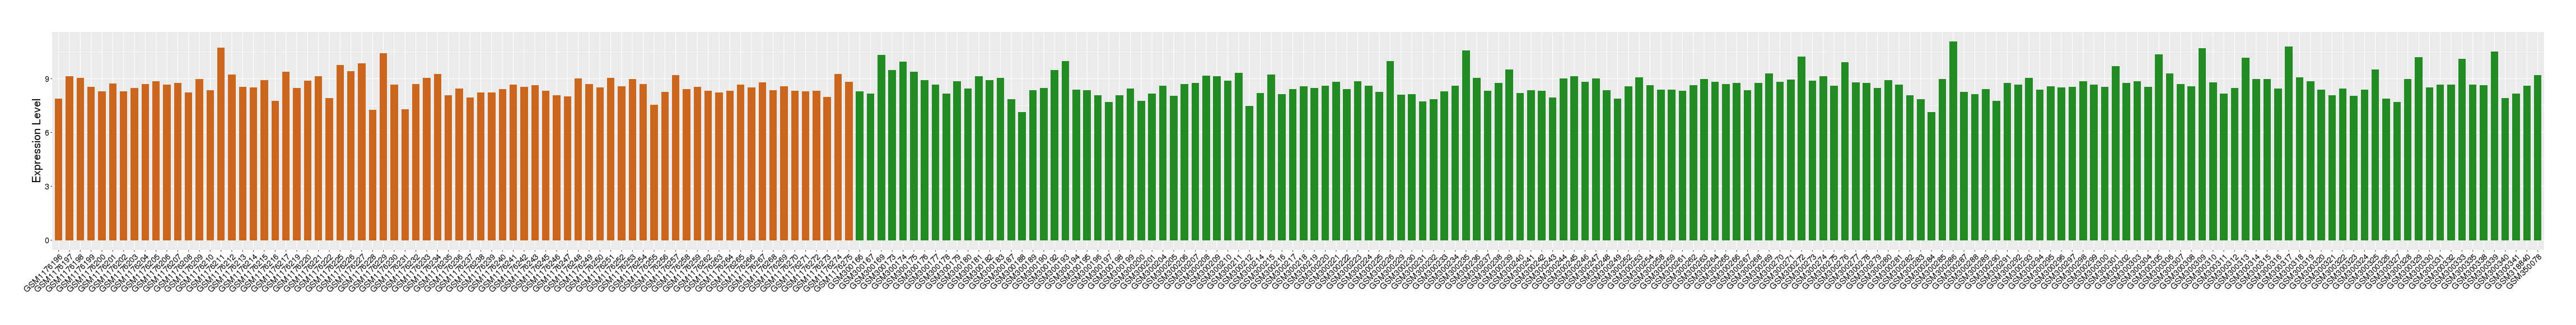
| Disease | Acute myelocytic leukemia | ||||
| Example drug | Imatinib | Approved | [1], [2], [3] | ||
| Tissue | Bone marrow | ||||
| Level of differential expression between the patients in the disease section of the tissue and the tissues of healthy individual | Fold-change: 1.65 Z-score: 2.12 P-value: 9.88E-36 |
||||
|
Target gene expression profiles of the patients in the disease section of the tissue
Target gene expression profiles in the tissue of healthy individual

|
|||||
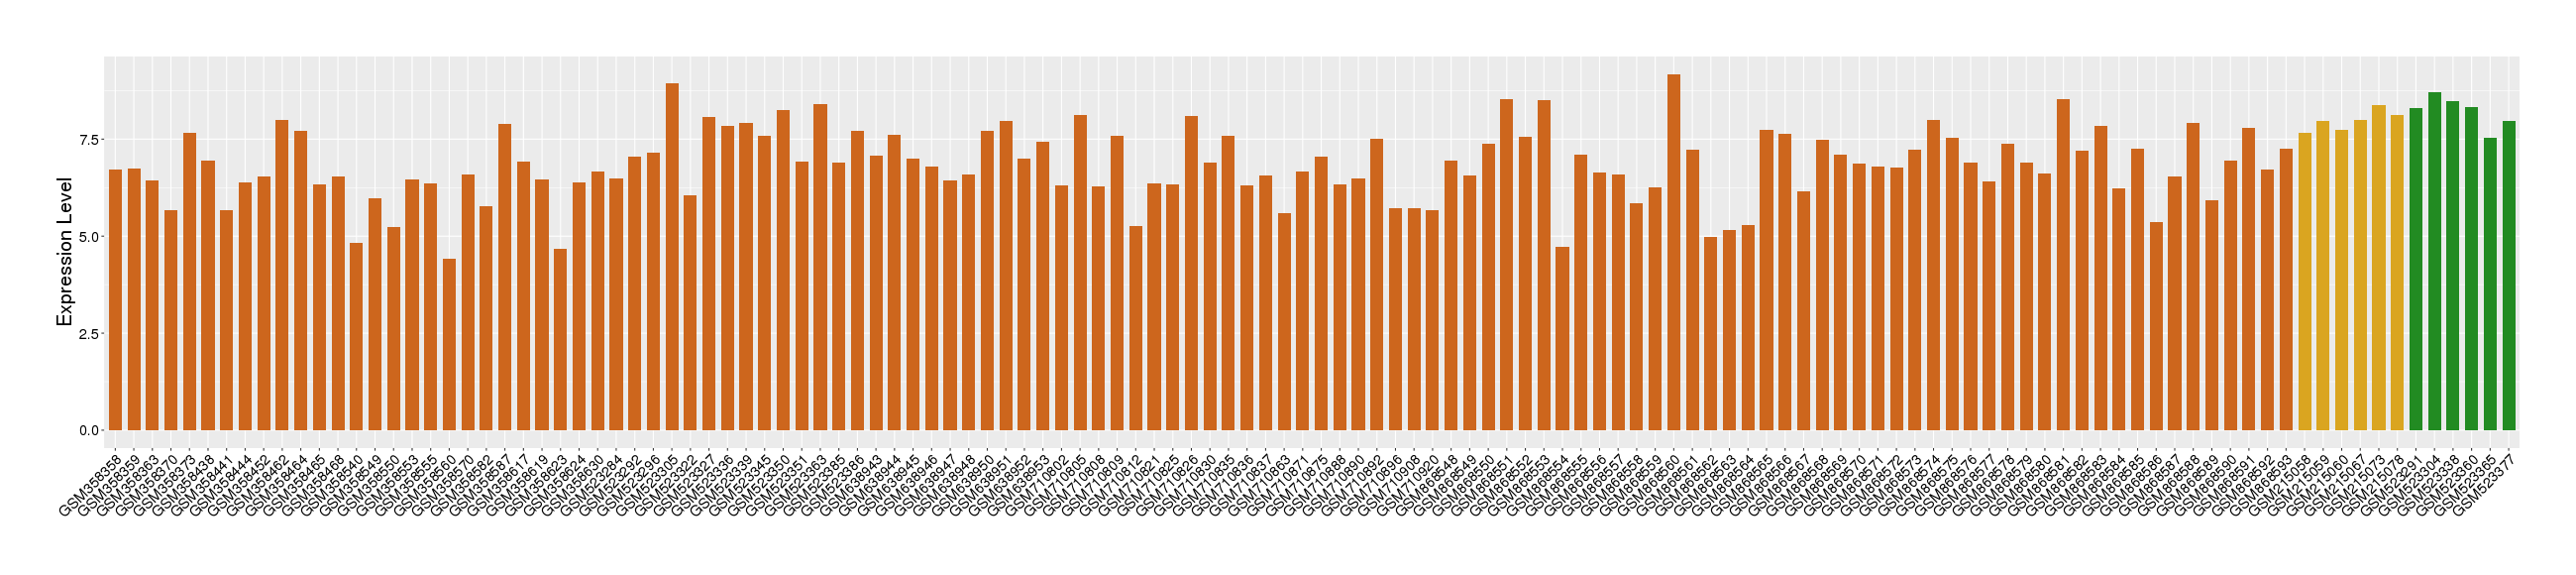
| Disease | Renal cancer | ||||
| Example drug | Pazopanib HCl | Approved | [4], [3] | ||
| Tissue | Kidney | ||||
| Level of differential expression between the patients in the disease section of the tissue and the tissues of healthy individual | Fold-change: -1.17 Z-score: -2.77 P-value: 5.94E-06 |
||||
| Level of differential expression between the patients in the disease section of the tissue and the patients in the normal section of the tissue adjacent to the disease section | Fold-change: -0.87 Z-score: -1.40 P-value: 1.82E-13 |
||||
|
Target gene expression profiles of the patients in the disease section of the tissue
Target gene expression profiles of the patients in the normal section of the tissue adjacent to the disease section
Target gene expression profiles in the tissue of healthy individual

|
|||||
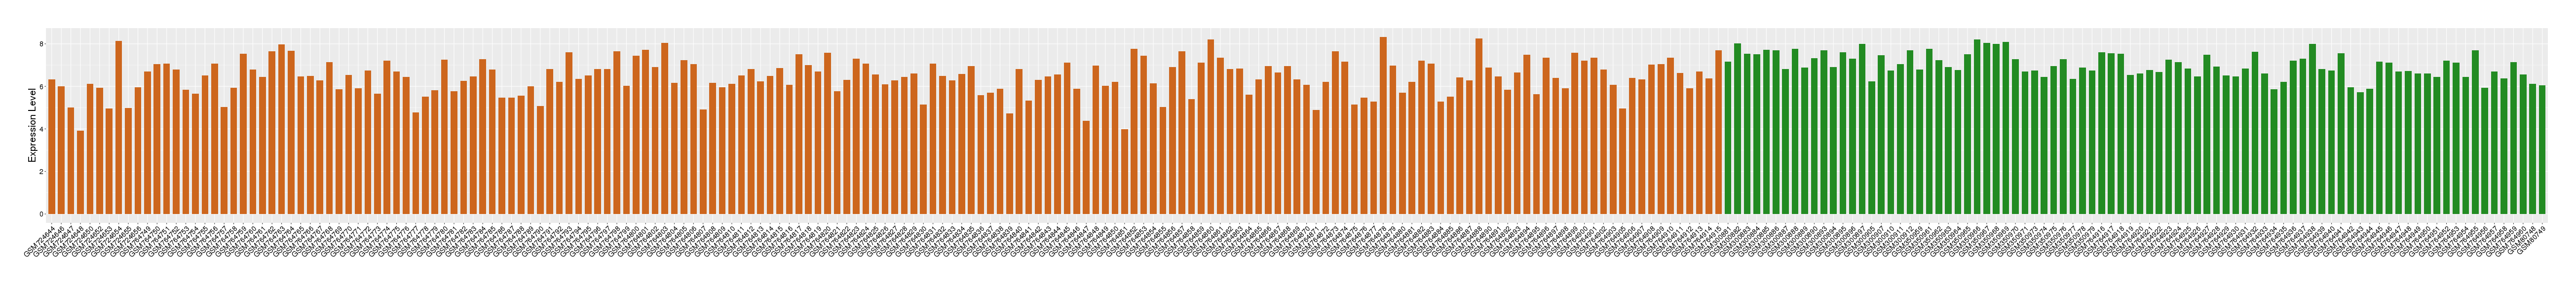
| Disease | Alzheimer's disease | ||||
| Example drug | PLX-3397 | Phase 3 | [5], [3] | ||
| Tissue | Entorhinal cortex | ||||
| Level of differential expression between the patients in the disease section of the tissue and the tissues of healthy individual | Fold-change: -0.10 Z-score: -0.14 P-value: 2.06E-01 |
||||
|
Target gene expression profiles of the patients in the disease section of the tissue
Target gene expression profiles in the tissue of healthy individual
|
|||||
| Disease | Rectal cancer | ||||
| Example drug | Imatinib | Phase 3 | [1], [2], [3] | ||
| Tissue | Rectal colon tissue | ||||
| Level of differential expression between the patients in the disease section of the tissue and the tissues of healthy individual | Fold-change: -1.49 Z-score: -3.60 P-value: 9.00E-05 |
||||
| Level of differential expression between the patients in the disease section of the tissue and the patients in the normal section of the tissue adjacent to the disease section | Fold-change: -1.16 Z-score: -4.48 P-value: 1.04E-06 |
||||
|
Target gene expression profiles of the patients in the disease section of the tissue
Target gene expression profiles of the patients in the normal section of the tissue adjacent to the disease section
Target gene expression profiles in the tissue of healthy individual
|
|||||
| Disease | Breast cancer | ||||
| Example drug | Sorafenib | Phase 2 | [6], [7], [3] | ||
| Tissue | Breast tissue | ||||
| Level of differential expression between the patients in the disease section of the tissue and the tissues of healthy individual | Fold-change: -2.83 Z-score: -2.30 P-value: 1.89E-108 |
||||
| Level of differential expression between the patients in the disease section of the tissue and the patients in the normal section of the tissue adjacent to the disease section | Fold-change: -2.63 Z-score: -1.77 P-value: 2.46E-14 |
||||
|
Target gene expression profiles of the patients in the disease section of the tissue
Target gene expression profiles of the patients in the normal section of the tissue adjacent to the disease section
Target gene expression profiles in the tissue of healthy individual

|
|||||
| Disease | Head and neck cancer | ||||
| Example drug | Sorafenib | Phase 2 | [6], [7], [3] | ||
| Tissue | Head and neck tissue | ||||
| Level of differential expression between the patients in the disease section of the tissue and the tissues of healthy individual | Fold-change: -0.44 Z-score: -0.75 P-value: 1.26E-09 |
||||
|
Target gene expression profiles of the patients in the disease section of the tissue
Target gene expression profiles in the tissue of healthy individual
|
|||||
| Disease | Lung cancer | ||||
| Example drug | Imatinib | Phase 2 | [1], [2], [3] | ||
| Tissue | Lung tissue | ||||
| Level of differential expression between the patients in the disease section of the tissue and the tissues of healthy individual | Fold-change: -0.78 Z-score: -1.33 P-value: 2.26E-22 |
||||
| Level of differential expression between the patients in the disease section of the tissue and the patients in the normal section of the tissue adjacent to the disease section | Fold-change: -0.91 Z-score: -1.19 P-value: 1.80E-18 |
||||
|
Target gene expression profiles of the patients in the disease section of the tissue
Target gene expression profiles of the patients in the normal section of the tissue adjacent to the disease section
Target gene expression profiles in the tissue of healthy individual

|
|||||
| Disease | Gastric cancer | ||||
| Tissue | Gastric tissue | ||||
| Level of differential expression between the patients in the disease section of the tissue and the tissues of healthy individual | Fold-change: -1.17 Z-score: -7.37 P-value: 3.70E-04 |
||||
| Level of differential expression between the patients in the disease section of the tissue and the patients in the normal section of the tissue adjacent to the disease section | Fold-change: -1.47 Z-score: -1.56 P-value: 7.06E-04 |
||||
|
Target gene expression profiles of the patients in the disease section of the tissue
Target gene expression profiles of the patients in the normal section of the tissue adjacent to the disease section
Target gene expression profiles in the tissue of healthy individual

|
|||||
| Disease | Myelodysplastic syndromes | ||||
| Tissue | Bone marrow | ||||
| Level of differential expression between the patients in the disease section of the tissue and the tissues of healthy individual | Fold-change: 0.12 Z-score: 0.37 P-value: 1.01E-02 |
||||
| Level of differential expression between the patients in the disease section of the tissue and the patients in the normal section of the tissue adjacent to the disease section | Fold-change: 5.26 Z-score: 3.69 P-value: 5.81E-03 |
||||
|
Target gene expression profiles of the patients in the disease section of the tissue
Target gene expression profiles of the patients in the normal section of the tissue adjacent to the disease section
Target gene expression profiles in the tissue of healthy individual

|
|||||
| Disease | Ovarian cancer | ||||
| Tissue | Ovarian tissue | ||||
| Level of differential expression between the patients in the disease section of the tissue and the tissues of healthy individual | Fold-change: -2.87 Z-score: -1.97 P-value: 3.50E-04 |
||||
| Level of differential expression between the patients in the disease section of the tissue and the patients in the normal section of the tissue adjacent to the disease section | Fold-change: 0.08 Z-score: 0.08 P-value: 5.87E-01 |
||||
|
Target gene expression profiles of the patients in the disease section of the tissue
Target gene expression profiles of the patients in the normal section of the tissue adjacent to the disease section
Target gene expression profiles in the tissue of healthy individual

|
|||||
| Disease | Thyroid cancer | ||||
| Tissue | Thyroid | ||||
| Level of differential expression between the patients in the disease section of the tissue and the tissues of healthy individual | Fold-change: -3.47 Z-score: -5.35 P-value: 3.35E-88 |
||||
| Level of differential expression between the patients in the disease section of the tissue and the patients in the normal section of the tissue adjacent to the disease section | Fold-change: -3.04 Z-score: -5.97 P-value: 1.89E-52 |
||||
|
Target gene expression profiles of the patients in the disease section of the tissue
Target gene expression profiles of the patients in the normal section of the tissue adjacent to the disease section
Target gene expression profiles in the tissue of healthy individual

|
|||||
| Target Gene Expression Profiles in Other Tissues of Healthy Individuals | |||||
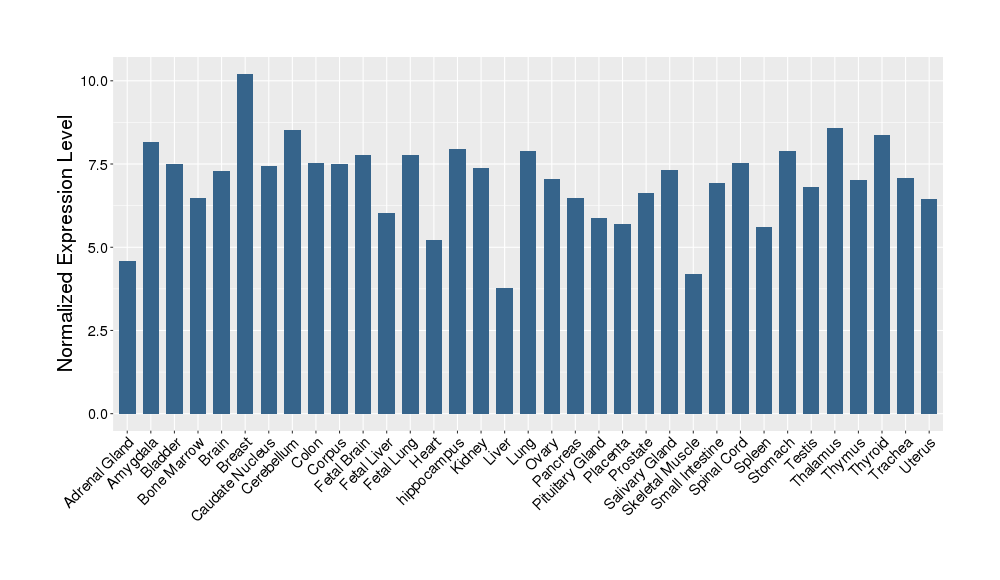
|
|||||
| Reference | |||||
| REF 1 | Emerging treatments for pulmonary arterial hypertension. Expert Opin Emerg Drugs. 2006 Nov;11(4):609-19. | ||||
| REF 2 | (http://www.guidetopharmacology.org/) Nucleic Acids Res. 2015 Oct 12. pii: gkv1037. The IUPHAR/BPS Guide to PHARMACOLOGY in 2016: towards curated quantitative interactions between 1300 protein targets and 6000 ligands. (Ligand id: 5687). | ||||
| REF 3 | NCBI GEO: archive for functional genomics data sets--update. | ||||
| REF 4 | Hughes B: 2009 FDA drug approvals. Nat Rev Drug Discov. 2010 Feb;9(2):89-92. | ||||
| REF 5 | ClinicalTrials.gov (NCT02371369) PLX3397 Phase 3 Study for Pigmented Villonodular Synovitis (PVNS) or Giant Cell Tumor of the Tendon Sheath (GCT-TS). U.S. National Institutes of Health. | ||||
| REF 6 | Sorafenib (BAY 43-9006, Nexavar), a dual-action inhibitor that targets RAF/MEK/ERK pathway in tumor cells and tyrosine kinases VEGFR/PDGFR in tumor vasculature. Methods Enzymol. 2006;407:597-612. | ||||
| REF 7 | (http://www.guidetopharmacology.org/) Nucleic Acids Res. 2015 Oct 12. pii: gkv1037. The IUPHAR/BPS Guide to PHARMACOLOGY in 2016: towards curated quantitative interactions between 1300 protein targets and 6000 ligands. (Ligand id: 5711). | ||||
If You Find Any Error in Data or Bug in Web Service, Please Kindly Report It to Dr. Zhou and Dr. Zhang.