

Target expression details
| Target General Information | |||||
|---|---|---|---|---|---|
| Target ID | T60631 | ||||
| Target Name | RET proto oncogene | ||||
| Synonyms | C-ret; RET receptor tyrosine kinase; RET | ||||
| Target Type | Successful | ||||
| Gene Name | RET | ||||
| Biochemical Class | Kinase | ||||
| UniProt ID | RET_HUMAN | ||||
| Target Gene Expression Profiles in the Disease-Relevant Drug Targeted Tissue of the Patients and Healthy Individuals | |||||
| Disease | Rectal cancer | ||||
| Example drug | Regorafenib | Approved | [1], [2], [3] | ||
| Tissue | Rectal colon tissue | ||||
| Level of differential expression between the patients in the disease section of the tissue and the tissues of healthy individual | Fold-change: -0.23 Z-score: -1.17 P-value: 3.48E-02 |
||||
| Level of differential expression between the patients in the disease section of the tissue and the patients in the normal section of the tissue adjacent to the disease section | Fold-change: -0.40 Z-score: -1.07 P-value: 5.82E-02 |
||||
|
Target gene expression profiles of the patients in the disease section of the tissue
Target gene expression profiles of the patients in the normal section of the tissue adjacent to the disease section
Target gene expression profiles in the tissue of healthy individual
|
|||||
| Disease | Acute myelocytic leukemia | ||||
| Tissue | Bone marrow | ||||
| Level of differential expression between the patients in the disease section of the tissue and the tissues of healthy individual | Fold-change: 0.15 Z-score: 0.50 P-value: 5.83E-05 |
||||
|
Target gene expression profiles of the patients in the disease section of the tissue
Target gene expression profiles in the tissue of healthy individual

|
|||||
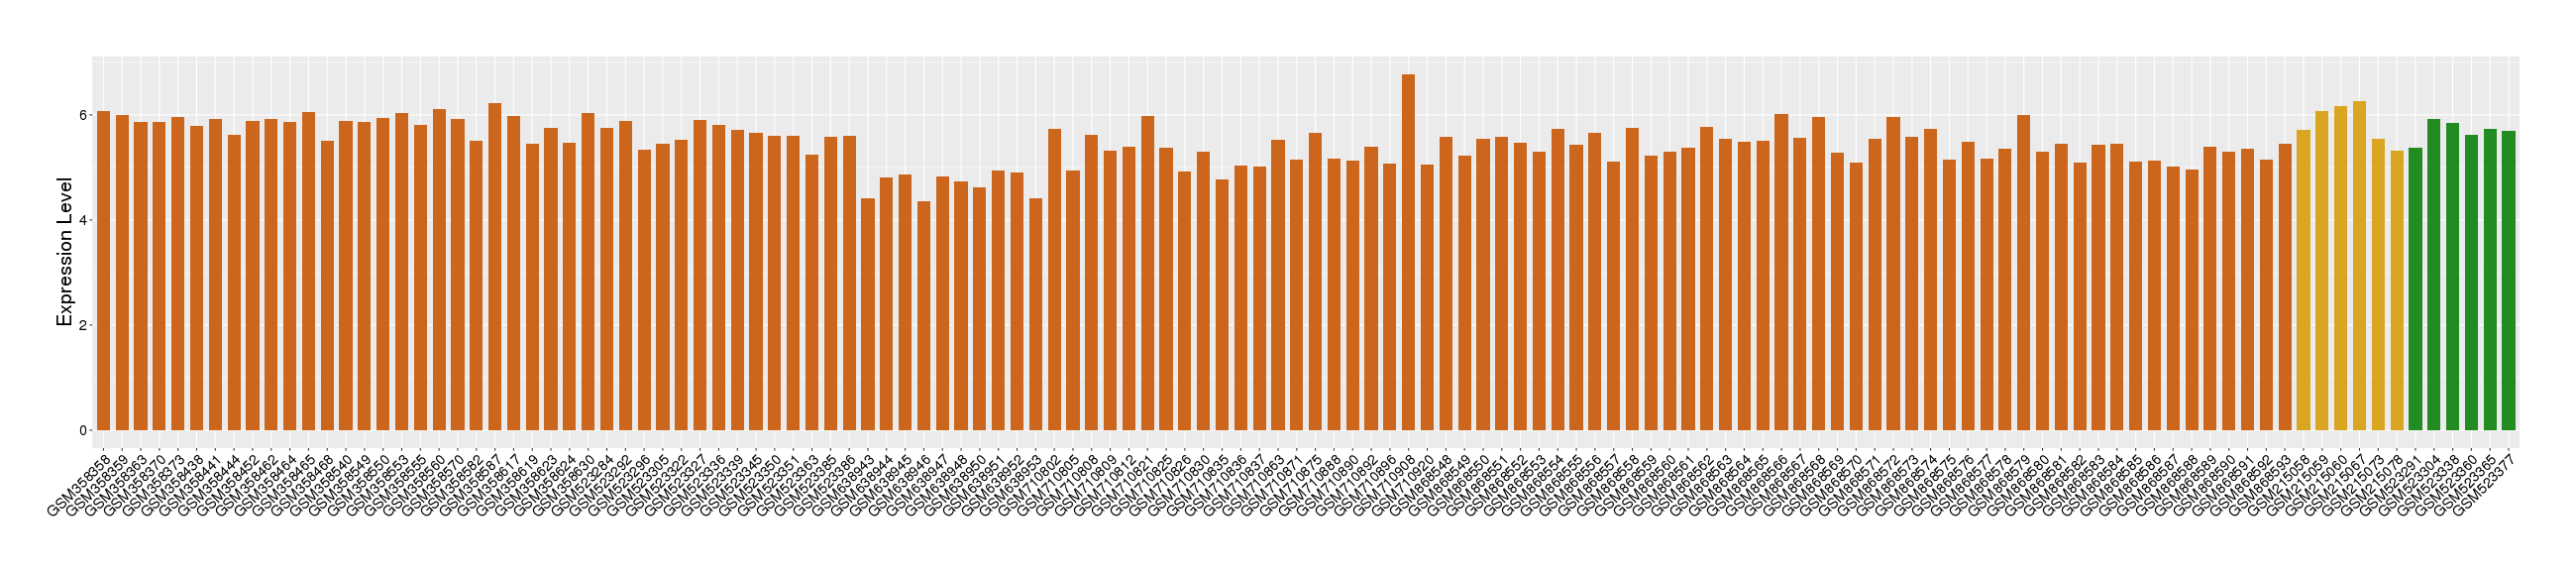
| Disease | Breast cancer | ||||
| Tissue | Breast tissue | ||||
| Level of differential expression between the patients in the disease section of the tissue and the tissues of healthy individual | Fold-change: 0.64 Z-score: 1.56 P-value: 5.81E-76 |
||||
| Level of differential expression between the patients in the disease section of the tissue and the patients in the normal section of the tissue adjacent to the disease section | Fold-change: 0.48 Z-score: 0.97 P-value: 4.28E-13 |
||||
|
Target gene expression profiles of the patients in the disease section of the tissue
Target gene expression profiles of the patients in the normal section of the tissue adjacent to the disease section
Target gene expression profiles in the tissue of healthy individual

|
|||||
| Disease | Gastric cancer | ||||
| Tissue | Gastric tissue | ||||
| Level of differential expression between the patients in the disease section of the tissue and the tissues of healthy individual | Fold-change: -0.48 Z-score: -1.16 P-value: 4.93E-01 |
||||
| Level of differential expression between the patients in the disease section of the tissue and the patients in the normal section of the tissue adjacent to the disease section | Fold-change: 0.36 Z-score: 0.88 P-value: 3.26E-03 |
||||
|
Target gene expression profiles of the patients in the disease section of the tissue
Target gene expression profiles of the patients in the normal section of the tissue adjacent to the disease section
Target gene expression profiles in the tissue of healthy individual

|
|||||
| Disease | Head and neck cancer | ||||
| Tissue | Head and neck tissue | ||||
| Level of differential expression between the patients in the disease section of the tissue and the tissues of healthy individual | Fold-change: 0.05 Z-score: 0.19 P-value: 2.64E-03 |
||||
|
Target gene expression profiles of the patients in the disease section of the tissue
Target gene expression profiles in the tissue of healthy individual
|
|||||
| Disease | Lateral sclerosis | ||||
| Tissue | Cervical spinal cord | ||||
| Level of differential expression between the patients in the disease section of the tissue and the tissues of healthy individual | Fold-change: -0.36 Z-score: -0.48 P-value: 9.18E-01 |
||||
|
Target gene expression profiles of the patients in the disease section of the tissue
Target gene expression profiles in the tissue of healthy individual
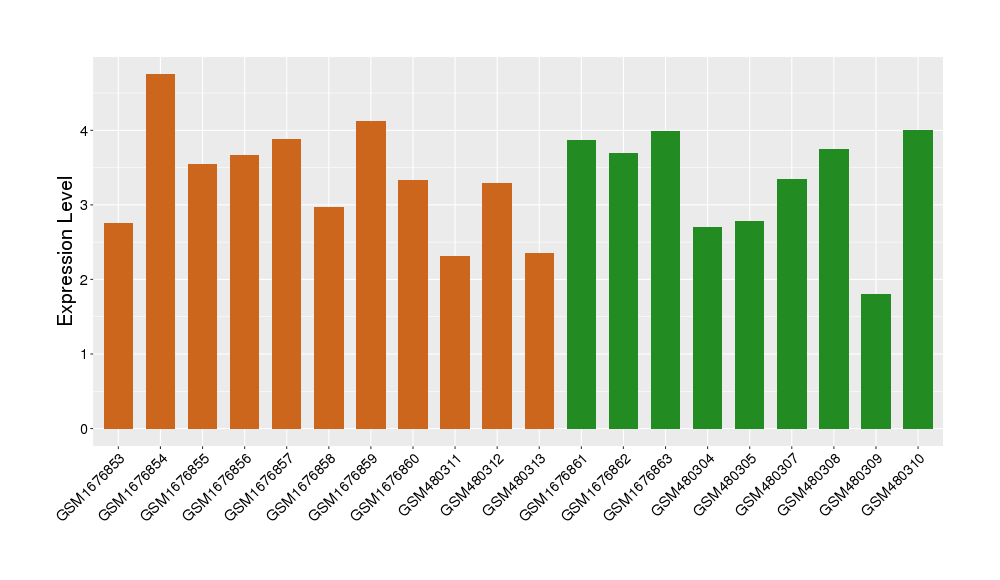
|
|||||
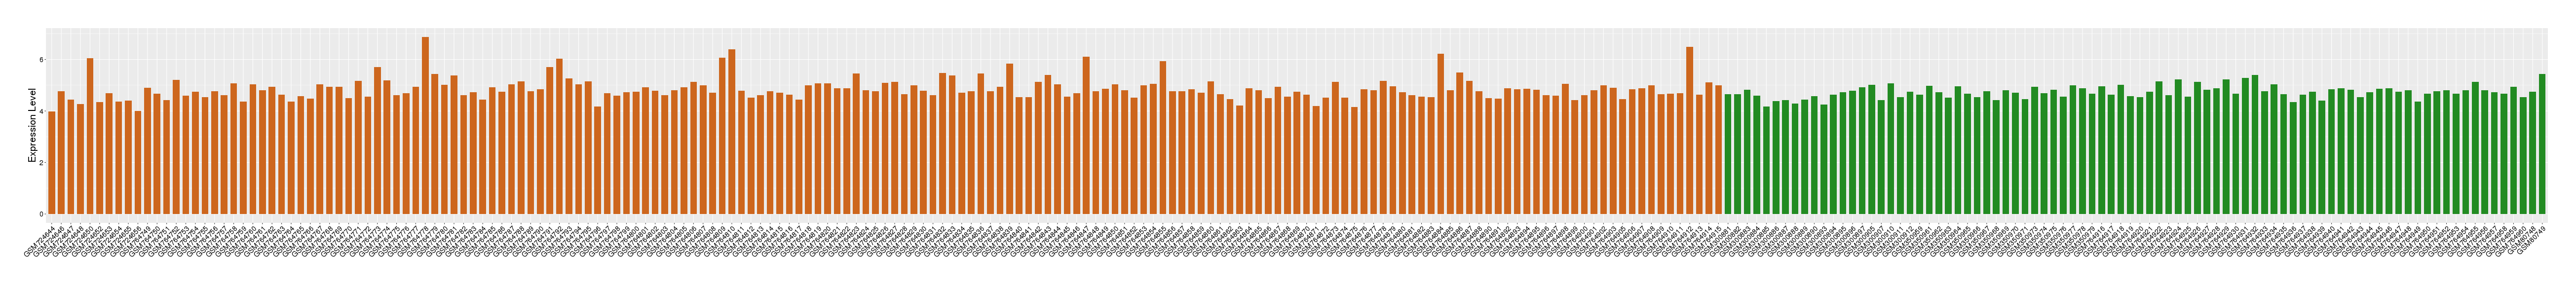
| Disease | Lung cancer | ||||
| Tissue | Lung tissue | ||||
| Level of differential expression between the patients in the disease section of the tissue and the tissues of healthy individual | Fold-change: 0.03 Z-score: 0.11 P-value: 3.31E-11 |
||||
| Level of differential expression between the patients in the disease section of the tissue and the patients in the normal section of the tissue adjacent to the disease section | Fold-change: -0.02 Z-score: -0.05 P-value: 2.13E-05 |
||||
|
Target gene expression profiles of the patients in the disease section of the tissue
Target gene expression profiles of the patients in the normal section of the tissue adjacent to the disease section
Target gene expression profiles in the tissue of healthy individual

|
|||||
| Disease | Myelodysplastic syndromes | ||||
| Tissue | Bone marrow | ||||
| Level of differential expression between the patients in the disease section of the tissue and the tissues of healthy individual | Fold-change: 1.05E-02 Z-score: 0.03 P-value: 2.22E-01 |
||||
| Level of differential expression between the patients in the disease section of the tissue and the patients in the normal section of the tissue adjacent to the disease section | Fold-change: -0.28 Z-score: -1.43 P-value: 7.24E-02 |
||||
|
Target gene expression profiles of the patients in the disease section of the tissue
Target gene expression profiles of the patients in the normal section of the tissue adjacent to the disease section
Target gene expression profiles in the tissue of healthy individual

|
|||||
| Disease | Ovarian cancer | ||||
| Tissue | Ovarian tissue | ||||
| Level of differential expression between the patients in the disease section of the tissue and the tissues of healthy individual | Fold-change: -0.03 Z-score: -0.11 P-value: 2.42E-01 |
||||
| Level of differential expression between the patients in the disease section of the tissue and the patients in the normal section of the tissue adjacent to the disease section | Fold-change: -0.16 Z-score: -0.40 P-value: 6.76E-01 |
||||
|
Target gene expression profiles of the patients in the disease section of the tissue
Target gene expression profiles of the patients in the normal section of the tissue adjacent to the disease section
Target gene expression profiles in the tissue of healthy individual

|
|||||
| Disease | Renal cancer | ||||
| Tissue | Kidney | ||||
| Level of differential expression between the patients in the disease section of the tissue and the tissues of healthy individual | Fold-change: -0.24 Z-score: -0.46 P-value: 2.51E-02 |
||||
| Level of differential expression between the patients in the disease section of the tissue and the patients in the normal section of the tissue adjacent to the disease section | Fold-change: -0.25 Z-score: -0.60 P-value: 5.05E-02 |
||||
|
Target gene expression profiles of the patients in the disease section of the tissue
Target gene expression profiles of the patients in the normal section of the tissue adjacent to the disease section
Target gene expression profiles in the tissue of healthy individual

|
|||||
| Disease | Thyroid cancer | ||||
| Tissue | Thyroid | ||||
| Level of differential expression between the patients in the disease section of the tissue and the tissues of healthy individual | Fold-change: 0.09 Z-score: 0.23 P-value: 1.04E-09 |
||||
| Level of differential expression between the patients in the disease section of the tissue and the patients in the normal section of the tissue adjacent to the disease section | Fold-change: 0.07 Z-score: 0.15 P-value: 2.49E-04 |
||||
|
Target gene expression profiles of the patients in the disease section of the tissue
Target gene expression profiles of the patients in the normal section of the tissue adjacent to the disease section
Target gene expression profiles in the tissue of healthy individual

|
|||||
| Target Gene Expression Profiles in Other Tissues of Healthy Individuals | |||||
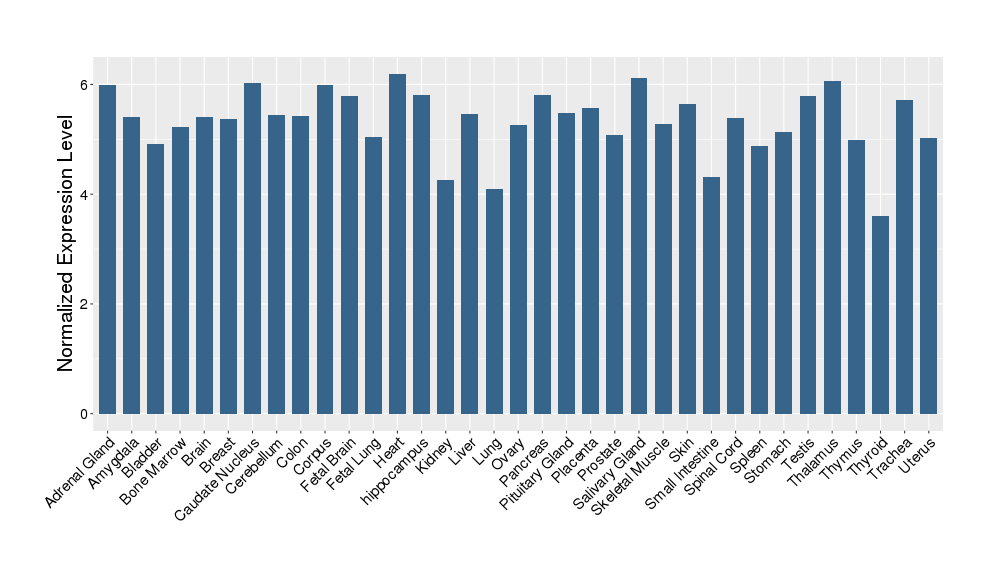
|
|||||
| Reference | |||||
| REF 1 | Nat Rev Drug Discov. 2013 Feb;12(2):87-90. | ||||
| REF 2 | (http://www.guidetopharmacology.org/) Nucleic Acids Res. 2015 Oct 12. pii: gkv1037. The IUPHAR/BPS Guide to PHARMACOLOGY in 2016: towards curated quantitative interactions between 1300 protein targets and 6000 ligands. (Ligand id: 5891). | ||||
| REF 3 | NCBI GEO: archive for functional genomics data sets--update. | ||||
If You Find Any Error in Data or Bug in Web Service, Please Kindly Report It to Dr. Zhou and Dr. Zhang.