

Target expression details
| Target General Information | |||||
|---|---|---|---|---|---|
| Target ID | T78114 | ||||
| Target Name | Complement decay-accelerating factor | ||||
| Synonyms | Complement decayaccelerating factor; CD55 | ||||
| Target Type | Clinical Trial | ||||
| Gene Name | CD55 | ||||
| Biochemical Class | Receptor of complement activation | ||||
| UniProt ID | DAF_HUMAN | ||||
| Target Gene Expression Profiles in the Disease-Relevant Drug Targeted Tissue of the Patients and Healthy Individuals | |||||
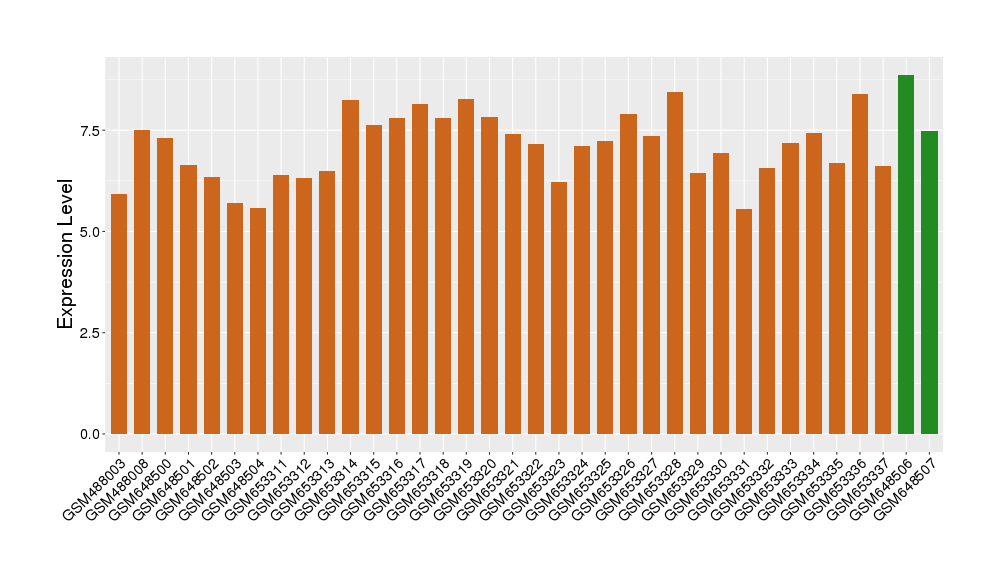
| Disease | Gastric cancer | ||||
| Example drug | PAT-SC1 | Phase 1/2 | [547138], [1572592] | ||
| Tissue | Gastric tissue | ||||
| Level of differential expression between the patients in the disease section of the tissue and the tissues of healthy individual | Fold-change: 2.16 Z-score: 3.38 P-value: 2.44E-02 |
||||
| Level of differential expression between the patients in the disease section of the tissue and the patients in the normal section of the tissue adjacent to the disease section | Fold-change: 0.81 Z-score: 0.79 P-value: 2.51E-01 |
||||
|
Target gene expression profiles of the patients in the disease section of the tissue
Target gene expression profiles of the patients in the normal section of the tissue adjacent to the disease section
Target gene expression profiles in the tissue of healthy individual

|
|||||
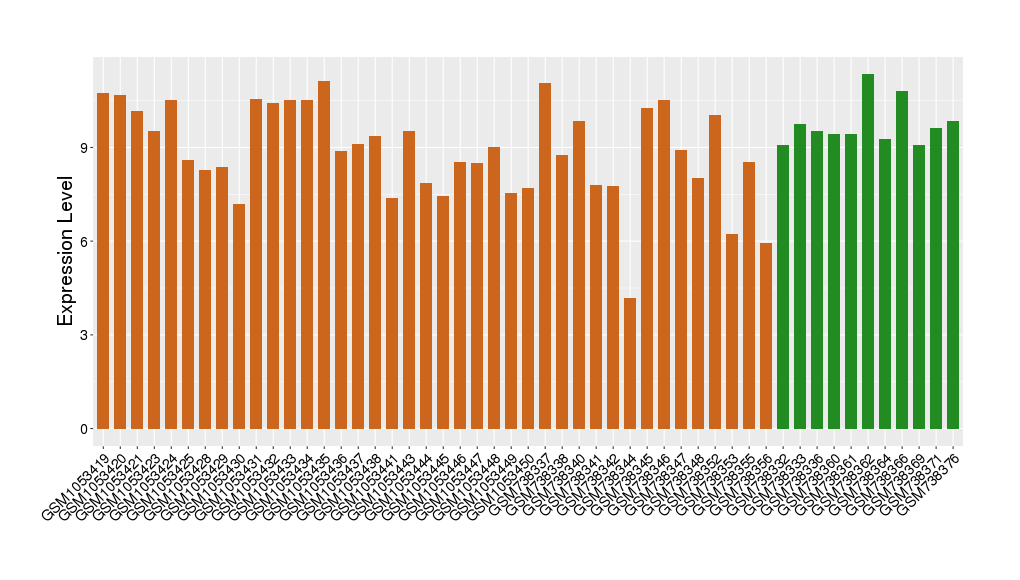
| Disease | Glioma | ||||
| Tissue | Brainstem tissue | ||||
| Level of differential expression between the patients in the disease section of the tissue and the tissues of healthy individual | Fold-change: -1.01 Z-score: -1.02 P-value: 3.50E-01 |
||||
|
Target gene expression profiles of the patients in the disease section of the tissue
Target gene expression profiles in the tissue of healthy individual
|
|||||
| Disease | Glioma | ||||
| Tissue | White matter | ||||
| Level of differential expression between the patients in the disease section of the tissue and the tissues of healthy individual | Fold-change: -0.62 Z-score: -0.87 P-value: 1.38E-02 |
||||
|
Target gene expression profiles of the patients in the disease section of the tissue
Target gene expression profiles in the tissue of healthy individual
|
|||||
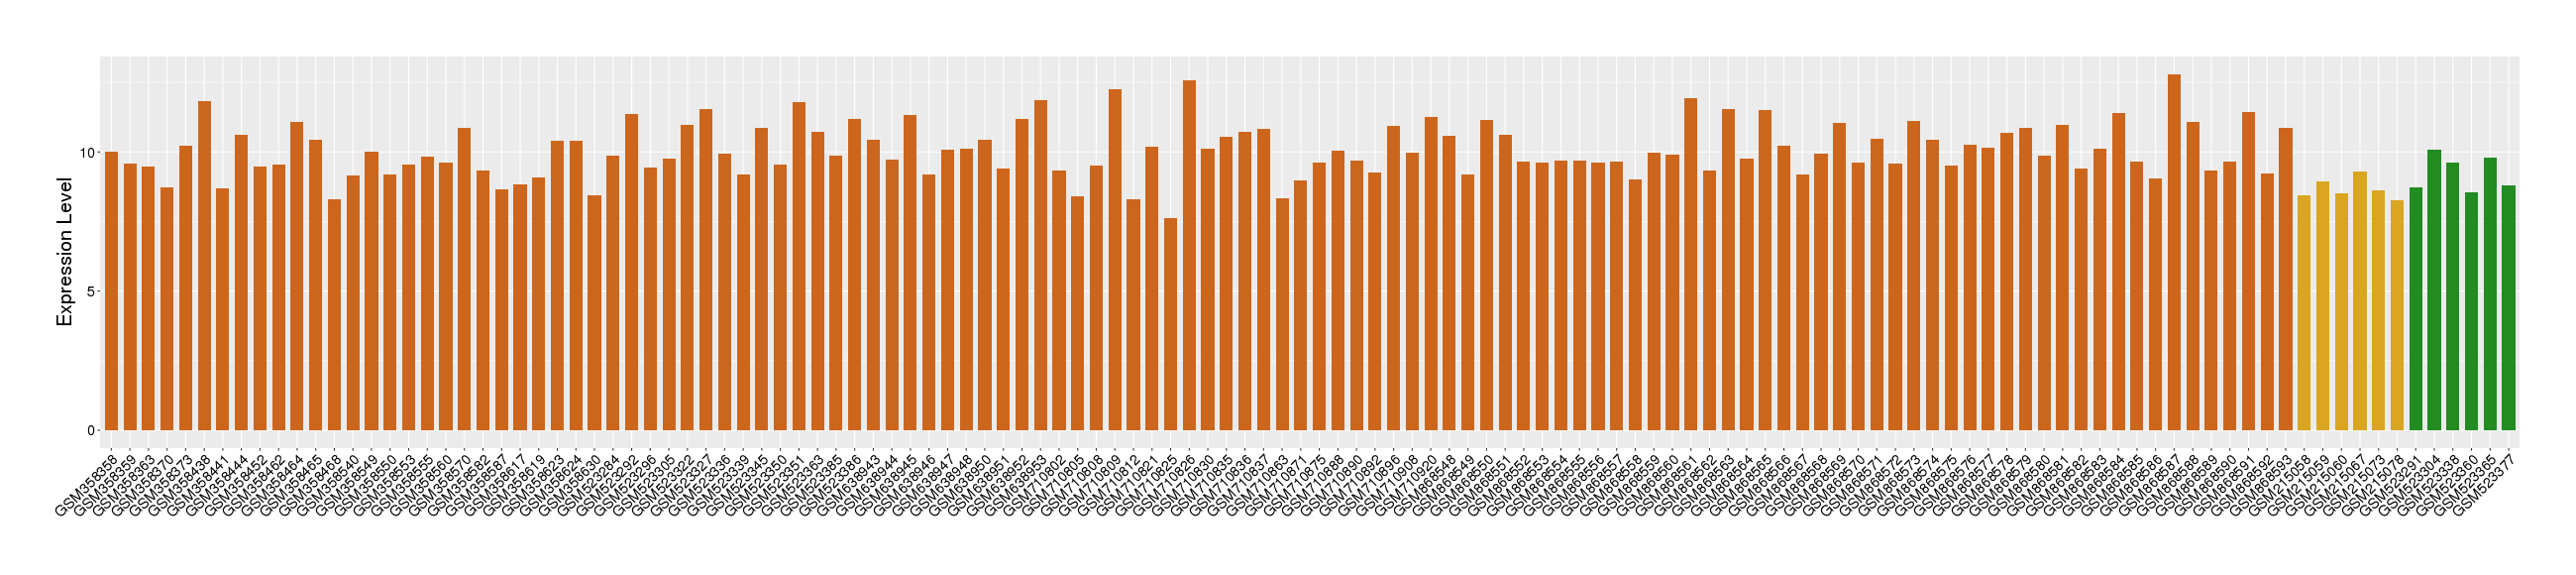
| Disease | Rectal cancer | ||||
| Tissue | Rectal colon tissue | ||||
| Level of differential expression between the patients in the disease section of the tissue and the tissues of healthy individual | Fold-change: 0.74 Z-score: 1.15 P-value: 2.29E-02 |
||||
| Level of differential expression between the patients in the disease section of the tissue and the patients in the normal section of the tissue adjacent to the disease section | Fold-change: 1.38 Z-score: 3.67 P-value: 2.55E-05 |
||||
|
Target gene expression profiles of the patients in the disease section of the tissue
Target gene expression profiles of the patients in the normal section of the tissue adjacent to the disease section
Target gene expression profiles in the tissue of healthy individual
|
|||||
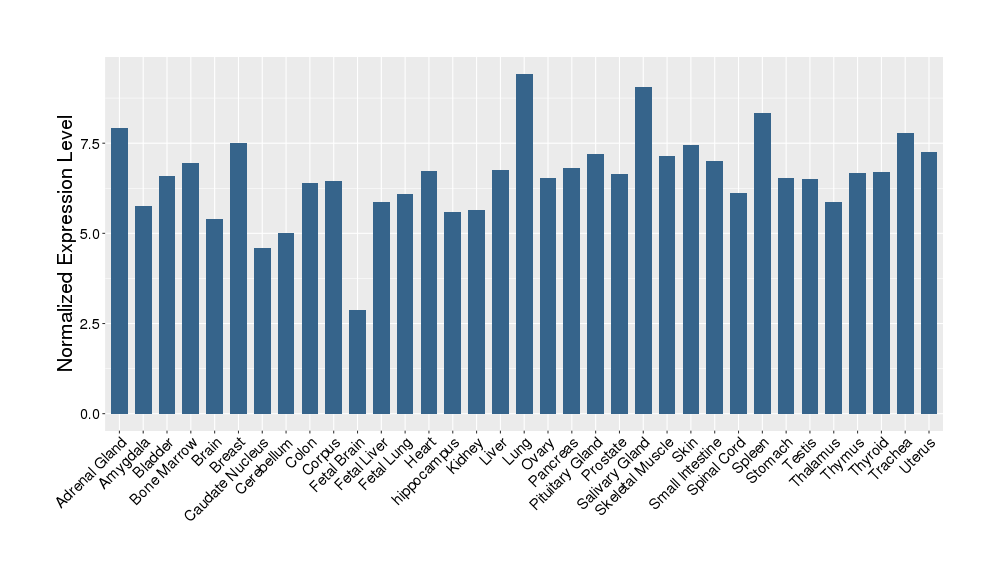
| Target Gene Expression Profiles in Other Tissues of Healthy Individuals | |||||
|
|||||
If You Find Any Error in Data or Bug in Web Service, Please Kindly Report It to Dr. Zhou and Dr. Zhang.