

Target expression details
| Target General Information | |||||
|---|---|---|---|---|---|
| Target ID | T80975 | ||||
| Target Name | VEGF-2 receptor | ||||
| Synonyms | VEGFR-2; VEGFR2; Fetal liver kinase 1; FLK-1; Kinase insert domain receptor; Protein-tyrosine kinase receptor flk-1; CD309; FLK1; VEGF-2 receptor; KDR | ||||
| Target Type | Successful | ||||
| Gene Name | KDR | ||||
| Biochemical Class | Kinase | ||||
| UniProt ID | VGFR2_HUMAN | ||||
| Target Gene Expression Profiles in the Disease-Relevant Drug Targeted Tissue of the Patients and Healthy Individuals | |||||
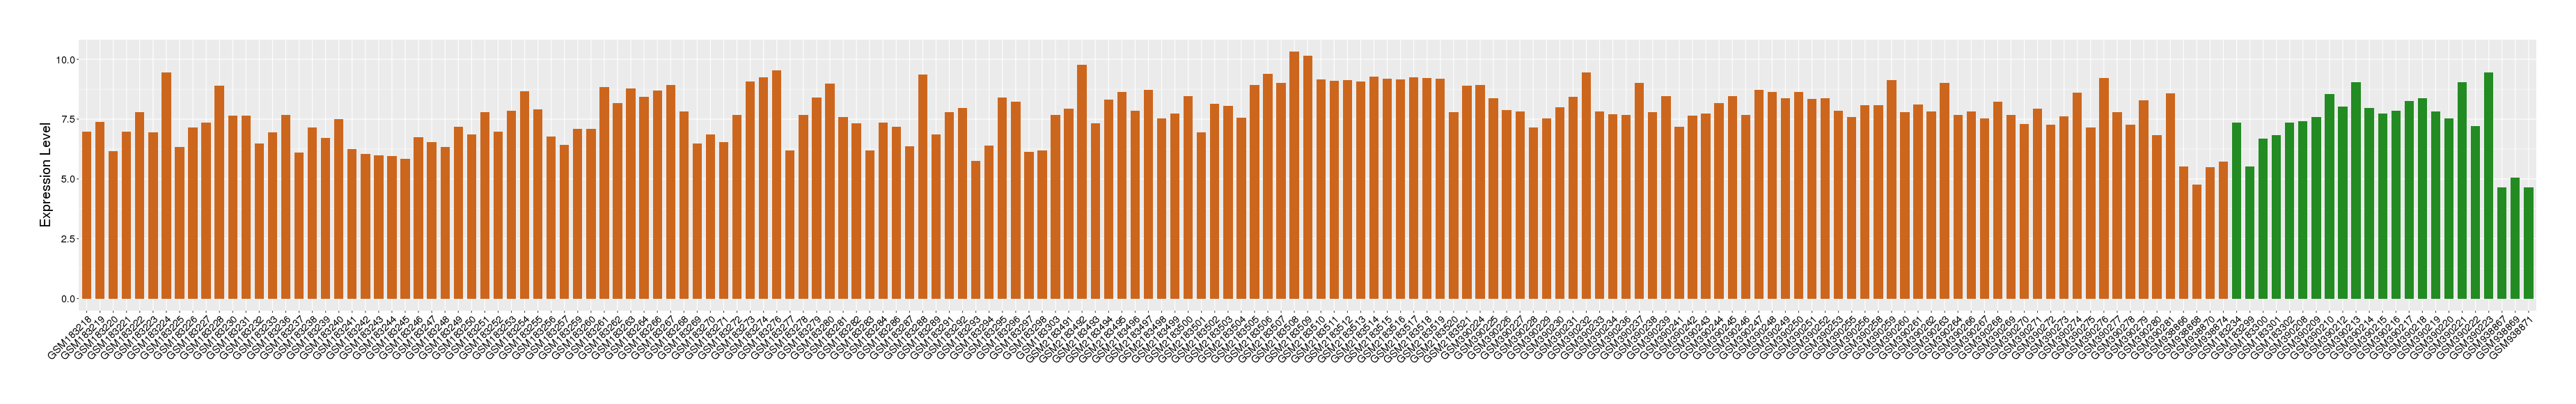
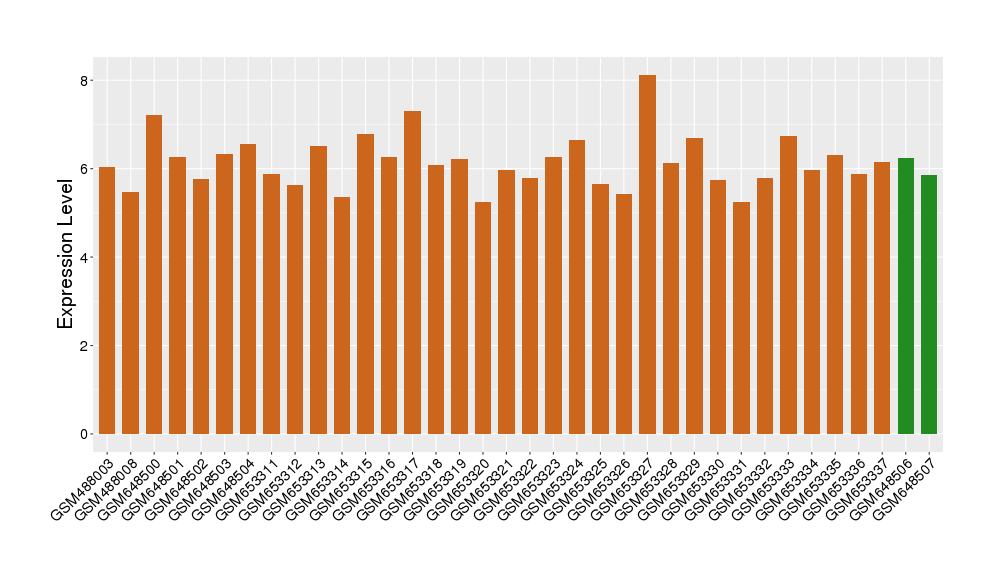
| Disease | Breast cancer | ||||
| Example drug | Apatinib | Approved | [1], [2], [3], [4] | ||
| Tissue | Breast tissue | ||||
| Level of differential expression between the patients in the disease section of the tissue and the tissues of healthy individual | Fold-change: -0.71 Z-score: -0.79 P-value: 6.54E-27 |
||||
| Level of differential expression between the patients in the disease section of the tissue and the patients in the normal section of the tissue adjacent to the disease section | Fold-change: -0.86 Z-score: -1.16 P-value: 1.85E-09 |
||||
|
Target gene expression profiles of the patients in the disease section of the tissue
Target gene expression profiles of the patients in the normal section of the tissue adjacent to the disease section
Target gene expression profiles in the tissue of healthy individual

|
|||||
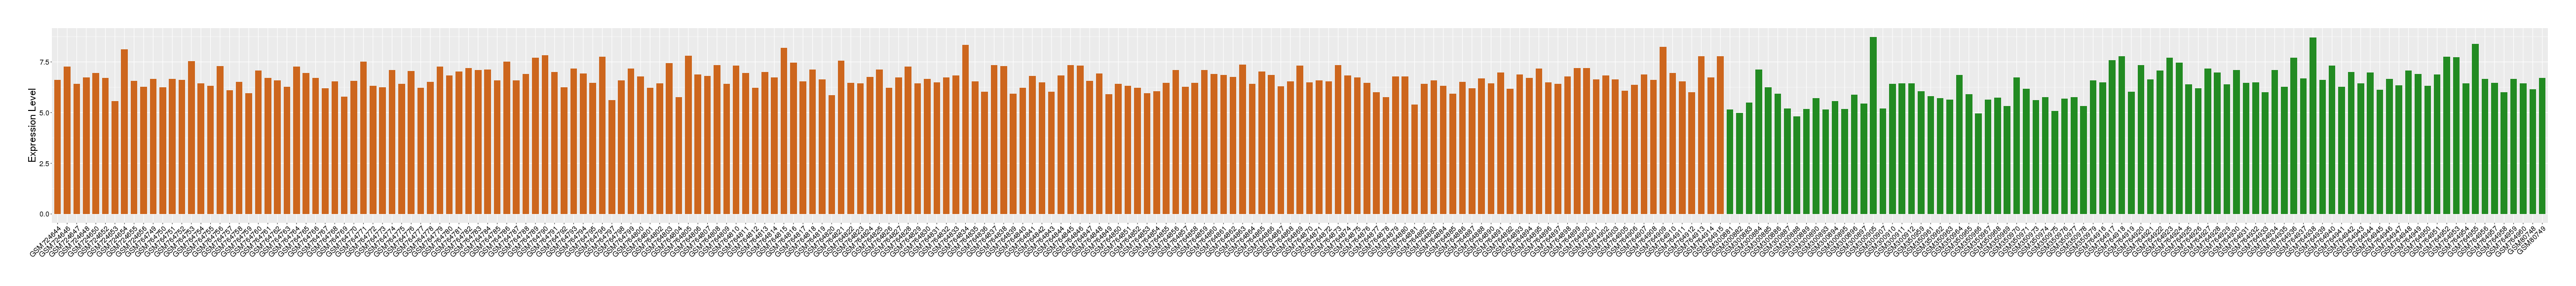
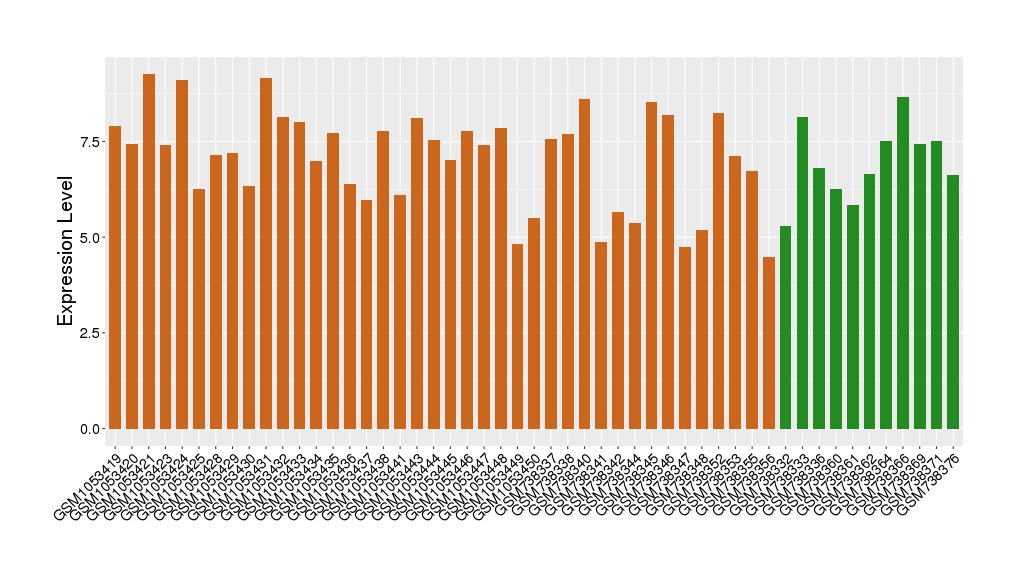
| Disease | Gastric cancer | ||||
| Example drug | Ramucirumab | Approved | [5], [6], [4] | ||
| Tissue | Gastric tissue | ||||
| Level of differential expression between the patients in the disease section of the tissue and the tissues of healthy individual | Fold-change: -0.21 Z-score: -1.00 P-value: 4.05E-01 |
||||
| Level of differential expression between the patients in the disease section of the tissue and the patients in the normal section of the tissue adjacent to the disease section | Fold-change: 0.48 Z-score: 1.00 P-value: 8.20E-04 |
||||
|
Target gene expression profiles of the patients in the disease section of the tissue
Target gene expression profiles of the patients in the normal section of the tissue adjacent to the disease section
Target gene expression profiles in the tissue of healthy individual

|
|||||
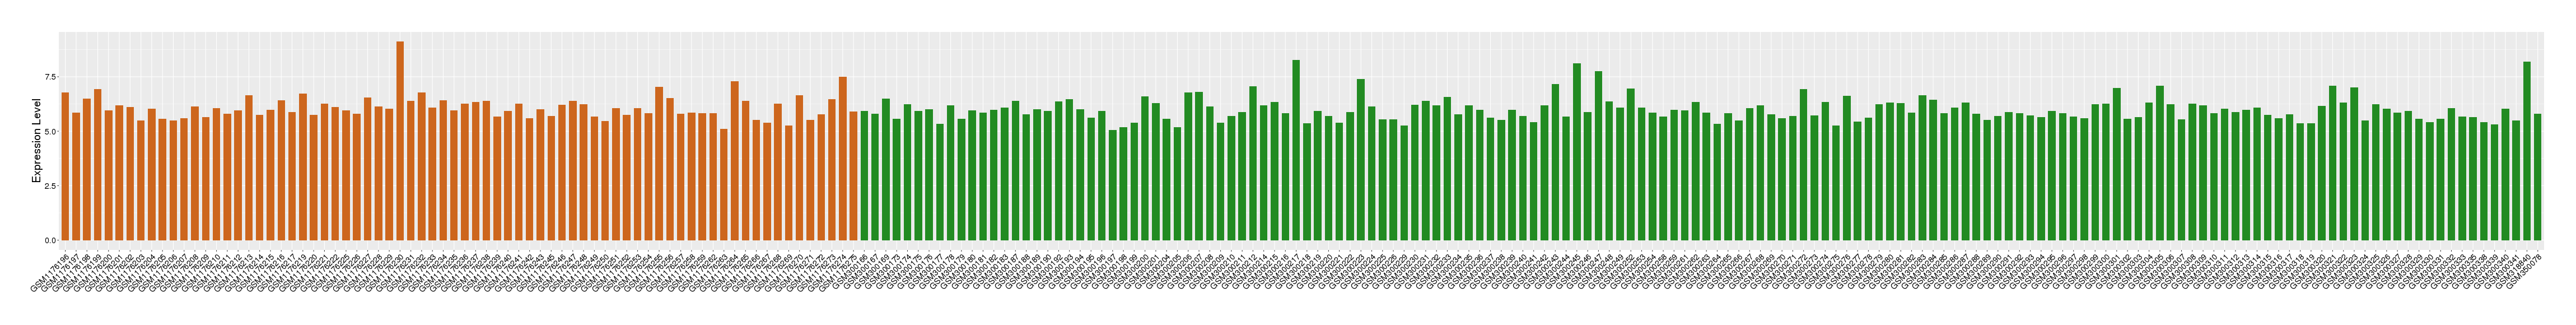
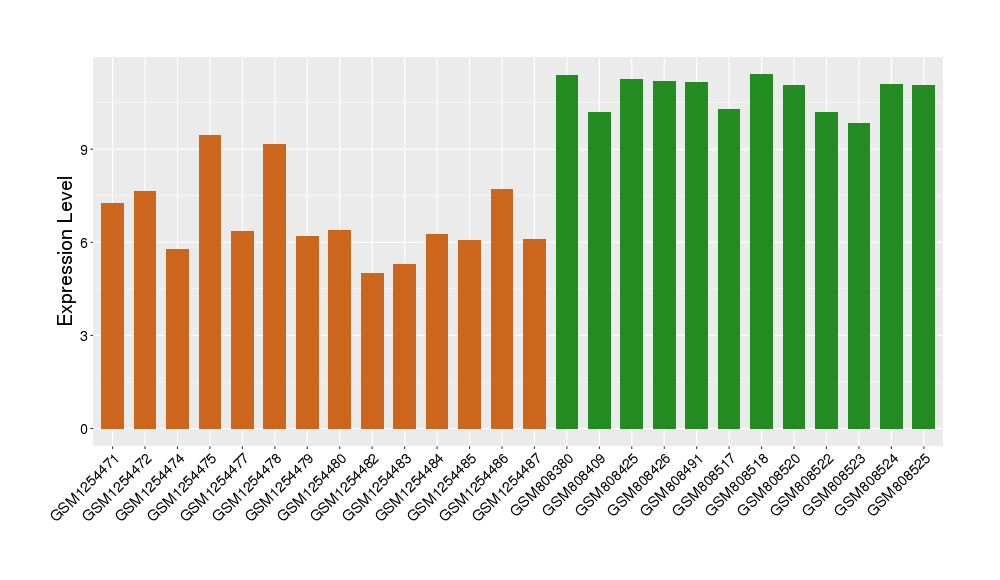
| Disease | Renal cancer | ||||
| Example drug | Pazopanib HCl | Approved | [7], [4] | ||
| Tissue | Kidney | ||||
| Level of differential expression between the patients in the disease section of the tissue and the tissues of healthy individual | Fold-change: 0.18 Z-score: 0.27 P-value: 7.90E-01 |
||||
| Level of differential expression between the patients in the disease section of the tissue and the patients in the normal section of the tissue adjacent to the disease section | Fold-change: 0.43 Z-score: 0.61 P-value: 2.12E-02 |
||||
|
Target gene expression profiles of the patients in the disease section of the tissue
Target gene expression profiles of the patients in the normal section of the tissue adjacent to the disease section
Target gene expression profiles in the tissue of healthy individual

|
|||||
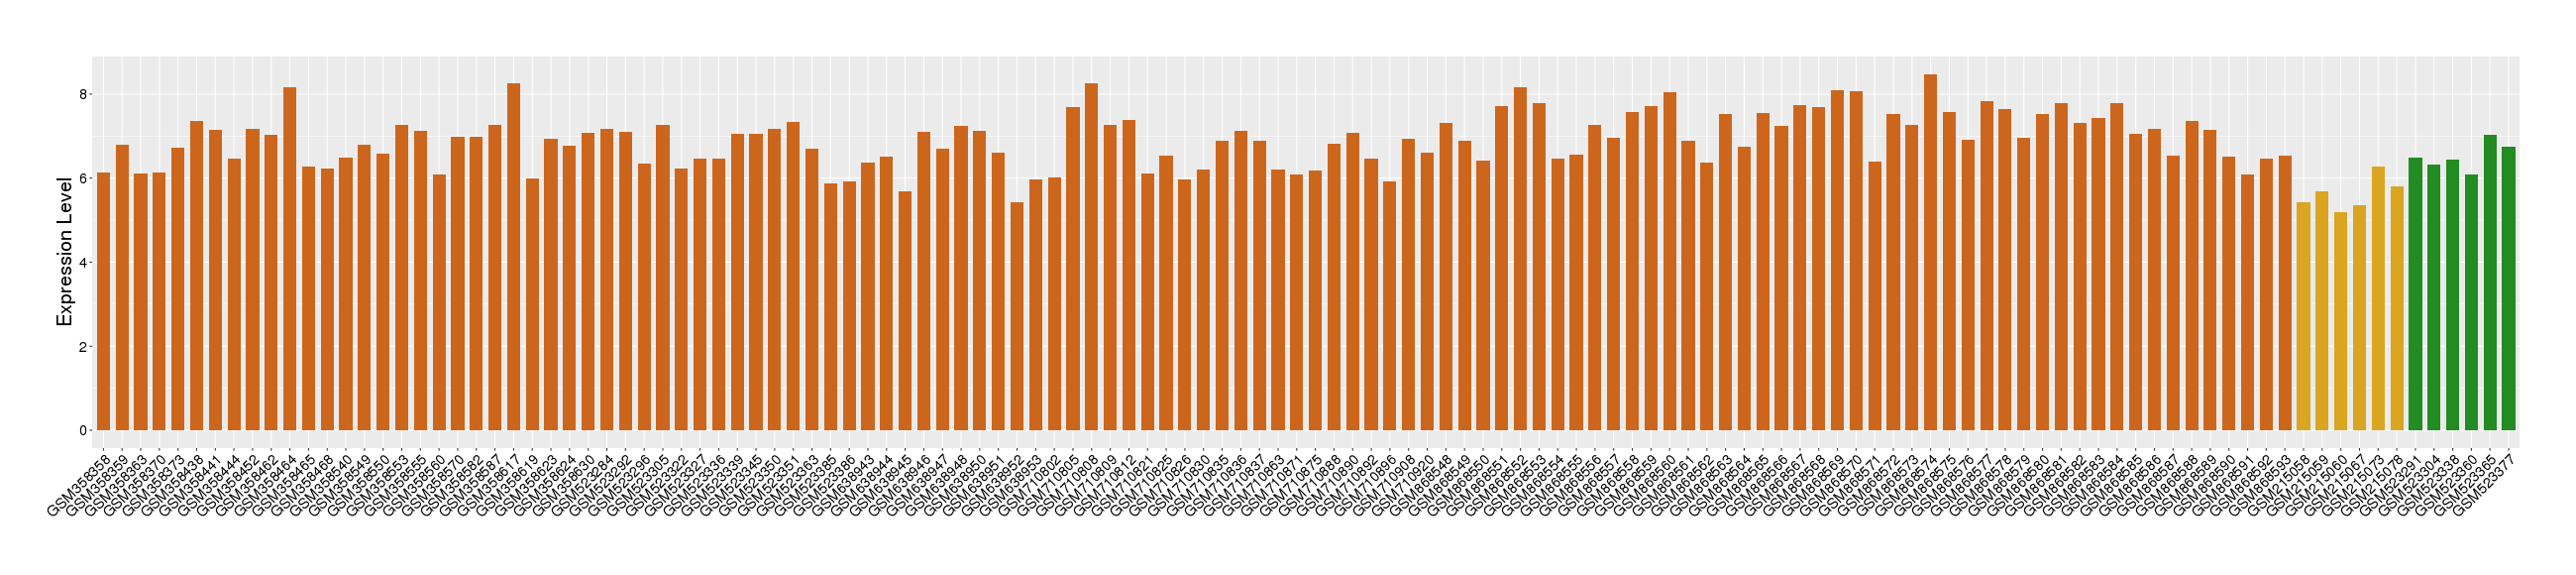
| Disease | Thyroid cancer | ||||
| Example drug | Cabozantinib | Approved | [8], [9], [4] | ||
| Tissue | Thyroid | ||||
| Level of differential expression between the patients in the disease section of the tissue and the tissues of healthy individual | Fold-change: 0.44 Z-score: 0.82 P-value: 1.50E-03 |
||||
| Level of differential expression between the patients in the disease section of the tissue and the patients in the normal section of the tissue adjacent to the disease section | Fold-change: -0.63 Z-score: -1.22 P-value: 8.77E-10 |
||||
|
Target gene expression profiles of the patients in the disease section of the tissue
Target gene expression profiles of the patients in the normal section of the tissue adjacent to the disease section
Target gene expression profiles in the tissue of healthy individual

|
|||||
| Disease | Liver cancer | ||||
| Example drug | Brivanib | Phase 3 | [10], [11], [4] | ||
| Tissue | Liver tissue | ||||
| Level of differential expression between the patients in the disease section of the tissue and the tissues of healthy individual | Fold-change: -0.77 Z-score: -1.40 P-value: 2.93E-13 |
||||
| Level of differential expression between the patients in the disease section of the tissue and the patients in the normal section of the tissue adjacent to the disease section | Fold-change: -0.35 Z-score: -0.55 P-value: 5.34E-10 |
||||
|
Target gene expression profiles of the patients in the disease section of the tissue
Target gene expression profiles of the patients in the normal section of the tissue adjacent to the disease section
Target gene expression profiles in the tissue of the persons with other diseases not directly affecting the tissue
Target gene expression profiles in the tissue of healthy individual

|
|||||
| Disease | Melanoma | ||||
| Example drug | Sorafenib | Phase 3 | [12], [13], [4] | ||
| Tissue | Skin | ||||
| Level of differential expression between the patients in the disease section of the tissue and the tissues of healthy individual | Fold-change: 0.20 Z-score: 0.15 P-value: 1.84E-01 |
||||
|
Target gene expression profiles of the patients in the disease section of the tissue
Target gene expression profiles in the tissue of healthy individual
|
|||||
| Disease | Ovarian cancer | ||||
| Example drug | Cediranib | Phase 3 | [14], [15], [4] | ||
| Tissue | Ovarian tissue | ||||
| Level of differential expression between the patients in the disease section of the tissue and the tissues of healthy individual | Fold-change: -0.29 Z-score: -0.43 P-value: 1.18E-01 |
||||
| Level of differential expression between the patients in the disease section of the tissue and the patients in the normal section of the tissue adjacent to the disease section | Fold-change: 0.16 Z-score: 0.06 P-value: 7.57E-02 |
||||
|
Target gene expression profiles of the patients in the disease section of the tissue
Target gene expression profiles of the patients in the normal section of the tissue adjacent to the disease section
Target gene expression profiles in the tissue of healthy individual

|
|||||
| Disease | Acute myelocytic leukemia | ||||
| Example drug | Sorafenib | Phase 2 | [12], [13], [4] | ||
| Tissue | Bone marrow | ||||
| Level of differential expression between the patients in the disease section of the tissue and the tissues of healthy individual | Fold-change: 0.03 Z-score: 0.14 P-value: 2.27E-01 |
||||
|
Target gene expression profiles of the patients in the disease section of the tissue
Target gene expression profiles in the tissue of healthy individual

|
|||||
| Disease | Head and neck cancer | ||||
| Example drug | Sorafenib | Phase 2 | [12], [13], [4] | ||
| Tissue | Head and neck tissue | ||||
| Level of differential expression between the patients in the disease section of the tissue and the tissues of healthy individual | Fold-change: 0.26 Z-score: 0.31 P-value: 7.27E-04 |
||||
|
Target gene expression profiles of the patients in the disease section of the tissue
Target gene expression profiles in the tissue of healthy individual
|
|||||
| Disease | Lung cancer | ||||
| Example drug | CP-547632 | Phase 2 | [16], [17], [4] | ||
| Tissue | Lung tissue | ||||
| Level of differential expression between the patients in the disease section of the tissue and the tissues of healthy individual | Fold-change: -1.61 Z-score: -2.54 P-value: 2.37E-83 |
||||
| Level of differential expression between the patients in the disease section of the tissue and the patients in the normal section of the tissue adjacent to the disease section | Fold-change: -1.73 Z-score: -2.55 P-value: 9.72E-52 |
||||
|
Target gene expression profiles of the patients in the disease section of the tissue
Target gene expression profiles of the patients in the normal section of the tissue adjacent to the disease section
Target gene expression profiles in the tissue of healthy individual

|
|||||
| Disease | Myelodysplastic syndromes | ||||
| Example drug | Sorafenib | Phase 2 | [12], [13], [4] | ||
| Tissue | Bone marrow | ||||
| Level of differential expression between the patients in the disease section of the tissue and the tissues of healthy individual | Fold-change: 0.11 Z-score: 0.37 P-value: 7.93E-05 |
||||
| Level of differential expression between the patients in the disease section of the tissue and the patients in the normal section of the tissue adjacent to the disease section | Fold-change: 0.26 Z-score: 4.99 P-value: 1.23E-12 |
||||
|
Target gene expression profiles of the patients in the disease section of the tissue
Target gene expression profiles of the patients in the normal section of the tissue adjacent to the disease section
Target gene expression profiles in the tissue of healthy individual

|
|||||
| Disease | Alzheimer's disease | ||||
| Example drug | MK-2461 | Phase 1/2 | [18], [4] | ||
| Tissue | Entorhinal cortex | ||||
| Level of differential expression between the patients in the disease section of the tissue and the tissues of healthy individual | Fold-change: 0.11 Z-score: 0.20 P-value: 1.98E-01 |
||||
|
Target gene expression profiles of the patients in the disease section of the tissue
Target gene expression profiles in the tissue of healthy individual
|
|||||
| Disease | Rectal cancer | ||||
| Example drug | OTSGC-A24 | Phase 1/2 | [19], [4] | ||
| Tissue | Rectal colon tissue | ||||
| Level of differential expression between the patients in the disease section of the tissue and the tissues of healthy individual | Fold-change: 0.49 Z-score: 1.48 P-value: 2.74E-02 |
||||
| Level of differential expression between the patients in the disease section of the tissue and the patients in the normal section of the tissue adjacent to the disease section | Fold-change: 1.39 Z-score: 3.60 P-value: 1.67E-04 |
||||
|
Target gene expression profiles of the patients in the disease section of the tissue
Target gene expression profiles of the patients in the normal section of the tissue adjacent to the disease section
Target gene expression profiles in the tissue of healthy individual
|
|||||
| Disease | Glioma | ||||
| Example drug | KRN633 | Phase 1 | [20], [21], [4] | ||
| Tissue | Brainstem tissue | ||||
| Level of differential expression between the patients in the disease section of the tissue and the tissues of healthy individual | Fold-change: 0.05 Z-score: 0.19 P-value: 6.79E-01 |
||||
|
Target gene expression profiles of the patients in the disease section of the tissue
Target gene expression profiles in the tissue of healthy individual
|
|||||
| Disease | Glioma | ||||
| Example drug | KRN633 | Phase 1 | [20], [21], [4] | ||
| Tissue | White matter | ||||
| Level of differential expression between the patients in the disease section of the tissue and the tissues of healthy individual | Fold-change: 0.61 Z-score: 0.61 P-value: 7.67E-01 |
||||
|
Target gene expression profiles of the patients in the disease section of the tissue
Target gene expression profiles in the tissue of healthy individual
|
|||||
| Disease | Psoriasis | ||||
| Tissue | Skin | ||||
| Level of differential expression between the patients in the disease section of the tissue and the tissues of healthy individual | Fold-change: -0.33 Z-score: -0.66 P-value: 8.32E-09 |
||||
| Level of differential expression between the patients in the disease section of the tissue and the patients in the normal section of the tissue adjacent to the disease section | Fold-change: -0.35 Z-score: -0.88 P-value: 2.43E-12 |
||||
|
Target gene expression profiles of the patients in the disease section of the tissue
Target gene expression profiles of the patients in the normal section of the tissue adjacent to the disease section
Target gene expression profiles in the tissue of healthy individual

|
|||||
| Disease | Retinoblastoma tumor | ||||
| Tissue | Uvea | ||||
| Level of differential expression between the patients in the disease section of the tissue and the tissues of healthy individual | Fold-change: -4.77 Z-score: -8.72 P-value: 4.37E-09 |
||||
|
Target gene expression profiles of the patients in the disease section of the tissue
Target gene expression profiles in the tissue of healthy individual
|
|||||
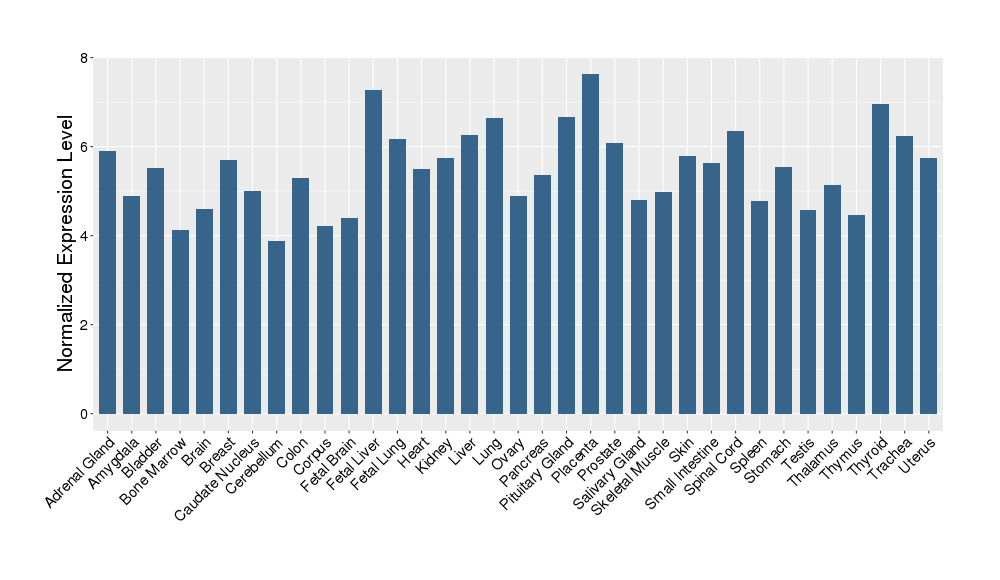
| Target Gene Expression Profiles in Other Tissues of Healthy Individuals | |||||
|
|||||
| Reference | |||||
| REF 3 | Clinical pipeline report, company report or official report of LSK BioPharma. | ||||
| REF 6 | (http://www.guidetopharmacology.org/) Nucleic Acids Res. 2015 Oct 12. pii: gkv1037. The IUPHAR/BPS Guide to PHARMACOLOGY in 2016: towards curated quantitative interactions between 1300 protein targets and 6000 ligands. (Ligand id: 7390). | ||||
| REF 8 | (http://www.guidetopharmacology.org/) Nucleic Acids Res. 2015 Oct 12. pii: gkv1037. The IUPHAR/BPS Guide to PHARMACOLOGY in 2016: towards curated quantitative interactions between 1300 protein targets and 6000 ligands. (Ligand id: 5887). | ||||
| REF 9 | Clinical pipeline report, company report or official report of Exelixis (2011). | ||||
| REF 11 | (http://www.guidetopharmacology.org/) Nucleic Acids Res. 2015 Oct 12. pii: gkv1037. The IUPHAR/BPS Guide to PHARMACOLOGY in 2016: towards curated quantitative interactions between 1300 protein targets and 6000 ligands. (Ligand id: 5671). | ||||
| REF 13 | (http://www.guidetopharmacology.org/) Nucleic Acids Res. 2015 Oct 12. pii: gkv1037. The IUPHAR/BPS Guide to PHARMACOLOGY in 2016: towards curated quantitative interactions between 1300 protein targets and 6000 ligands. (Ligand id: 5711). | ||||
| REF 15 | (http://www.guidetopharmacology.org/) Nucleic Acids Res. 2015 Oct 12. pii: gkv1037. The IUPHAR/BPS Guide to PHARMACOLOGY in 2016: towards curated quantitative interactions between 1300 protein targets and 6000 ligands. (Ligand id: 5664). | ||||
| REF 20 | (http://www.guidetopharmacology.org/) Nucleic Acids Res. 2015 Oct 12. pii: gkv1037. The IUPHAR/BPS Guide to PHARMACOLOGY in 2016: towards curated quantitative interactions between 1300 protein targets and 6000 ligands. (Ligand id: 6057). | ||||
| REF 21 | Trusted, scientifically sound profiles of drug programs, clinical trials, safety reports, and company deals, written by scientists. Springer. 2015. Adis Insight (drug id 800017407) | ||||
If You Find Any Error in Data or Bug in Web Service, Please Kindly Report It to Dr. Zhou and Dr. Zhang.