

Target expression details
| Target General Information | |||||
|---|---|---|---|---|---|
| Target ID | T27325 | ||||
| Target Name | Human DNA topoisomerase I | ||||
| Synonyms | Topoisomerase-I; TOP1MT | ||||
| Target Type | Successful | ||||
| Gene Name | TOP1MT | ||||
| Biochemical Class | DNA topoisomerase | ||||
| UniProt ID | TOP1_HUMAN | ||||
| Target Gene Expression Profiles in the Disease-Relevant Drug Targeted Tissue of the Patients and Healthy Individuals | |||||
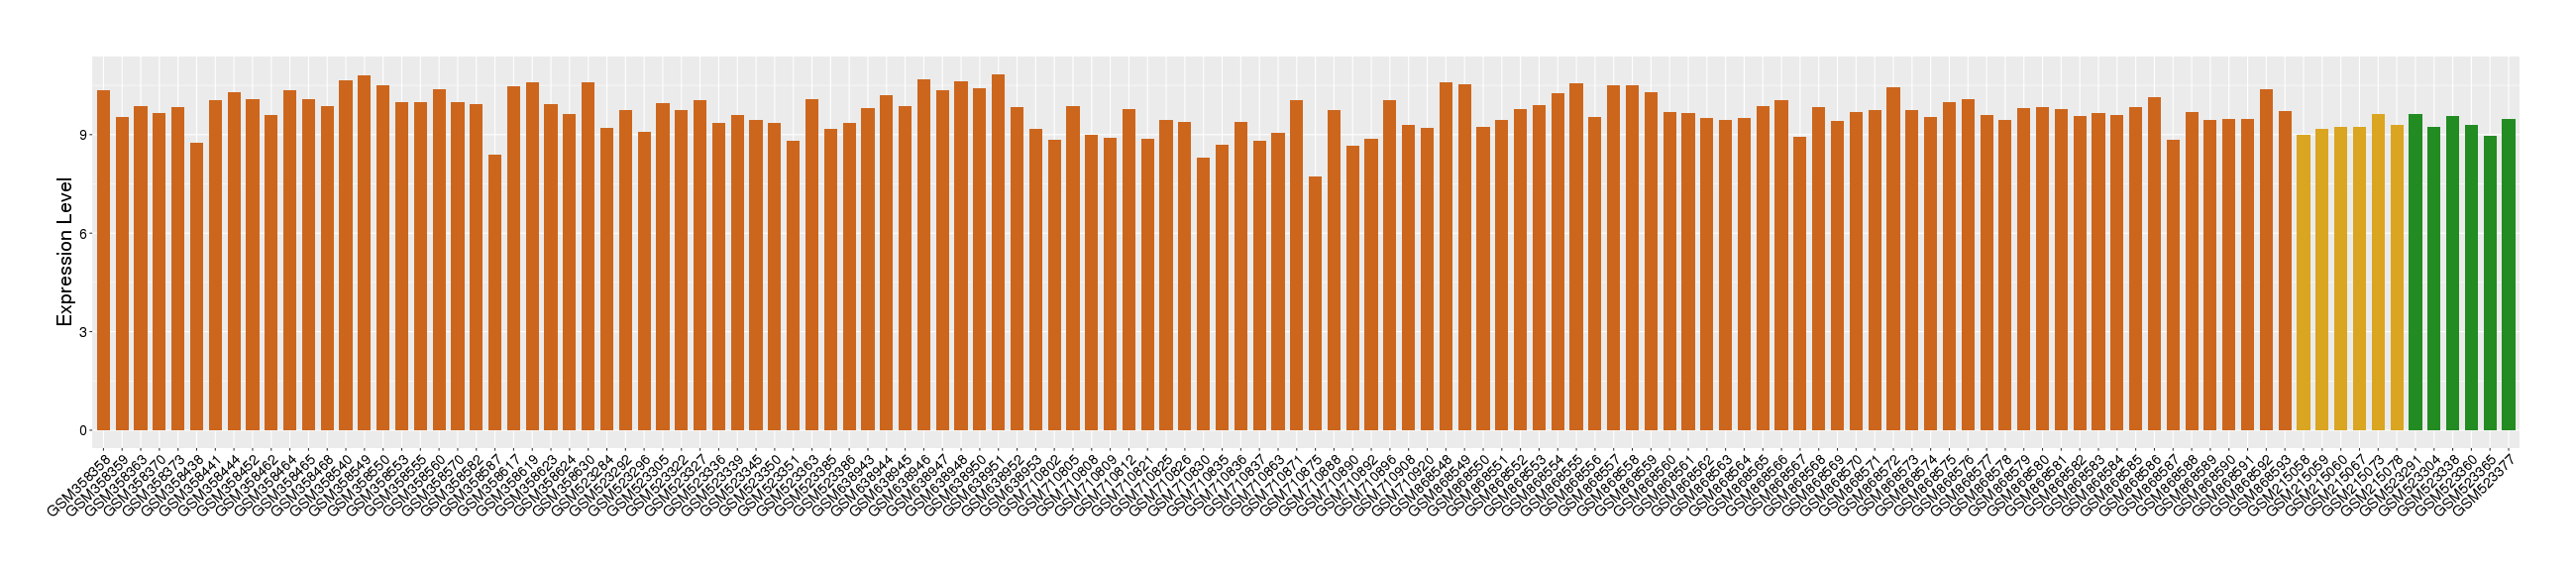
| Disease | Lung cancer | ||||
| Example drug | Topetecan | Approved | [1], [2] | ||
| Tissue | Lung tissue | ||||
| Level of differential expression between the patients in the disease section of the tissue and the tissues of healthy individual | Fold-change: 0.20 Z-score: 0.39 P-value: 6.65E-01 |
||||
| Level of differential expression between the patients in the disease section of the tissue and the patients in the normal section of the tissue adjacent to the disease section | Fold-change: 0.81 Z-score: 0.88 P-value: 6.51E-10 |
||||
|
Target gene expression profiles of the patients in the disease section of the tissue
Target gene expression profiles of the patients in the normal section of the tissue adjacent to the disease section
Target gene expression profiles in the tissue of healthy individual

|
|||||
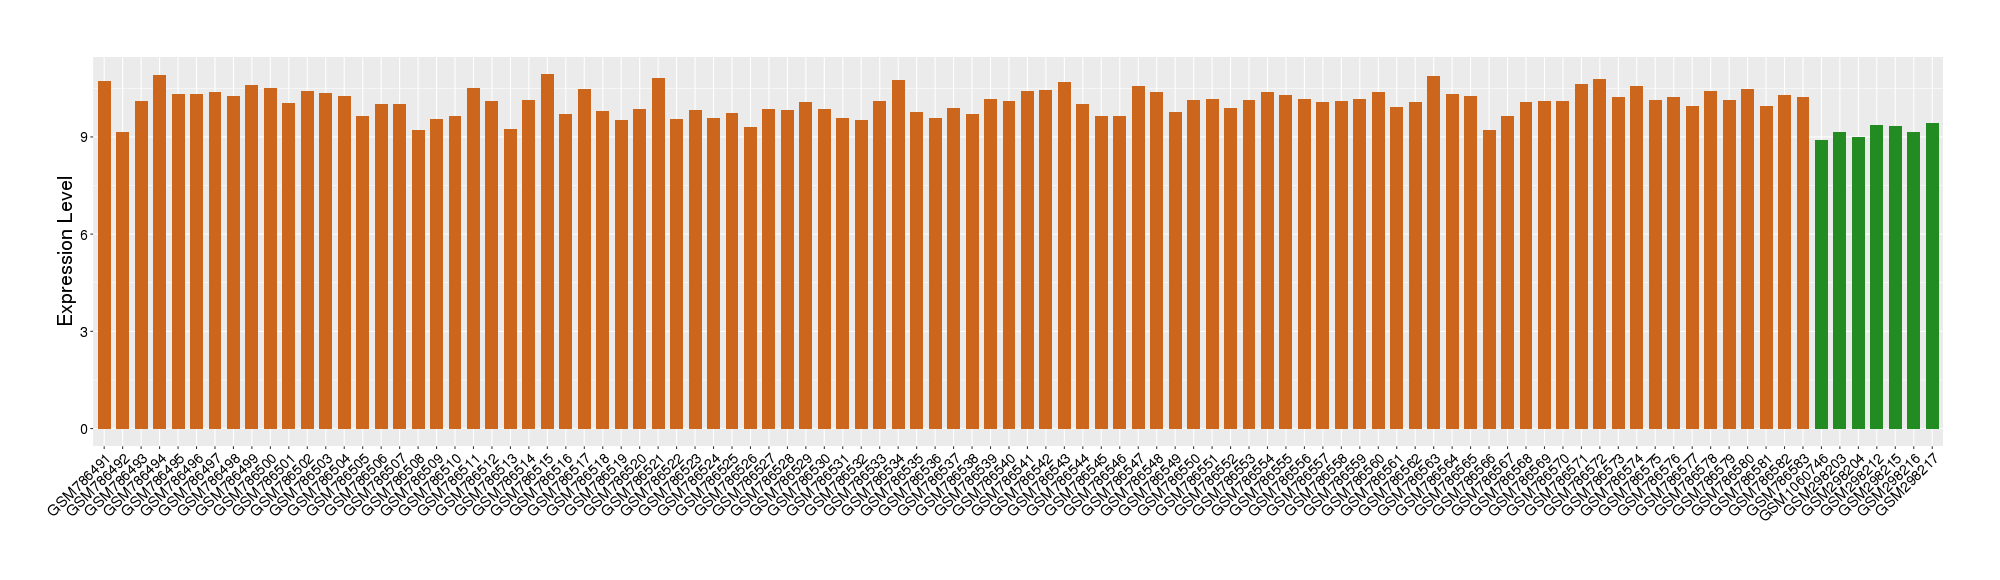
| Disease | Ovarian cancer | ||||
| Example drug | Topotecan | Approved | [3], [4], [2] | ||
| Tissue | Ovarian tissue | ||||
| Level of differential expression between the patients in the disease section of the tissue and the tissues of healthy individual | Fold-change: 0.44 Z-score: 0.64 P-value: 2.65E-01 |
||||
| Level of differential expression between the patients in the disease section of the tissue and the patients in the normal section of the tissue adjacent to the disease section | Fold-change: -0.67 Z-score: -1.22 P-value: 1.46E-03 |
||||
|
Target gene expression profiles of the patients in the disease section of the tissue
Target gene expression profiles of the patients in the normal section of the tissue adjacent to the disease section
Target gene expression profiles in the tissue of healthy individual

|
|||||
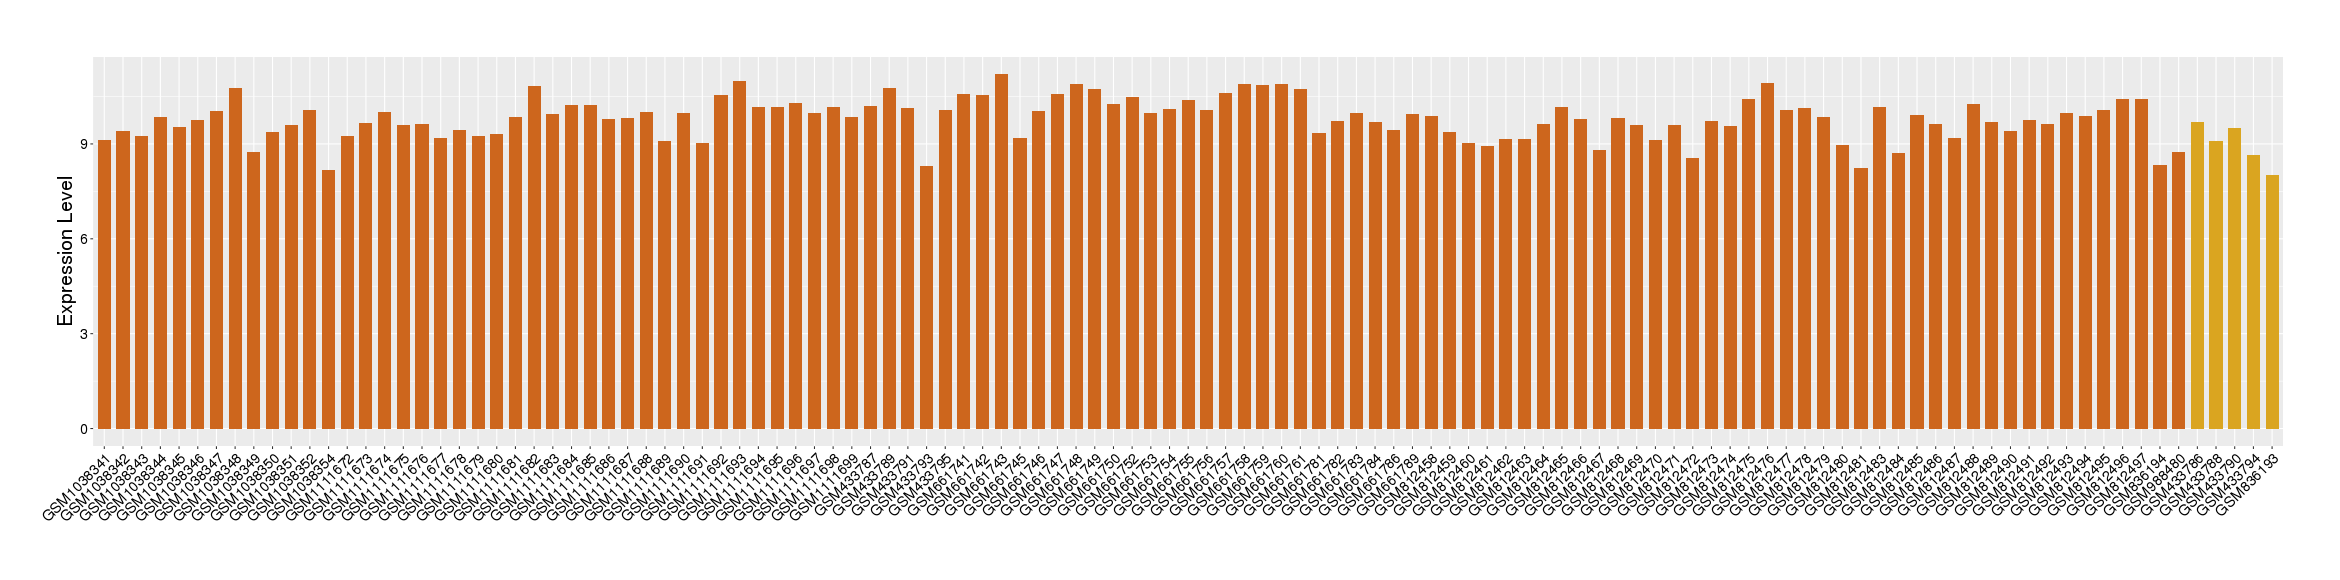
| Disease | Rectal cancer | ||||
| Example drug | Irinotecan | Approved | [5], [6], [2] | ||
| Tissue | Rectal colon tissue | ||||
| Level of differential expression between the patients in the disease section of the tissue and the tissues of healthy individual | Fold-change: 0.37 Z-score: 1.49 P-value: 1.35E-02 |
||||
| Level of differential expression between the patients in the disease section of the tissue and the patients in the normal section of the tissue adjacent to the disease section | Fold-change: 0.53 Z-score: 2.47 P-value: 1.26E-03 |
||||
|
Target gene expression profiles of the patients in the disease section of the tissue
Target gene expression profiles of the patients in the normal section of the tissue adjacent to the disease section
Target gene expression profiles in the tissue of healthy individual
|
|||||
| Disease | Breast cancer | ||||
| Example drug | Datelliptium chloride | Terminated | [7], [2] | ||
| Tissue | Breast tissue | ||||
| Level of differential expression between the patients in the disease section of the tissue and the tissues of healthy individual | Fold-change: 0.17 Z-score: 0.27 P-value: 1.05E-01 |
||||
| Level of differential expression between the patients in the disease section of the tissue and the patients in the normal section of the tissue adjacent to the disease section | Fold-change: 0.64 Z-score: 1.14 P-value: 3.32E-07 |
||||
|
Target gene expression profiles of the patients in the disease section of the tissue
Target gene expression profiles of the patients in the normal section of the tissue adjacent to the disease section
Target gene expression profiles in the tissue of healthy individual

|
|||||
| Disease | Bladder cancer | ||||
| Tissue | Bladder tissue | ||||
| Level of differential expression between the patients in the disease section of the tissue and the tissues of healthy individual | Fold-change: 0.97 Z-score: 4.96 P-value: 5.84E-07 |
||||
|
Target gene expression profiles of the patients in the disease section of the tissue
Target gene expression profiles in the tissue of healthy individual
|
|||||
| Disease | Esophagal cancer | ||||
| Tissue | Esophagus | ||||
| Level of differential expression between the patients in the disease section of the tissue and the patients in the normal section of the tissue adjacent to the disease section | Fold-change: 0.75 Z-score: 1.10 P-value: 5.17E-02 |
||||
|
Target gene expression profiles of the patients in the disease section of the tissue
Target gene expression profiles of the patients in the normal section of the tissue adjacent to the disease section
|
|||||
| Disease | Gastric cancer | ||||
| Tissue | Gastric tissue | ||||
| Level of differential expression between the patients in the disease section of the tissue and the tissues of healthy individual | Fold-change: 0.79 Z-score: 0.95 P-value: 1.81E-01 |
||||
| Level of differential expression between the patients in the disease section of the tissue and the patients in the normal section of the tissue adjacent to the disease section | Fold-change: -0.31 Z-score: -0.68 P-value: 9.46E-03 |
||||
|
Target gene expression profiles of the patients in the disease section of the tissue
Target gene expression profiles of the patients in the normal section of the tissue adjacent to the disease section
Target gene expression profiles in the tissue of healthy individual

|
|||||
| Disease | Myelodysplastic syndromes | ||||
| Tissue | Bone marrow | ||||
| Level of differential expression between the patients in the disease section of the tissue and the tissues of healthy individual | Fold-change: 0.15 Z-score: 0.27 P-value: 1.09E-01 |
||||
| Level of differential expression between the patients in the disease section of the tissue and the patients in the normal section of the tissue adjacent to the disease section | Fold-change: 0.74 Z-score: 1.96 P-value: 2.22E-02 |
||||
|
Target gene expression profiles of the patients in the disease section of the tissue
Target gene expression profiles of the patients in the normal section of the tissue adjacent to the disease section
Target gene expression profiles in the tissue of healthy individual

|
|||||
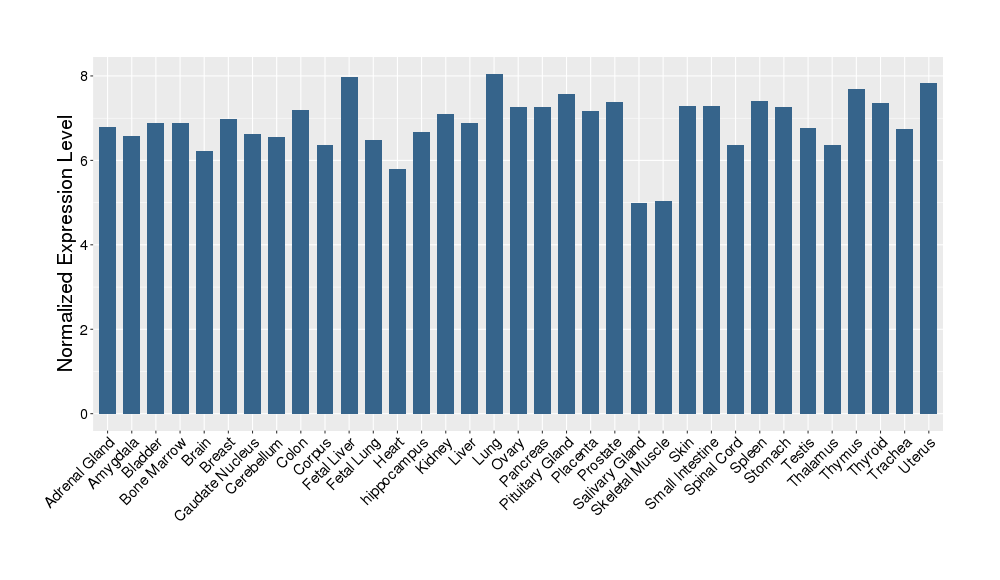
| Target Gene Expression Profiles in Other Tissues of Healthy Individuals | |||||
|
|||||
| Reference | |||||
| REF 1 | FDA Approved Drug Products from FDA Official Website. 2009. Application Number: (NDA) 020671. | ||||
| REF 2 | NCBI GEO: archive for functional genomics data sets--update. | ||||
| REF 3 | Natural products as sources of new drugs over the last 25 years. J Nat Prod. 2007 Mar;70(3):461-77. Epub 2007 Feb 20. | ||||
| REF 4 | (http://www.guidetopharmacology.org/) Nucleic Acids Res. 2015 Oct 12. pii: gkv1037. The IUPHAR/BPS Guide to PHARMACOLOGY in 2016: towards curated quantitative interactions between 1300 protein targets and 6000 ligands. (Ligand id: 7101). | ||||
| REF 5 | New drugs for the treatment of cancer, 1990-2001. Isr Med Assoc J. 2002 Dec;4(12):1124-31. | ||||
| REF 6 | (http://www.guidetopharmacology.org/) Nucleic Acids Res. 2015 Oct 12. pii: gkv1037. The IUPHAR/BPS Guide to PHARMACOLOGY in 2016: towards curated quantitative interactions between 1300 protein targets and 6000 ligands. (Ligand id: 6823). | ||||
| REF 7 | Trusted, scientifically sound profiles of drug programs, clinical trials, safety reports, and company deals, written by scientists. Springer. 2015. Adis Insight (drug id 800001278) | ||||
If You Find Any Error in Data or Bug in Web Service, Please Kindly Report It to Dr. Zhou and Dr. Zhang.