Target Information
| Target General Information | Top | |||||
|---|---|---|---|---|---|---|
| Target ID |
T41036
(Former ID: TTDI03018)
|
|||||
| Target Name |
Adhesion G protein-coupled receptor B1 (BAI1)
|
|||||
| Synonyms |
Brain-specific angiogenesis inhibitor 1; ADGRB1
Click to Show/Hide
|
|||||
| Gene Name |
BAI1
|
|||||
| Target Type |
Literature-reported target
|
[1] | ||||
| Function |
Mediates the binding and engulfment of Gram-negative bacteria. Stimulates production of reactive oxygen species by macrophages in response to Gram-negative bacteria, resulting in enhanced microbicidal macrophage activity. In the gastric mucosa, required for recognition and engulfment of apoptotic gastric epithelial cells. Promotes myoblast fusion. Activates the Rho pathway in a G-protein-dependent manner. Inhibits MDM2-mediated ubiquitination and degradation of DLG4/PSD95, promoting DLG4 stability and regulating synaptic plasticity. Required for the formation of dendritic spines by ensuring the correct localization of PARD3 and TIAM1. Potent inhibitor of angiogenesis in brain and may play a significant role as a mediator of the p53/TP53 signal in suppression of glioblastoma. Phosphatidylserine receptor which enhances the engulfment of apoptotic cells.
Click to Show/Hide
|
|||||
| BioChemical Class |
GPCR secretin
|
|||||
| UniProt ID | ||||||
| Sequence |
MRGQAAAPGPVWILAPLLLLLLLLGRRARAAAGADAGPGPEPCATLVQGKFFGYFSAAAV
FPANASRCSWTLRNPDPRRYTLYMKVAKAPVPCSGPGRVRTYQFDSFLESTRTYLGVESF DEVLRLCDPSAPLAFLQASKQFLQMRRQQPPQHDGLRPRAGPPGPTDDFSVEYLVVGNRN PSRAACQMLCRWLDACLAGSRSSHPCGIMQTPCACLGGEAGGPAAGPLAPRGDVCLRDAV AGGPENCLTSLTQDRGGHGATGGWKLWSLWGECTRDCGGGLQTRTRTCLPAPGVEGGGCE GVLEEGRQCNREACGPAGRTSSRSQSLRSTDARRREELGDELQQFGFPAPQTGDPAAEEW SPWSVCSSTCGEGWQTRTRFCVSSSYSTQCSGPLREQRLCNNSAVCPVHGAWDEWSPWSL CSSTCGRGFRDRTRTCRPPQFGGNPCEGPEKQTKFCNIALCPGRAVDGNWNEWSSWSACS ASCSQGRQQRTRECNGPSYGGAECQGHWVETRDCFLQQCPVDGKWQAWASWGSCSVTCGA GSQRRERVCSGPFFGGAACQGPQDEYRQCGTQRCPEPHEICDEDNFGAVIWKETPAGEVA AVRCPRNATGLILRRCELDEEGIAYWEPPTYIRCVSIDYRNIQMMTREHLAKAQRGLPGE GVSEVIQTLVEISQDGTSYSGDLLSTIDVLRNMTEIFRRAYYSPTPGDVQNFVQILSNLL AEENRDKWEEAQLAGPNAKELFRLVEDFVDVIGFRMKDLRDAYQVTDNLVLSIHKLPASG ATDISFPMKGWRATGDWAKVPEDRVTVSKSVFSTGLTEADEASVFVVGTVLYRNLGSFLA LQRNTTVLNSKVISVTVKPPPRSLRTPLEIEFAHMYNGTTNQTCILWDETDVPSSSAPPQ LGPWSWRGCRTVPLDALRTRCLCDRLSTFAILAQLSADANMEKATLPSVTLIVGCGVSSL TLLMLVIIYVSVWRYIRSERSVILINFCLSIISSNALILIGQTQTRNKVVCTLVAAFLHF FFLSSFCWVLTEAWQSYMAVTGHLRNRLIRKRFLCLGWGLPALVVAISVGFTKAKGYSTM NYCWLSLEGGLLYAFVGPAAAVVLVNMVIGILVFNKLVSKDGITDKKLKERAGASLWSSC VVLPLLALTWMSAVLAVTDRRSALFQILFAVFDSLEGFVIVMVHCILRREVQDAVKCRVV DRQEEGNGDSGGSFQNGHAQLMTDFEKDVDLACRSVLNKDIAACRTATITGTLKRPSLPE EEKLKLAHAKGPPTNFNSLPANVSKLHLHGSPRYPGGPLPDFPNHSLTLKRDKAPKSSFV GDGDIFKKLDSELSRAQEKALDTSYVILPTATATLRPKPKEEPKYSIHIDQMPQTRLIHL STAPEASLPARSPPSRQPPSGGPPEAPPAQPPPPPPPPPPPPQQPLPPPPNLEPAPPSLG DPGEPAAHPGPSTGPSTKNENVATLSVSSLERRKSRYAELDFEKIMHTRKRHQDMFQDLN RKLQHAAEKDKEVLGPDSKPEKQQTPNKRPWESLRKAHGTPTWVKKELEPLQPSPLELRS VEWERSGATIPLVGQDIIDLQTEV Click to Show/Hide
|
|||||
| 3D Structure | Click to Show 3D Structure of This Target | AlphaFold | ||||
| Cell-based Target Expression Variations | Top | |||||
|---|---|---|---|---|---|---|
| Cell-based Target Expression Variations | ||||||
| Different Human System Profiles of Target | Top |
|---|---|
|
Human Similarity Proteins
of target is determined by comparing the sequence similarity of all human proteins with the target based on BLAST. The similarity proteins for a target are defined as the proteins with E-value < 0.005 and outside the protein families of the target.
A target that has fewer human similarity proteins outside its family is commonly regarded to possess a greater capacity to avoid undesired interactions and thus increase the possibility of finding successful drugs
(Brief Bioinform, 21: 649-662, 2020).
Human Tissue Distribution
of target is determined from a proteomics study that quantified more than 12,000 genes across 32 normal human tissues. Tissue Specificity (TS) score was used to define the enrichment of target across tissues.
The distribution of targets among different tissues or organs need to be taken into consideration when assessing the target druggability, as it is generally accepted that the wider the target distribution, the greater the concern over potential adverse effects
(Nat Rev Drug Discov, 20: 64-81, 2021).
Human Pathway Affiliation
of target is determined by the life-essential pathways provided on KEGG database. The target-affiliated pathways were defined based on the following two criteria (a) the pathways of the studied target should be life-essential for both healthy individuals and patients, and (b) the studied target should occupy an upstream position in the pathways and therefore had the ability to regulate biological function.
Targets involved in a fewer pathways have greater likelihood to be successfully developed, while those associated with more human pathways increase the chance of undesirable interferences with other human processes
(Pharmacol Rev, 58: 259-279, 2006).
Biological Network Descriptors
of target is determined based on a human protein-protein interactions (PPI) network consisting of 9,309 proteins and 52,713 PPIs, which were with a high confidence score of ≥ 0.95 collected from STRING database.
The network properties of targets based on protein-protein interactions (PPIs) have been widely adopted for the assessment of target’s druggability. Proteins with high node degree tend to have a high impact on network function through multiple interactions, while proteins with high betweenness centrality are regarded to be central for communication in interaction networks and regulate the flow of signaling information
(Front Pharmacol, 9, 1245, 2018;
Curr Opin Struct Biol. 44:134-142, 2017).
Human Similarity Proteins
Human Tissue Distribution
Human Pathway Affiliation
Biological Network Descriptors
|
|
| Protein Name | Pfam ID | Percentage of Identity (%) | E value |
|---|---|---|---|
| Netrin receptor UNC5A (UNC5A) | 46.429 (26/56) | 6.97E-07 | |
| Frizzled-6 (FZD6) | 22.984 (57/248) | 7.92E-07 | |
| Frizzled-3 (FZD3) | 22.566 (51/226) | 4.08E-05 |
|
Note:
If a protein has TS (tissue specficity) scores at least in one tissue >= 2.5, this protein is called tissue-enriched (including tissue-enriched-but-not-specific and tissue-specific). In the plots, the vertical lines are at thresholds 2.5 and 4.
|
| KEGG Pathway | Pathway ID | Affiliated Target | Pathway Map |
|---|---|---|---|
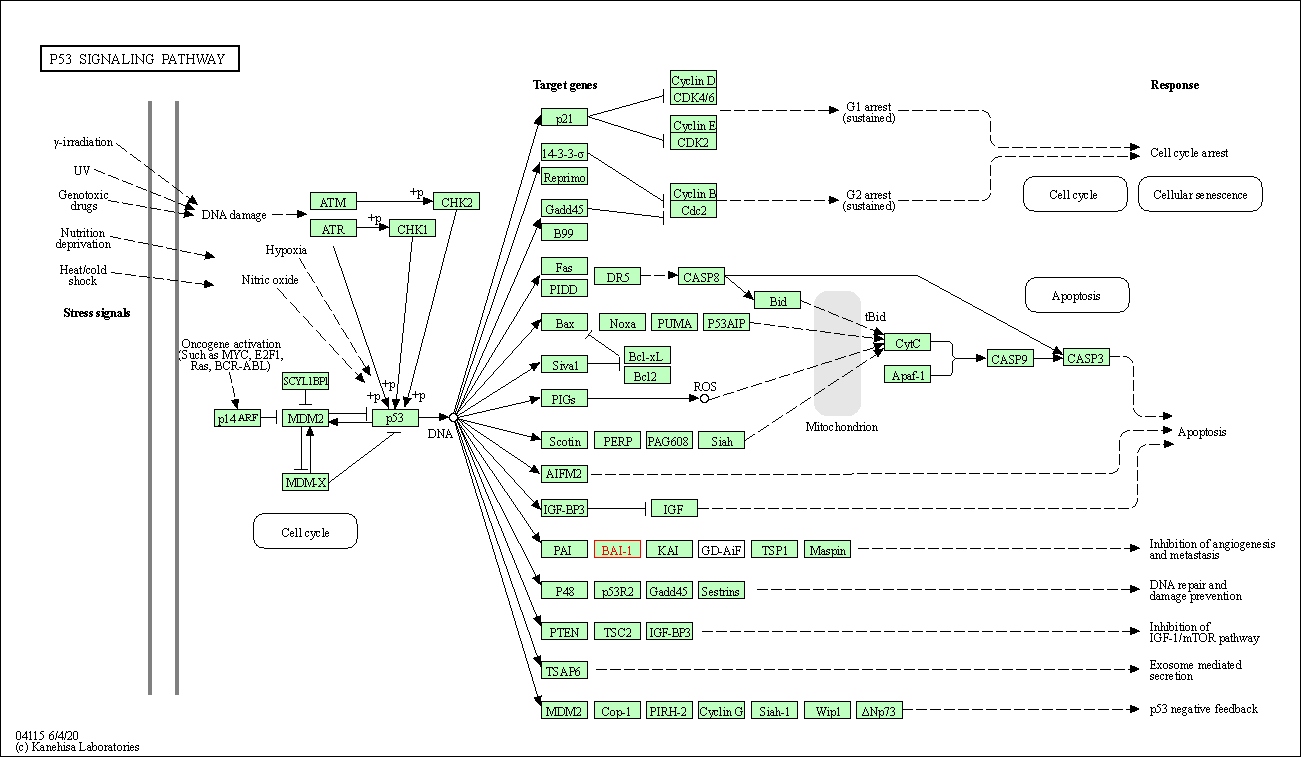
| p53 signaling pathway | hsa04115 | Affiliated Target |

|
| Class: Cellular Processes => Cell growth and death | Pathway Hierarchy | ||
| Degree | 1 | Degree centrality | 1.07E-04 | Betweenness centrality | 0.00E+00 |
|---|---|---|---|---|---|
| Closeness centrality | 1.71E-01 | Radiality | 1.27E+01 | Clustering coefficient | 0.00E+00 |
| Neighborhood connectivity | 8.00E+00 | Topological coefficient | 1.00E+00 | Eccentricity | 13 |
| Download | Click to Download the Full PPI Network of This Target | ||||
| Target Regulators | Top | |||||
|---|---|---|---|---|---|---|
| Target-interacting Proteins | ||||||
| References | Top | |||||
|---|---|---|---|---|---|---|
| REF 1 | BAI1 is an engulfment receptor for apoptotic cells upstream of the ELMO/Dock180/Rac module. Nature. 2007 Nov 15;450(7168):430-4. | |||||
If You Find Any Error in Data or Bug in Web Service, Please Kindly Report It to Dr. Zhou and Dr. Zhang.

