Target Information
| Target General Information | Top | |||||
|---|---|---|---|---|---|---|
| Target ID |
T60003
(Former ID: TTDI03493)
|
|||||
| Target Name |
Protein kinase N1 (PKN1)
|
|||||
| Synonyms |
Serine/threonine-protein kinase N1; Serine-threonine protein kinase N; Protein-kinase C-related kinase 1; Protein kinase PKN-alpha; Protein kinase C-like PKN; Protein kinase C-like 1; Protease-activated kinase 1; PRKCL1; PRK1; PKN; PAK1
Click to Show/Hide
|
|||||
| Gene Name |
PKN1
|
|||||
| Target Type |
Literature-reported target
|
[1] | ||||
| Function |
Part of a signaling cascade that begins with the activation of the adrenergic receptor ADRA1B and leads to the activation of MAPK14. Regulates the cytoskeletal network by phosphorylating proteins such as VIM and neurofilament proteins NEFH, NEFL and NEFM, leading to inhibit their polymerization. Phosphorylates 'Ser-575', 'Ser-637' and 'Ser-669' of MAPT/Tau, lowering its ability to bind to microtubules, resulting in disruption of tubulin assembly. Acts as a key coactivator of androgen receptor (ANDR)-dependent transcription, by being recruited to ANDR target genes and specifically mediating phosphorylation of 'Thr-11' of histone H3 (H3T11ph), a specific tag for epigenetic transcriptional activation that promotes demethylation of histone H3 'Lys-9' (H3K9me) by KDM4C/JMJD2C. Phosphorylates HDAC5, HDAC7 and HDAC9, leading to impair their import in the nucleus. Phosphorylates 'Thr-38' of PPP1R14A, 'Ser-159', 'Ser-163' and 'Ser-170' of MARCKS, and GFAP. Able to phosphorylate RPS6 in vitro. PKC-related serine/threonine-protein kinase involved in various processes such as regulation of the intermediate filaments of the actin cytoskeleton, cell migration, tumor cell invasion and transcription regulation.
Click to Show/Hide
|
|||||
| BioChemical Class |
Kinase
|
|||||
| UniProt ID | ||||||
| EC Number |
EC 2.7.11.13
|
|||||
| Sequence |
MASDAVQSEPRSWSLLEQLGLAGADLAAPGVQQQLELERERLRREIRKELKLKEGAENLR
RATTDLGRSLGPVELLLRGSSRRLDLLHQQLQELHAHVVLPDPAATHDGPQSPGAGGPTC SATNLSRVAGLEKQLAIELKVKQGAENMIQTYSNGSTKDRKLLLTAQQMLQDSKTKIDII RMQLRRALQAGQLENQAAPDDTQGSPDLGAVELRIEELRHHFRVEHAVAEGAKNVLRLLS AAKAPDRKAVSEAQEKLTESNQKLGLLREALERRLGELPADHPKGRLLREELAAASSAAF STRLAGPFPATHYSTLCKPAPLTGTLEVRVVGCRDLPETIPWNPTPSMGGPGTPDSRPPF LSRPARGLYSRSGSLSGRSSLKAEAENTSEVSTVLKLDNTVVGQTSWKPCGPNAWDQSFT LELERARELELAVFWRDQRGLCALKFLKLEDFLDNERHEVQLDMEPQGCLVAEVTFRNPV IERIPRLRRQKKIFSKQQGKAFQRARQMNIDVATWVRLLRRLIPNATGTGTFSPGASPGS EARTTGDISVEKLNLGTDSDSSPQKSSRDPPSSPSSLSSPIQESTAPELPSETQETPGPA LCSPLRKSPLTLEDFKFLAVLGRGHFGKVLLSEFRPSGELFAIKALKKGDIVARDEVESL MCEKRILAAVTSAGHPFLVNLFGCFQTPEHVCFVMEYSAGGDLMLHIHSDVFSEPRAIFY SACVVLGLQFLHEHKIVYRDLKLDNLLLDTEGYVKIADFGLCKEGMGYGDRTSTFCGTPE FLAPEVLTDTSYTRAVDWWGLGVLLYEMLVGESPFPGDDEEEVFDSIVNDEVRYPRFLSA EAIGIMRRLLRRNPERRLGSSERDAEDVKKQPFFRTLGWEALLARRLPPPFVPTLSGRTD VSNFDEEFTGEAPTLSPPRDARPLTAAEQAAFLDFDFVAGGC Click to Show/Hide
|
|||||
| 3D Structure | Click to Show 3D Structure of This Target | AlphaFold | ||||
| Cell-based Target Expression Variations | Top | |||||
|---|---|---|---|---|---|---|
| Cell-based Target Expression Variations | ||||||
| Drug Binding Sites of Target | Top | |||||
|---|---|---|---|---|---|---|
| Ligand Name: Tofacitinib | Ligand Info | |||||
| Structure Description | Crystal Structure of PRK1 Catalytic Domain in Complex with Tofacitinib | PDB:4OTI | ||||
| Method | X-ray diffraction | Resolution | 1.93 Å | Mutation | No | [3] |
| PDB Sequence |
RKSPLTLEDF
621 KFLAVLGRGH631 FGKVLLSEFR641 PSGELFAIKA651 LKKGDIVARD661 EVESLMCEKR 671 ILAAVTSAGH681 PFLVNLFGCF691 QTPEHVCFVM701 EYSAGGDLML711 HIHSDVFSEP 721 RAIFYSACVV731 LGLQFLHEHK741 IVYRDLKLDN751 LLLDTEGYVK761 IADFGLTRAV 802 DWWGLGVLLY812 EMLVGESPFP822 GDDEEEVFDS832 IVNDEVRYPR842 FLSAEAIGIM 852 RRLLRRNPER862 RLGSSERDAE872 DVKKQPFFRT882 LGWEALLARR892 LPPPFVPTLS 902 GRTDVSNFDE912 EFTGEAPTLP923 PRDARPLTAA933 EQAAFLDFDF943 VAG |
|||||
|
|
LEU627
3.679
GLY628
3.309
ARG629
3.390
GLY630
3.135
GLY633
3.200
LYS634
3.497
VAL635
3.146
ALA648
3.452
LYS650
3.747
LEU652
4.662
VAL685
3.753
|
|||||
| Ligand Name: Lestaurtinib | Ligand Info | |||||
| Structure Description | Crystal Structure of PRK1 Catalytic Domain in Complex with Lestaurtinib | PDB:4OTG | ||||
| Method | X-ray diffraction | Resolution | 2.60 Å | Mutation | No | [3] |
| PDB Sequence |
LRKSPLTLED
620 FKFLAVLGRG630 HFGKVLLSEF640 RPSGELFAIK650 ALKKGDIVAR660 DEVESLMCEK 670 RILAAVTSAG680 HPFLVNLFGC690 FQTPEHVCFV700 MEYSAGGDLM710 LHIHSDVFSE 720 PRAIFYSACV730 VLGLQFLHEH740 KIVYRDLKLD750 NLLLDTEGYV760 KIADFGLCKE 770 GMGYGDRTSF781 CGTPEFLAPE791 VLTDTSYTRA801 VDWWGLGVLL811 YEMLVGESPF 821 PGDDEEEVFD831 SIVNDEVRYP841 RFLSAEAIGI851 MRRLLRRNPE861 RRLGSSERDA 871 EDVKKQPFFR881 TLGWEALLAR891 RLPPPFVPTL901 FTGEAPTLPP924 RDARPLTAAE 934 QAAFLDFDFV944 AG
|
|||||
|
|
LEU627
3.528
GLY628
3.271
ARG629
3.749
GLY630
4.785
PHE632
3.546
VAL635
3.587
ALA648
3.426
LYS650
4.083
VAL685
4.136
MET701
4.075
GLU702
2.885
|
|||||
| Click to View More Binding Site Information of This Target with Different Ligands | ||||||
| Different Human System Profiles of Target | Top |
|---|---|
|
Human Similarity Proteins
of target is determined by comparing the sequence similarity of all human proteins with the target based on BLAST. The similarity proteins for a target are defined as the proteins with E-value < 0.005 and outside the protein families of the target.
A target that has fewer human similarity proteins outside its family is commonly regarded to possess a greater capacity to avoid undesired interactions and thus increase the possibility of finding successful drugs
(Brief Bioinform, 21: 649-662, 2020).
Human Tissue Distribution
of target is determined from a proteomics study that quantified more than 12,000 genes across 32 normal human tissues. Tissue Specificity (TS) score was used to define the enrichment of target across tissues.
The distribution of targets among different tissues or organs need to be taken into consideration when assessing the target druggability, as it is generally accepted that the wider the target distribution, the greater the concern over potential adverse effects
(Nat Rev Drug Discov, 20: 64-81, 2021).
Human Pathway Affiliation
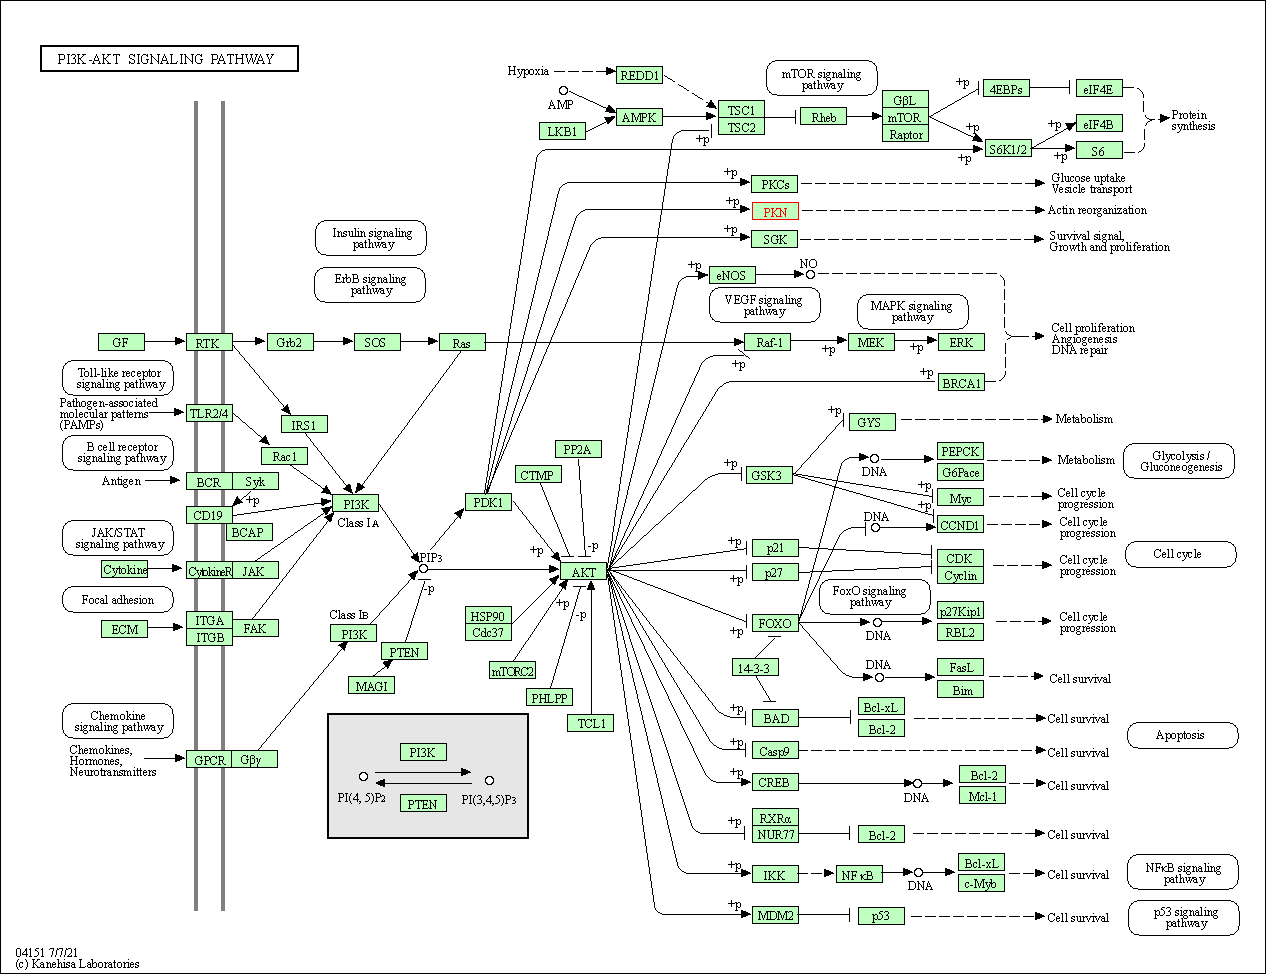
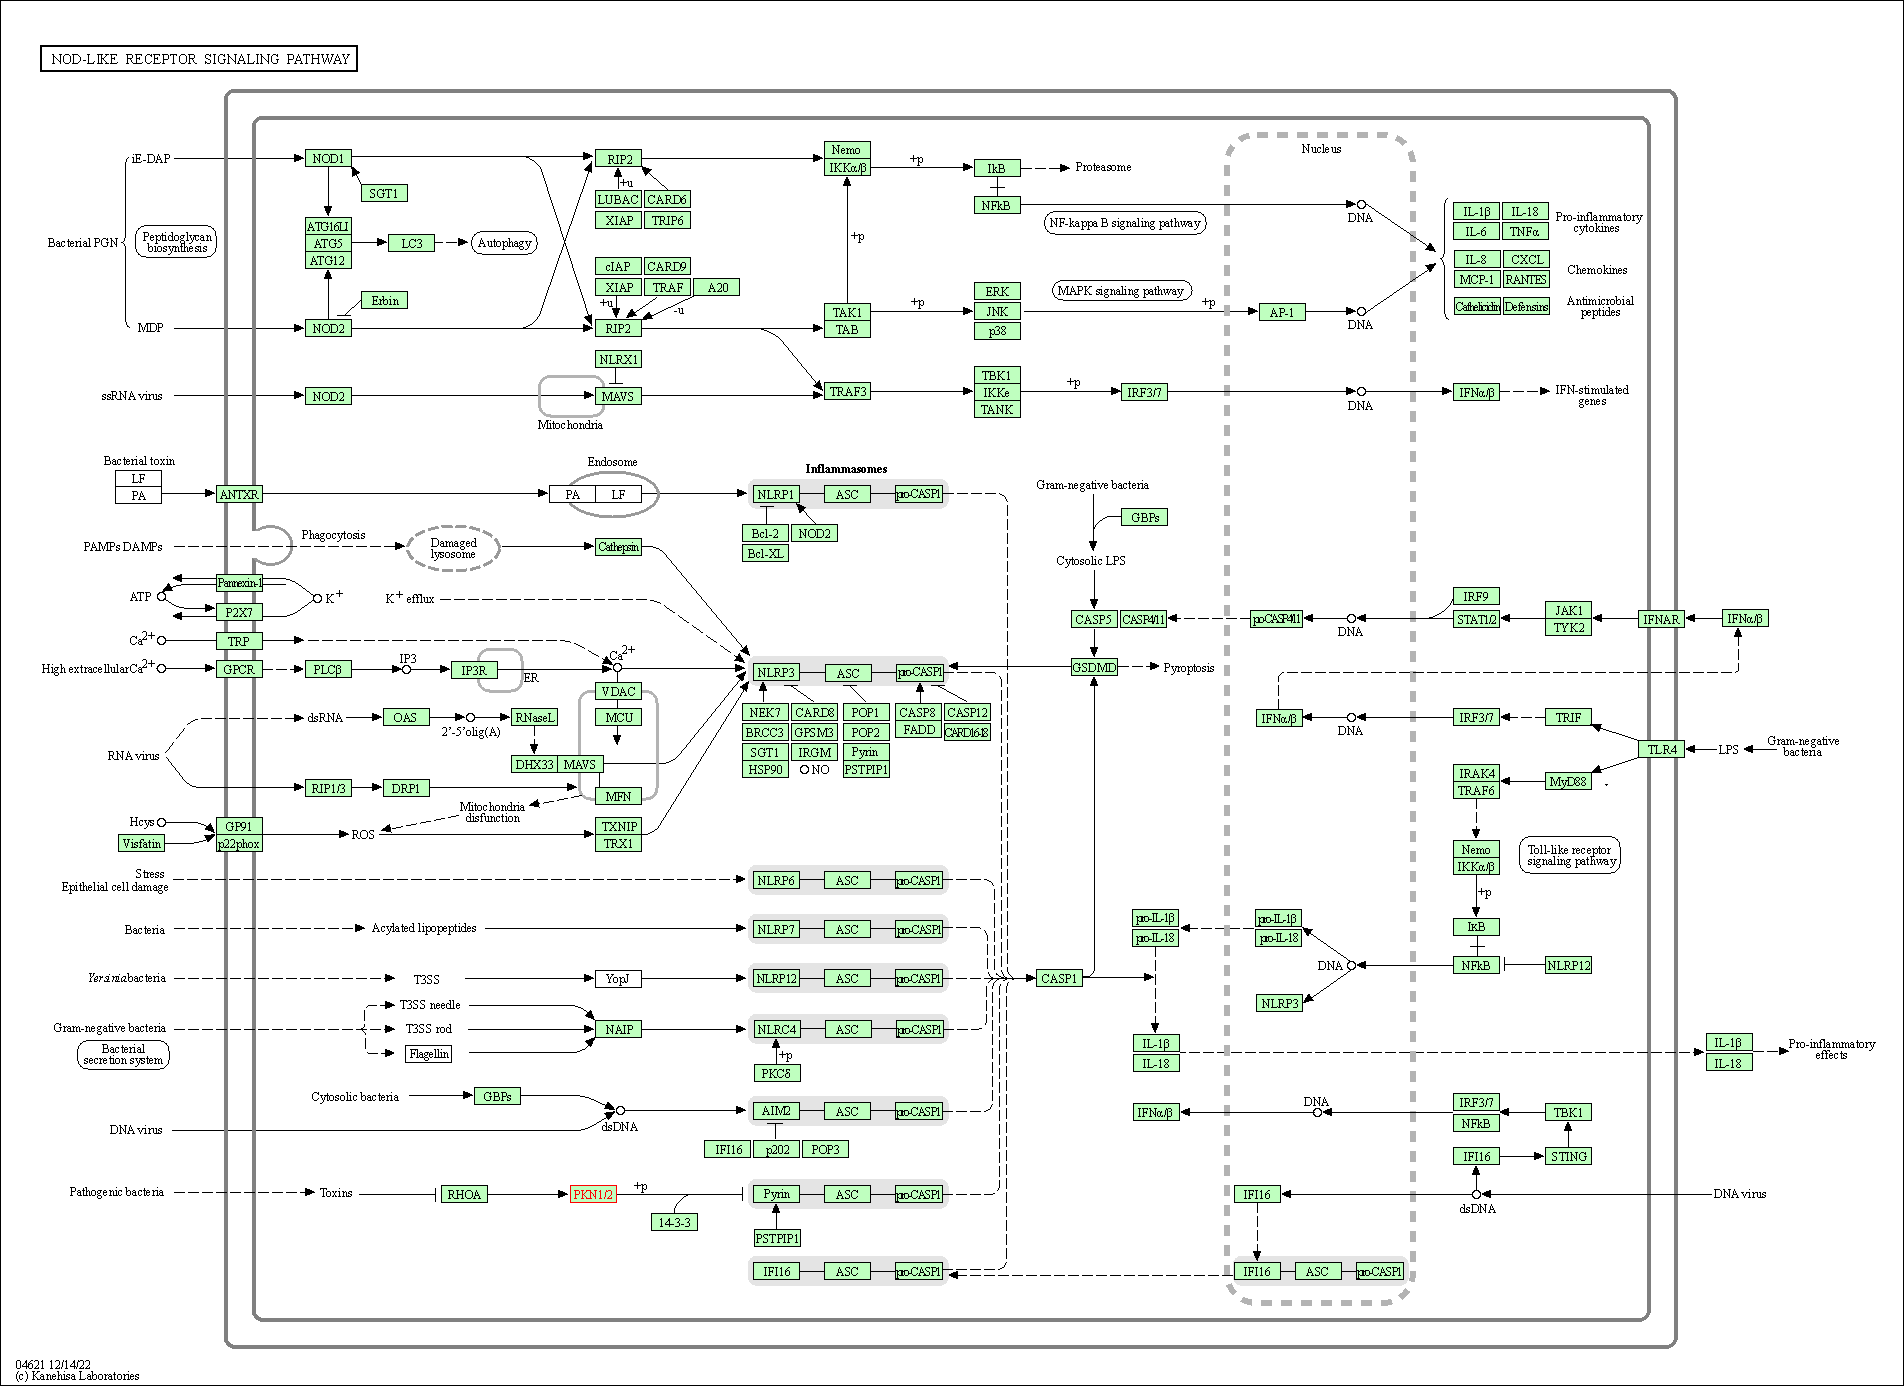
of target is determined by the life-essential pathways provided on KEGG database. The target-affiliated pathways were defined based on the following two criteria (a) the pathways of the studied target should be life-essential for both healthy individuals and patients, and (b) the studied target should occupy an upstream position in the pathways and therefore had the ability to regulate biological function.
Targets involved in a fewer pathways have greater likelihood to be successfully developed, while those associated with more human pathways increase the chance of undesirable interferences with other human processes
(Pharmacol Rev, 58: 259-279, 2006).
Biological Network Descriptors
of target is determined based on a human protein-protein interactions (PPI) network consisting of 9,309 proteins and 52,713 PPIs, which were with a high confidence score of ≥ 0.95 collected from STRING database.
The network properties of targets based on protein-protein interactions (PPIs) have been widely adopted for the assessment of target’s druggability. Proteins with high node degree tend to have a high impact on network function through multiple interactions, while proteins with high betweenness centrality are regarded to be central for communication in interaction networks and regulate the flow of signaling information
(Front Pharmacol, 9, 1245, 2018;
Curr Opin Struct Biol. 44:134-142, 2017).
Human Similarity Proteins
Human Tissue Distribution
Human Pathway Affiliation
Biological Network Descriptors
|
|
|
Note:
If a protein has TS (tissue specficity) scores at least in one tissue >= 2.5, this protein is called tissue-enriched (including tissue-enriched-but-not-specific and tissue-specific). In the plots, the vertical lines are at thresholds 2.5 and 4.
|


| KEGG Pathway | Pathway ID | Affiliated Target | Pathway Map |
|---|---|---|---|
| PI3K-Akt signaling pathway | hsa04151 | Affiliated Target |

|
| Class: Environmental Information Processing => Signal transduction | Pathway Hierarchy | ||
| NOD-like receptor signaling pathway | hsa04621 | Affiliated Target |

|
| Class: Organismal Systems => Immune system | Pathway Hierarchy | ||
| Degree | 4 | Degree centrality | 4.30E-04 | Betweenness centrality | 4.68E-04 |
|---|---|---|---|---|---|
| Closeness centrality | 2.23E-01 | Radiality | 1.39E+01 | Clustering coefficient | 0.00E+00 |
| Neighborhood connectivity | 5.10E+01 | Topological coefficient | 2.56E-01 | Eccentricity | 12 |
| Download | Click to Download the Full PPI Network of This Target | ||||
| Chemical Structure based Activity Landscape of Target | Top |
|---|---|
| Target Poor or Non Binders | Top | |||||
|---|---|---|---|---|---|---|
| Target Poor or Non Binders | ||||||
| Target Regulators | Top | |||||
|---|---|---|---|---|---|---|
| Target-interacting Proteins | ||||||
| References | Top | |||||
|---|---|---|---|---|---|---|
| REF 1 | Pyridylthiazole-based ureas as inhibitors of Rho associated protein kinases (ROCK1 and 2). Medchemcomm. 2012 Jun 1;3(6):699-709. | |||||
| REF 2 | 7,8-dichloro-1-oxo-beta-carbolines as a versatile scaffold for the development of potent and selective kinase inhibitors with unusual binding modes. J Med Chem. 2012 Jan 12;55(1):403-13. | |||||
| REF 3 | Crystal structures of PRK1 in complex with the clinical compounds lestaurtinib and tofacitinib reveal ligand induced conformational changes. PLoS One. 2014 Aug 11;9(8):e103638. | |||||
If You Find Any Error in Data or Bug in Web Service, Please Kindly Report It to Dr. Zhou and Dr. Zhang.

