Target Information
| Target General Information | Top | |||||
|---|---|---|---|---|---|---|
| Target ID |
T67658
(Former ID: TTDR00776)
|
|||||
| Target Name |
Glucose transporter type 4 (SLC2A4)
|
|||||
| Synonyms |
Solute carrier family 2, facilitated glucose transporter member 4; Glut4 protein; Glucose transporter type 4, insulin-responsive; GLUT4; GLUT-4
Click to Show/Hide
|
|||||
| Gene Name |
SLC2A4
|
|||||
| Target Type |
Clinical trial target
|
[1] | ||||
| Disease | [+] 1 Target-related Diseases | + | ||||
| 1 | Type 2 diabetes mellitus [ICD-11: 5A11] | |||||
| Function |
Insulin-regulated facilitative glucose transporter.
Click to Show/Hide
|
|||||
| BioChemical Class |
Major facilitator
|
|||||
| UniProt ID | ||||||
| Sequence |
MPSGFQQIGSEDGEPPQQRVTGTLVLAVFSAVLGSLQFGYNIGVINAPQKVIEQSYNETW
LGRQGPEGPSSIPPGTLTTLWALSVAIFSVGGMISSFLIGIISQWLGRKRAMLVNNVLAV LGGSLMGLANAAASYEMLILGRFLIGAYSGLTSGLVPMYVGEIAPTHLRGALGTLNQLAI VIGILIAQVLGLESLLGTASLWPLLLGLTVLPALLQLVLLPFCPESPRYLYIIQNLEGPA RKSLKRLTGWADVSGVLAELKDEKRKLERERPLSLLQLLGSRTHRQPLIIAVVLQLSQQL SGINAVFYYSTSIFETAGVGQPAYATIGAGVVNTVFTLVSVLLVERAGRRTLHLLGLAGM CGCAILMTVALLLLERVPAMSYVSIVAIFGFVAFFEIGPGPIPWFIVAELFSQGPRPAAM AVAGFSNWTSNFIIGMGFQYVAEAMGPYVFLLFAVLLLGFFIFTFLRVPETRGRTFDQIS AAFHRTPSLLEQEVKPSTELEYLGPDEND Click to Show/Hide
|
|||||
| 3D Structure | Click to Show 3D Structure of This Target | AlphaFold | ||||
| ADReCS ID | BADD_A01130 ; BADD_A01328 ; BADD_A02564 | |||||
| HIT2.0 ID | T68SE0 | |||||
| Drugs and Modes of Action | Top | |||||
|---|---|---|---|---|---|---|
| Clinical Trial Drug(s) | [+] 1 Clinical Trial Drugs | + | ||||
| 1 | DS-1150b | Drug Info | Phase 1 | Type-2 diabetes | [2] | |
| Mode of Action | [+] 1 Modes of Action | + | ||||
| Modulator | [+] 1 Modulator drugs | + | ||||
| 1 | DS-1150b | Drug Info | [1] | |||
| Cell-based Target Expression Variations | Top | |||||
|---|---|---|---|---|---|---|
| Cell-based Target Expression Variations | ||||||
| Drug Binding Sites of Target | Top | |||||
|---|---|---|---|---|---|---|
| Ligand Name: Preverex | Ligand Info | |||||
| Structure Description | Cryo-EM structure of human glucose transporter GLUT4 bound to cytochalasin B in lipid nanodiscs | PDB:7WSM | ||||
| Method | Electron microscopy | Resolution | 3.25 Å | Mutation | No | [3] |
| PDB Sequence |
TGTLVLAVFS
30 AVLGSLQFGY40 NIGVINAPQK50 VIEQSYNETW60 LGRQGPEGPS70 SIPPGTLTTL 80 WALSVAIFSV90 GGMISSFLIG100 IISQWLGRKR110 AMLVNNVLAV120 LGGSLMGLAN 130 AAASYEMLIL140 GRFLIGAYSG150 LTSGLVPMYV160 GEIAPTHLRG170 ALGTLNQLAI 180 VIGILIAQVL190 GLESLLGTAS200 LWPLLLGLTV210 LPALLQLVLL220 PFCPESPRYL 230 YIIQNLEGPA240 RKSLKRLTGW250 ADVSGVLAEL260 KDEKRKLERE270 RPLSLLQLLG 280 SRTHRQPLII290 AVVLQLSQQL300 SGINAVFYYS310 TSIFETAGVG320 QPAYATIGAG 330 VVNTVFTLVS340 VLLVERAGRR350 TLHLLGLAGM360 CGCAILMTVA370 LLLLERVPAM 380 SYVSIVAIFG390 FVAFFEIGPG400 PIPWFIVAEL410 FSQGPRPAAM420 AVAGFSNWTS 430 NFIIGMGFQY440 VAEAMGPYVF450 LLFAVLLLGF460 FIFTFLRVPE470 TRGRTFDQIS 480 AAFH
|
|||||
|
|
PHE38
3.916
ILE42
4.281
SER153
3.533
PRO157
4.017
ASN176
3.833
GLN177
3.569
ILE180
3.691
ILE184
4.100
GLN298
2.479
GLN299
3.127
ILE303
3.910
|
|||||
| Click to View More Binding Site Information of This Target and Ligand Pair | ||||||
| Click to View More Binding Site Information of This Target with Different Ligands | ||||||
| Different Human System Profiles of Target | Top |
|---|---|
|
Human Similarity Proteins
of target is determined by comparing the sequence similarity of all human proteins with the target based on BLAST. The similarity proteins for a target are defined as the proteins with E-value < 0.005 and outside the protein families of the target.
A target that has fewer human similarity proteins outside its family is commonly regarded to possess a greater capacity to avoid undesired interactions and thus increase the possibility of finding successful drugs
(Brief Bioinform, 21: 649-662, 2020).
Human Tissue Distribution
of target is determined from a proteomics study that quantified more than 12,000 genes across 32 normal human tissues. Tissue Specificity (TS) score was used to define the enrichment of target across tissues.
The distribution of targets among different tissues or organs need to be taken into consideration when assessing the target druggability, as it is generally accepted that the wider the target distribution, the greater the concern over potential adverse effects
(Nat Rev Drug Discov, 20: 64-81, 2021).
Human Pathway Affiliation
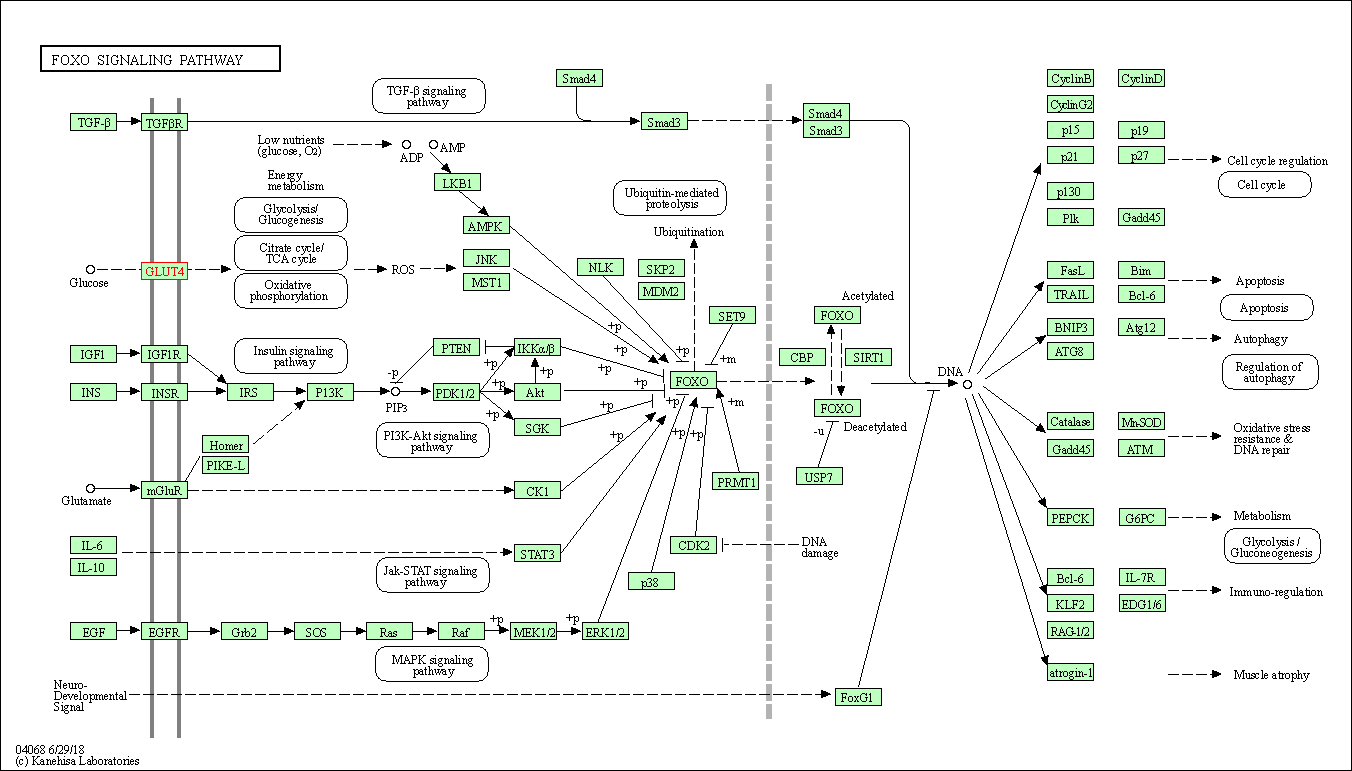
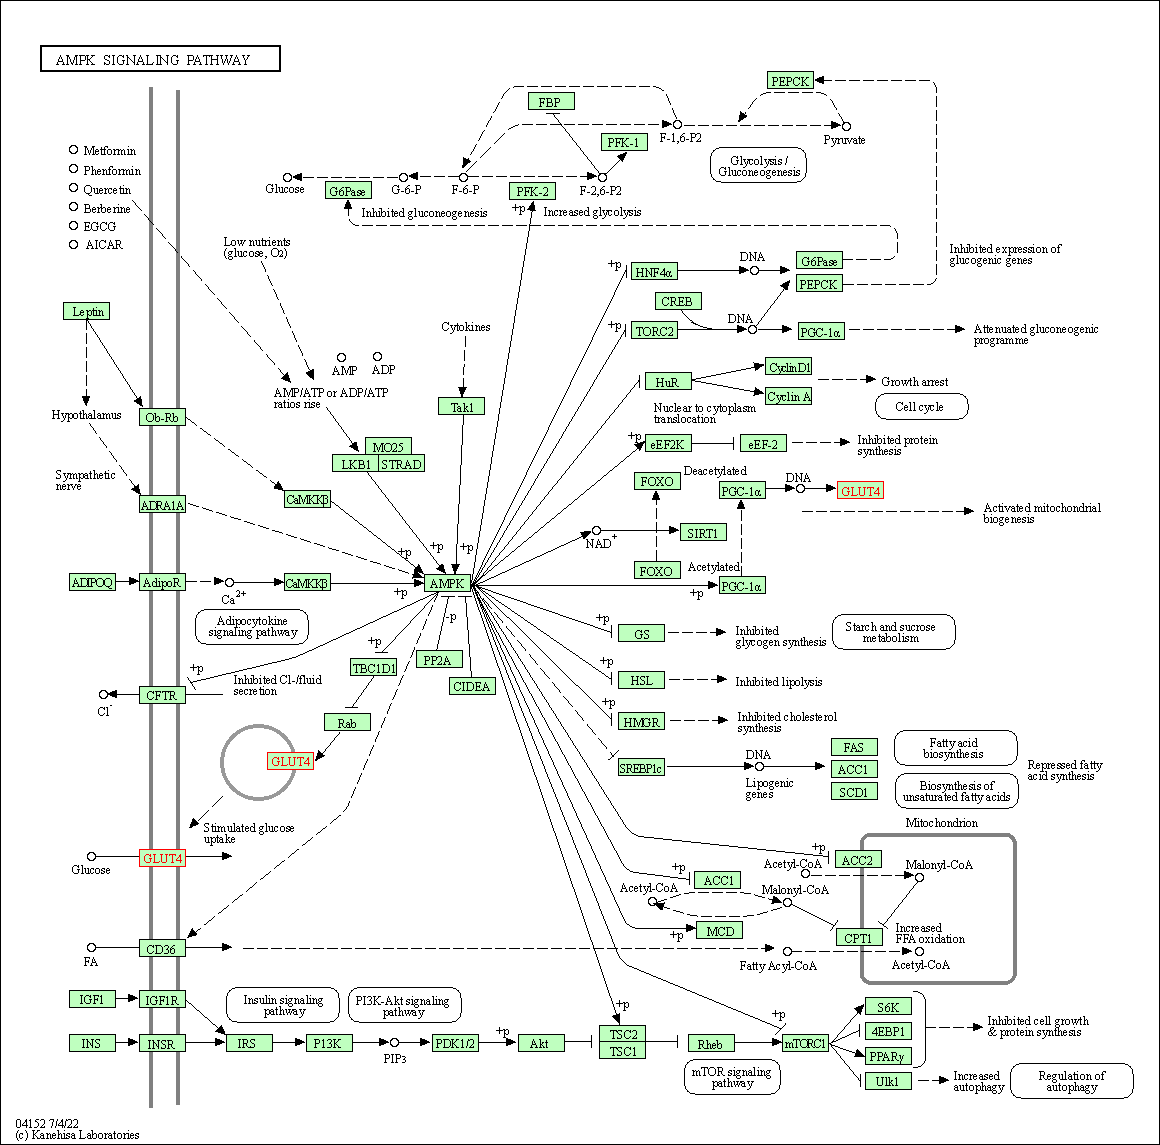
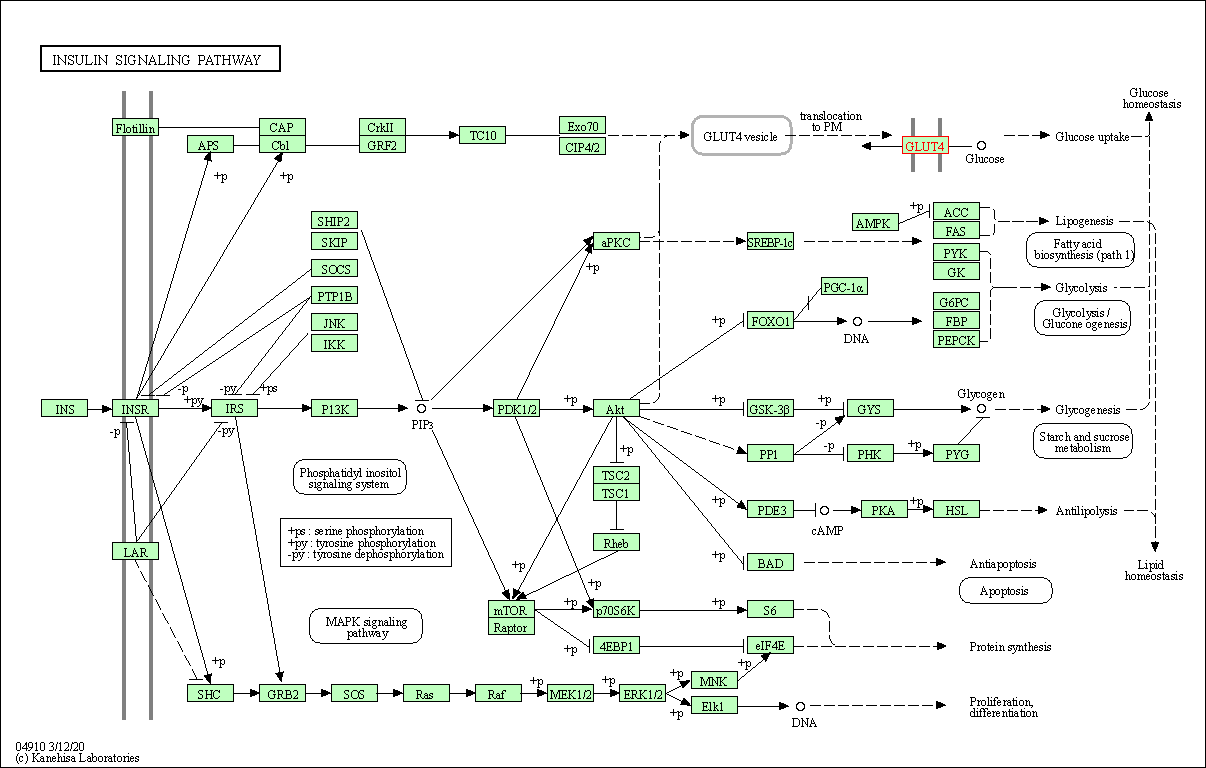
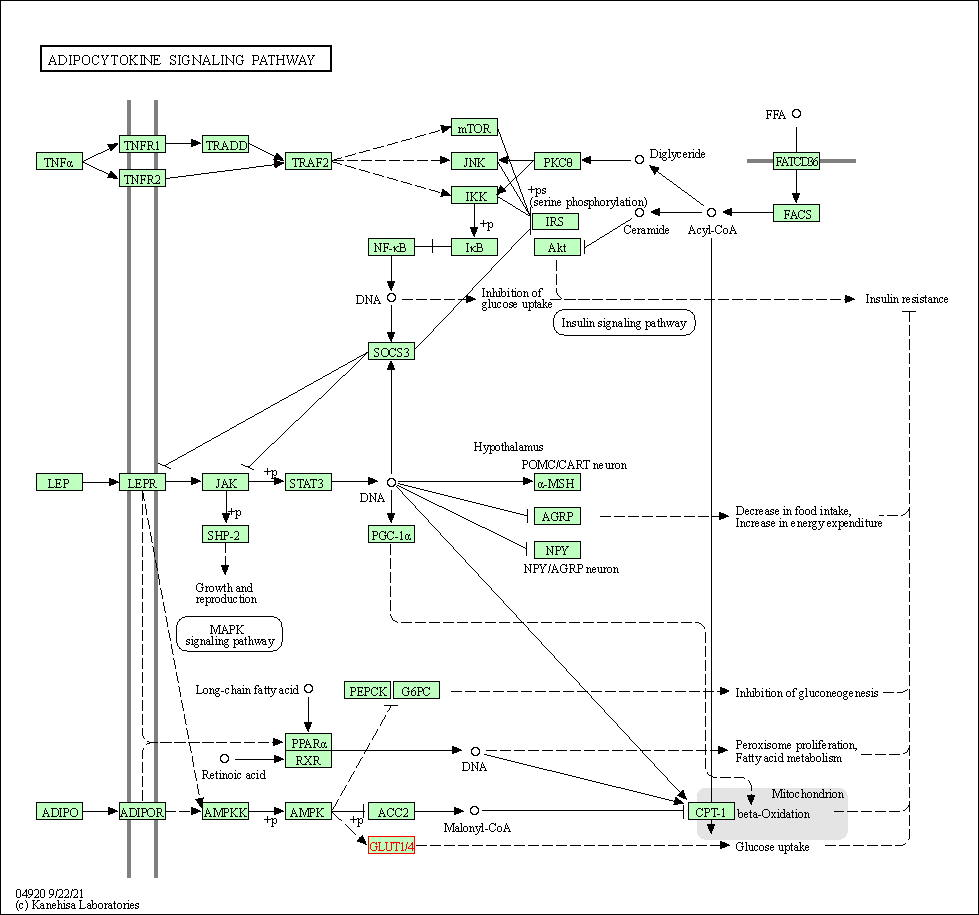
of target is determined by the life-essential pathways provided on KEGG database. The target-affiliated pathways were defined based on the following two criteria (a) the pathways of the studied target should be life-essential for both healthy individuals and patients, and (b) the studied target should occupy an upstream position in the pathways and therefore had the ability to regulate biological function.
Targets involved in a fewer pathways have greater likelihood to be successfully developed, while those associated with more human pathways increase the chance of undesirable interferences with other human processes
(Pharmacol Rev, 58: 259-279, 2006).
Biological Network Descriptors
of target is determined based on a human protein-protein interactions (PPI) network consisting of 9,309 proteins and 52,713 PPIs, which were with a high confidence score of ≥ 0.95 collected from STRING database.
The network properties of targets based on protein-protein interactions (PPIs) have been widely adopted for the assessment of target’s druggability. Proteins with high node degree tend to have a high impact on network function through multiple interactions, while proteins with high betweenness centrality are regarded to be central for communication in interaction networks and regulate the flow of signaling information
(Front Pharmacol, 9, 1245, 2018;
Curr Opin Struct Biol. 44:134-142, 2017).
Human Similarity Proteins
Human Tissue Distribution
Human Pathway Affiliation
Biological Network Descriptors
|
|
| Protein Name | Pfam ID | Percentage of Identity (%) | E value |
|---|---|---|---|
| Solute carrier family 22 member 7 (SLC22A7) | 26.934 (94/349) | 6.37E-05 |
|
Note:
If a protein has TS (tissue specficity) scores at least in one tissue >= 2.5, this protein is called tissue-enriched (including tissue-enriched-but-not-specific and tissue-specific). In the plots, the vertical lines are at thresholds 2.5 and 4.
|


| KEGG Pathway | Pathway ID | Affiliated Target | Pathway Map |
|---|---|---|---|
| FoxO signaling pathway | hsa04068 | Affiliated Target |

|
| Class: Environmental Information Processing => Signal transduction | Pathway Hierarchy | ||
| AMPK signaling pathway | hsa04152 | Affiliated Target |

|
| Class: Environmental Information Processing => Signal transduction | Pathway Hierarchy | ||
| Insulin signaling pathway | hsa04910 | Affiliated Target |

|
| Class: Organismal Systems => Endocrine system | Pathway Hierarchy | ||
| Adipocytokine signaling pathway | hsa04920 | Affiliated Target |

|
| Class: Organismal Systems => Endocrine system | Pathway Hierarchy | ||
| Degree | 12 | Degree centrality | 1.29E-03 | Betweenness centrality | 1.09E-03 |
|---|---|---|---|---|---|
| Closeness centrality | 2.31E-01 | Radiality | 1.41E+01 | Clustering coefficient | 1.36E-01 |
| Neighborhood connectivity | 2.67E+01 | Topological coefficient | 1.10E-01 | Eccentricity | 11 |
| Download | Click to Download the Full PPI Network of This Target | ||||
| Chemical Structure based Activity Landscape of Target | Top |
|---|---|
| Target Regulators | Top | |||||
|---|---|---|---|---|---|---|
| Target-regulating microRNAs | ||||||
| Target Profiles in Patients | Top | |||||
|---|---|---|---|---|---|---|
| Target Expression Profile (TEP) |
||||||
| References | Top | |||||
|---|---|---|---|---|---|---|
| REF 1 | Sanford-Burnham goes fourth. SciBX 7(22); doi:10.1038/scibx.2014.633. June 5 2014 | |||||
| REF 2 | ClinicalTrials.gov (NCT02004678) Study to Assess the Safety, Pharmacokinetics and Pharmacodynamics of DS-1150b in Healthy Subjects and Subjects With Type-2 Diabetes Mellitus. U.S. National Institutesof Health. | |||||
| REF 3 | Cryo-EM structure of human glucose transporter GLUT4. Nat Commun. 2022 May 13;13(1):2671. | |||||
If You Find Any Error in Data or Bug in Web Service, Please Kindly Report It to Dr. Zhou and Dr. Zhang.

