Target Information
| Target General Information | Top | |||||
|---|---|---|---|---|---|---|
| Target ID |
T07063
(Former ID: TTDR01001)
|
|||||
| Target Name |
Sodium/iodide cotransporter (SLC5A5)
|
|||||
| Synonyms |
Solute carrier family 5 member 5; Sodium/iodide symporter; Sodium-iodide symporter; Na+/I-symporter; Na(+)/I(-) symporter; Na(+)/I(-) cotransporter; NIS
Click to Show/Hide
|
|||||
| Gene Name |
SLC5A5
|
|||||
| Target Type |
Clinical trial target
|
[1] | ||||
| Disease | [+] 1 Target-related Diseases | + | ||||
| 1 | Prostate cancer [ICD-11: 2C82] | |||||
| Function |
Mediates iodide uptake in the thyroid gland.
Click to Show/Hide
|
|||||
| BioChemical Class |
Solute:sodium symporter
|
|||||
| UniProt ID | ||||||
| Sequence |
MEAVETGERPTFGAWDYGVFALMLLVSTGIGLWVGLARGGQRSAEDFFTGGRRLAALPVG
LSLSASFMSAVQVLGVPSEAYRYGLKFLWMCLGQLLNSVLTALLFMPVFYRLGLTSTYEY LEMRFSRAVRLCGTLQYIVATMLYTGIVIYAPALILNQVTGLDIWASLLSTGIICTFYTA VGGMKAVVWTDVFQVVVMLSGFWVVLARGVMLVGGPRQVLTLAQNHSRINLMDFNPDPRS RYTFWTFVVGGTLVWLSMYGVNQAQVQRYVACRTEKQAKLALLINQVGLFLIVSSAACCG IVMFVFYTDCDPLLLGRISAPDQYMPLLVLDIFEDLPGVPGLFLACAYSGTLSTASTSIN AMAAVTVEDLIKPRLRSLAPRKLVIISKGLSLIYGSACLTVAALSSLLGGGVLQGSFTVM GVISGPLLGAFILGMFLPACNTPGVLAGLGAGLALSLWVALGATLYPPSEQTMRVLPSSA ARCVALSVNASGLLDPALLPANDSSRAPSSGMDASRPALADSFYAISYLYYGALGTLTTV LCGALISCLTGPTKRSTLAPGLLWWDLARQTASVAPKEEVAILDDNLVKGPEELPTGNKK PPGFLPTNEDRLFFLGQKELEGAGSWTPCVGHDGGRDQQETNL Click to Show/Hide
|
|||||
| 3D Structure | Click to Show 3D Structure of This Target | AlphaFold | ||||
| HIT2.0 ID | T00KKS | |||||
| Drugs and Modes of Action | Top | |||||
|---|---|---|---|---|---|---|
| Clinical Trial Drug(s) | [+] 1 Clinical Trial Drugs | + | ||||
| 1 | Ad5CMV-NIS | Drug Info | Phase 1 | Prostate cancer | [2] | |
| Mode of Action | [+] 1 Modes of Action | + | ||||
| Modulator | [+] 1 Modulator drugs | + | ||||
| 1 | Ad5CMV-NIS | Drug Info | [1] | |||
| Cell-based Target Expression Variations | Top | |||||
|---|---|---|---|---|---|---|
| Cell-based Target Expression Variations | ||||||
| Different Human System Profiles of Target | Top |
|---|---|
|
Human Similarity Proteins
of target is determined by comparing the sequence similarity of all human proteins with the target based on BLAST. The similarity proteins for a target are defined as the proteins with E-value < 0.005 and outside the protein families of the target.
A target that has fewer human similarity proteins outside its family is commonly regarded to possess a greater capacity to avoid undesired interactions and thus increase the possibility of finding successful drugs
(Brief Bioinform, 21: 649-662, 2020).
Human Tissue Distribution
of target is determined from a proteomics study that quantified more than 12,000 genes across 32 normal human tissues. Tissue Specificity (TS) score was used to define the enrichment of target across tissues.
The distribution of targets among different tissues or organs need to be taken into consideration when assessing the target druggability, as it is generally accepted that the wider the target distribution, the greater the concern over potential adverse effects
(Nat Rev Drug Discov, 20: 64-81, 2021).
Human Pathway Affiliation
of target is determined by the life-essential pathways provided on KEGG database. The target-affiliated pathways were defined based on the following two criteria (a) the pathways of the studied target should be life-essential for both healthy individuals and patients, and (b) the studied target should occupy an upstream position in the pathways and therefore had the ability to regulate biological function.
Targets involved in a fewer pathways have greater likelihood to be successfully developed, while those associated with more human pathways increase the chance of undesirable interferences with other human processes
(Pharmacol Rev, 58: 259-279, 2006).
Human Similarity Proteins
Human Tissue Distribution
Human Pathway Affiliation
|
|
|
There is no similarity protein (E value < 0.005) for this target
|
|
Note:
If a protein has TS (tissue specficity) scores at least in one tissue >= 2.5, this protein is called tissue-enriched (including tissue-enriched-but-not-specific and tissue-specific). In the plots, the vertical lines are at thresholds 2.5 and 4.
|

| KEGG Pathway | Pathway ID | Affiliated Target | Pathway Map |
|---|---|---|---|
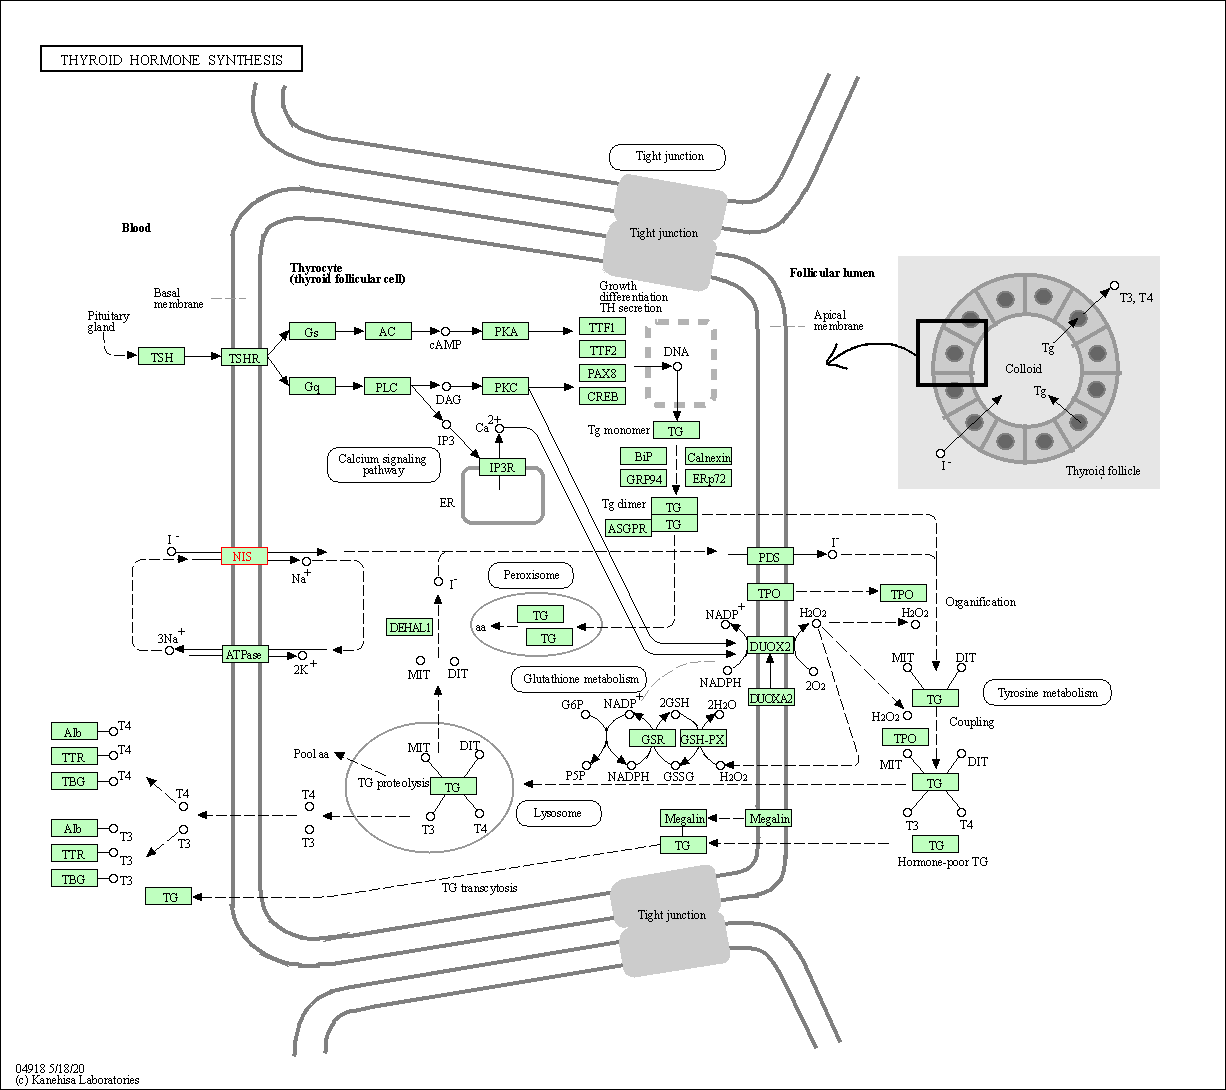
| Thyroid hormone synthesis | hsa04918 | Affiliated Target |

|
| Class: Organismal Systems => Endocrine system | Pathway Hierarchy | ||
| Target Regulators | Top | |||||
|---|---|---|---|---|---|---|
| Target-regulating microRNAs | ||||||
| Target Profiles in Patients | Top | |||||
|---|---|---|---|---|---|---|
| Target Expression Profile (TEP) |
||||||
| References | Top | |||||
|---|---|---|---|---|---|---|
| REF 1 | Noninvasive Imaging and Radiovirotherapy of Prostate Cancer Using an Oncolytic Measles Virus Expressing the Sodium Iodide Symporter. Mol Ther. 2009 December; 17(12): 2041-2048. | |||||
| REF 2 | ClinicalTrials.gov (NCT00788307) Gene Therapy and Radioactive Iodine in Treating Patients With Locally Recurrent Prostate Cancer That Did Not Respond to External-Beam Radiation Therapy. U.S. NationalInstitutes of Health. | |||||
If You Find Any Error in Data or Bug in Web Service, Please Kindly Report It to Dr. Zhou and Dr. Zhang.

