Target Information
| Target General Information | Top | |||||
|---|---|---|---|---|---|---|
| Target ID |
T19244
|
|||||
| Target Name |
S-mephenytoin 4-hydroxylase (CYP2C9)
|
|||||
| Synonyms |
Cytochrome P450 PB-1; Cytochrome P450 MP-8; Cytochrome P450 MP-4; Cytochrome P450 2C9; Cytochrome P-450MP; Cholesterol 25-hydroxylase; CYPIIC9; CYP2C10; (S)-limonene 7-monooxygenase; (S)-limonene 6-monooxygenase; (R)-limonene 6-monooxygenase
Click to Show/Hide
|
|||||
| Gene Name |
CYP2C9
|
|||||
| Target Type |
Successful target
|
[1] | ||||
| Disease | [+] 1 Target-related Diseases | + | ||||
| 1 | Bacterial infection [ICD-11: 1A00-1C4Z] | |||||
| Function |
In liver microsomes, this enzyme is involved in an NADPH-dependent electron transport pathway. It oxidizes a variety of structurally unrelated compounds, including steroids, fatty acids, and xenobiotics. This enzyme contributes to the wide pharmacokinetics variability of the metabolism of drugs such as S-warfarin, diclofenac, phenytoin, tolbutamide and losartan. Cytochromes P450 are a group of heme-thiolate monooxygenases.
Click to Show/Hide
|
|||||
| BioChemical Class |
Paired donor oxygen oxidoreductase
|
|||||
| UniProt ID | ||||||
| EC Number |
EC 1.14.14.-
|
|||||
| Sequence |
MDSLVVLVLCLSCLLLLSLWRQSSGRGKLPPGPTPLPVIGNILQIGIKDISKSLTNLSKV
YGPVFTLYFGLKPIVVLHGYEAVKEALIDLGEEFSGRGIFPLAERANRGFGIVFSNGKKW KEIRRFSLMTLRNFGMGKRSIEDRVQEEARCLVEELRKTKASPCDPTFILGCAPCNVICS IIFHKRFDYKDQQFLNLMEKLNENIKILSSPWIQICNNFSPIIDYFPGTHNKLLKNVAFM KSYILEKVKEHQESMDMNNPQDFIDCFLMKMEKEKHNQPSEFTIESLENTAVDLFGAGTE TTSTTLRYALLLLLKHPEVTAKVQEEIERVIGRNRSPCMQDRSHMPYTDAVVHEVQRYID LLPTSLPHAVTCDIKFRNYLIPKGTTILISLTSVLHDNKEFPNPEMFDPHHFLDEGGNFK KSKYFMPFSAGKRICVGEALAGMELFLFLTSILQNFNLKSLVDPKNLDTTPVVNGFASVP PFYQLCFIPV Click to Show/Hide
|
|||||
| 3D Structure | Click to Show 3D Structure of This Target | PDB | ||||
| ADReCS ID | BADD_A01337 ; BADD_A02053 ; BADD_A02189 ; BADD_A05391 ; BADD_A05554 ; BADD_A06627 | |||||
| HIT2.0 ID | T69RXK | |||||
| Drugs and Modes of Action | Top | |||||
|---|---|---|---|---|---|---|
| Approved Drug(s) | [+] 1 Approved Drugs | + | ||||
| 1 | Sulfaphenazole | Drug Info | Approved | Bacterial infection | [2] | |
| Mode of Action | [+] 1 Modes of Action | + | ||||
| Modulator | [+] 1 Modulator drugs | + | ||||
| 1 | Sulfaphenazole | Drug Info | [1] | |||
| Cell-based Target Expression Variations | Top | |||||
|---|---|---|---|---|---|---|
| Cell-based Target Expression Variations | ||||||
| Drug Binding Sites of Target | Top | |||||
|---|---|---|---|---|---|---|
| Ligand Name: Flurbiprofen | Ligand Info | |||||
| Structure Description | Crystal Structure of P4502C9 with Flurbiprofen bound | PDB:1R9O | ||||
| Method | X-ray diffraction | Resolution | 2.00 Å | Mutation | Yes | [3] |
| PDB Sequence |
RGKLPPGPTP
35 LPLQIGIKDI50 SKSLTNLSKV60 YGPVFTLYFG70 LKPIVVLHGY80 EAVKEALIDL 90 GEEFSGRGIF100 PLAERANRGF110 GIVFSNGKKW120 KEIRRFSLMT130 LRNFGMGKRS 140 IEDRVQEEAR150 CLVEELRKTK160 ASPCDPTFIL170 GCAPCNVICS180 IIFHKRFDYK 190 DQQFLNLMEK200 LNENIKILSS210 PWIPIIDYFP227 GTHNKLLKNV237 AFMKSYILEK 247 VKEHQESMDM257 NNPQDFIDCF267 LMKMEKEKHN277 QPSEFTIESL287 ENTAVDLFGA 297 GTETTSTTLR307 YALLLLLKHP317 EVTAKVQEEI327 ERVIGRNRSP337 CMQDRSHMPY 347 TDAVVHEVQR357 YIDLLPTSLP367 HAVTCDIKFR377 NYLIPKGTTI387 LISLTSVLHD 397 NKEFPNPEMF407 DPHHFLDEGG417 NFKKSKYFMP427 FSAGKRICVG437 EALAGMELFL 447 FLTSILQNFN457 LKSLVDPKNL467 DTTPVVNGFA477 SVPPFYQLCF487 IPIHH |
|||||
|
|
||||||
| Ligand Name: Losartan | Ligand Info | |||||
| Structure Description | Crystal structure of CYP2C9 genetic variant A477T (*30) in complex with multiple losartan molecules | PDB:5X23 | ||||
| Method | X-ray diffraction | Resolution | 2.00 Å | Mutation | Yes | [4] |
| PDB Sequence |
KLPPGPTPLP
37 VIGNILQIGI47 KDISKSLTNL57 SKVYGPVFTL67 YFGLKPIVVL77 HGYEAVKEAL 87 IDLGEEFSGR97 GIFPLAERAN107 RGFGIVFSNG117 KKWKEIRRFS127 LMTLRNFGMG 137 KRSIEDRVQE147 EARCLVEELR157 KTKASPCDPT167 FILGCAPCNV177 ICSIIFHKRF 187 DYKDQQFLNL197 MEKLNENIKI207 LSSPWIQICN217 NFSPIIDYFP227 GTHNKLLKNV 237 AFMKSYILEK247 VKEHQESMDM257 NNPQDFIDCF267 LMKMEKEKHN277 QPSEFTIESL 287 ENTAVDLFGA297 GTETTSTTLR307 YALLLLLKHP317 EVTAKVQEEI327 ERVIGRNRSP 337 CMQDRSHMPY347 TDAVVHEVQR357 YIDLLPTSLP367 HAVTCDIKFR377 NYLIPKGTTI 387 LISLTSVLHD397 NKEFPNPEMF407 DPHHFLDEGG417 NFKKSKYFMP427 FSAGKRICVG 437 EALAGMELFL447 FLTSILQNFN457 LKSLVDPKNL467 DTTPVVNGFT477 SVPPFYQLCF 487 IPI
|
|||||
|
|
PHE69
3.824
ILE74
4.556
GLY98
4.833
ILE99
4.940
PHE100
3.539
LEU102
4.151
ALA103
3.842
ALA106
3.591
ASN107
4.640
ARG108
2.147
VAL113
3.843
PHE114
3.982
LYS200
4.301
LEU201
2.739
ASN204
3.174
ILE205
4.170
LEU208
3.668
ILE213
4.795
GLN214
2.791
ILE215
4.861
ASN218
2.371
TYR225
4.225
PHE226
3.368
PRO227
3.410
GLY228
3.012
THR229
3.079
ASN231
3.436
LYS232
3.188
LEU233
4.046
LYS235
4.554
ASN236
3.530
VAL237
3.614
MET240
2.957
VAL292
3.689
ASP293
3.180
GLY296
3.580
ALA297
3.412
THR301
4.717
LEU361
4.658
LEU362
3.774
PRO363
3.078
THR364
2.867
SER365
2.214
LEU366
3.840
PRO367
3.324
LEU388
4.091
PHE476
2.286
THR477
4.255
|
|||||
| Click to View More Binding Site Information of This Target and Ligand Pair | ||||||
| Click to View More Binding Site Information of This Target with Different Ligands | ||||||
| Different Human System Profiles of Target | Top |
|---|---|
|
Human Similarity Proteins
of target is determined by comparing the sequence similarity of all human proteins with the target based on BLAST. The similarity proteins for a target are defined as the proteins with E-value < 0.005 and outside the protein families of the target.
A target that has fewer human similarity proteins outside its family is commonly regarded to possess a greater capacity to avoid undesired interactions and thus increase the possibility of finding successful drugs
(Brief Bioinform, 21: 649-662, 2020).
Human Tissue Distribution
of target is determined from a proteomics study that quantified more than 12,000 genes across 32 normal human tissues. Tissue Specificity (TS) score was used to define the enrichment of target across tissues.
The distribution of targets among different tissues or organs need to be taken into consideration when assessing the target druggability, as it is generally accepted that the wider the target distribution, the greater the concern over potential adverse effects
(Nat Rev Drug Discov, 20: 64-81, 2021).
Human Pathway Affiliation
of target is determined by the life-essential pathways provided on KEGG database. The target-affiliated pathways were defined based on the following two criteria (a) the pathways of the studied target should be life-essential for both healthy individuals and patients, and (b) the studied target should occupy an upstream position in the pathways and therefore had the ability to regulate biological function.
Targets involved in a fewer pathways have greater likelihood to be successfully developed, while those associated with more human pathways increase the chance of undesirable interferences with other human processes
(Pharmacol Rev, 58: 259-279, 2006).
Biological Network Descriptors
of target is determined based on a human protein-protein interactions (PPI) network consisting of 9,309 proteins and 52,713 PPIs, which were with a high confidence score of ≥ 0.95 collected from STRING database.
The network properties of targets based on protein-protein interactions (PPIs) have been widely adopted for the assessment of target’s druggability. Proteins with high node degree tend to have a high impact on network function through multiple interactions, while proteins with high betweenness centrality are regarded to be central for communication in interaction networks and regulate the flow of signaling information
(Front Pharmacol, 9, 1245, 2018;
Curr Opin Struct Biol. 44:134-142, 2017).
Human Similarity Proteins
Human Tissue Distribution
Human Pathway Affiliation
Biological Network Descriptors
|
|
|
There is no similarity protein (E value < 0.005) for this target
|
|
Note:
If a protein has TS (tissue specficity) scores at least in one tissue >= 2.5, this protein is called tissue-enriched (including tissue-enriched-but-not-specific and tissue-specific). In the plots, the vertical lines are at thresholds 2.5 and 4.
|
| KEGG Pathway | Pathway ID | Affiliated Target | Pathway Map |
|---|---|---|---|
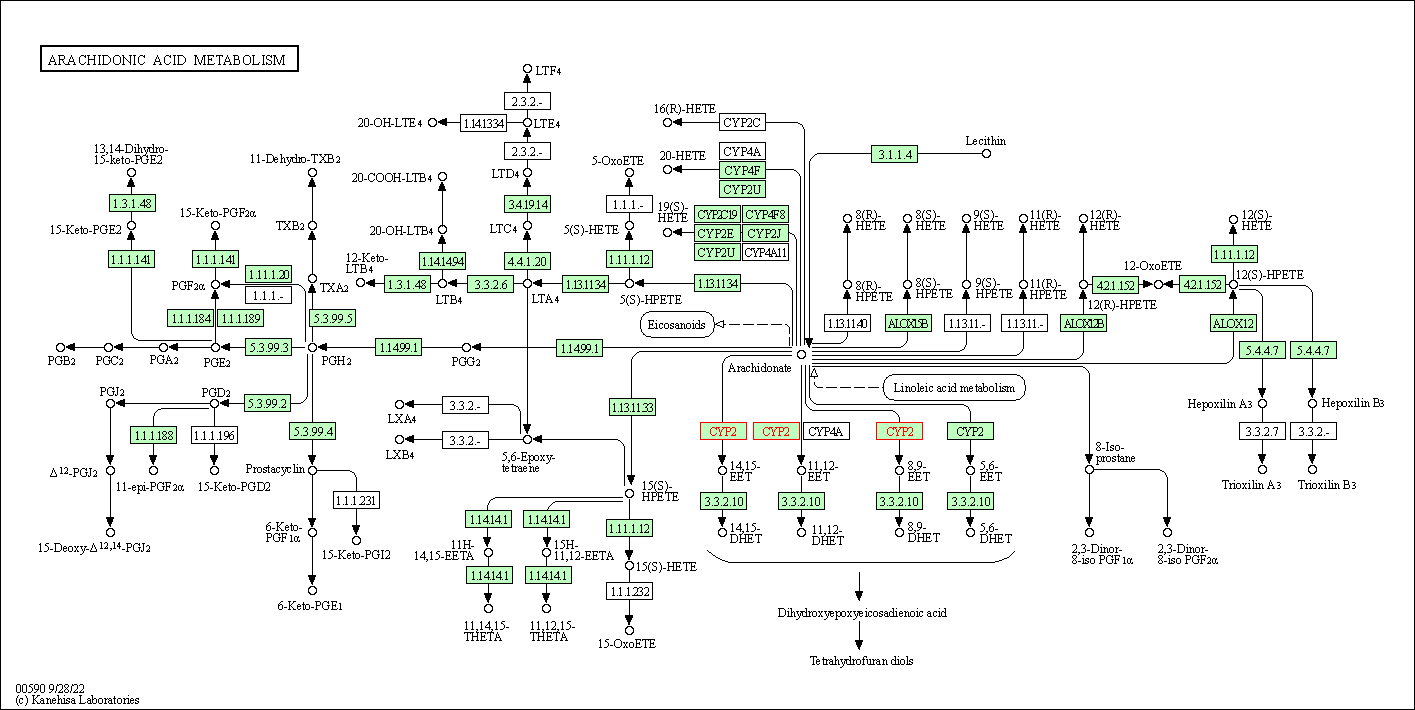
| Arachidonic acid metabolism | hsa00590 | Affiliated Target |
|
| Class: Metabolism => Lipid metabolism | Pathway Hierarchy | ||
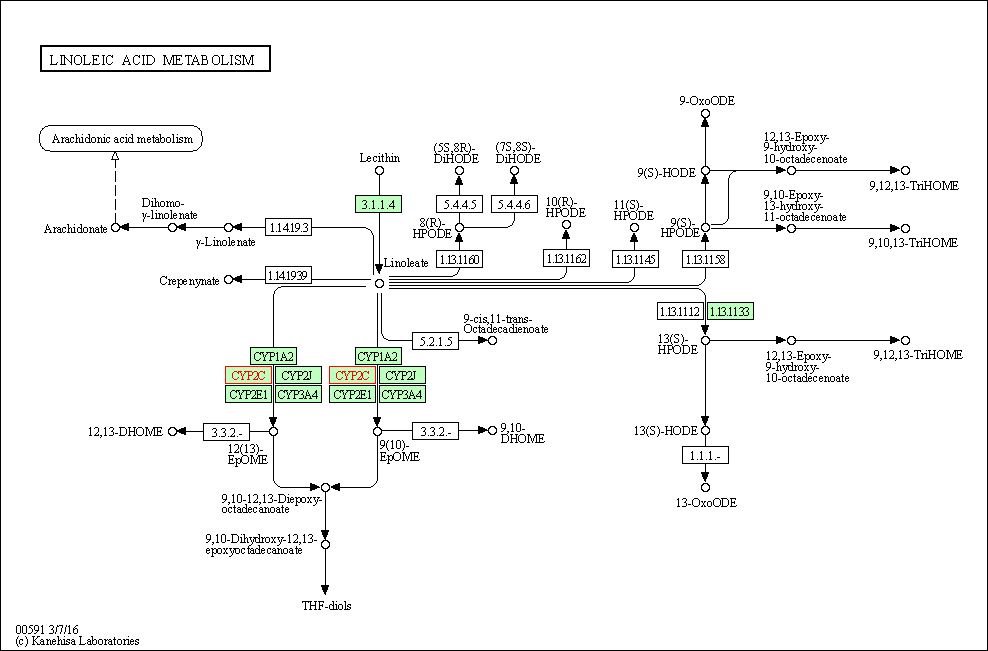
| Linoleic acid metabolism | hsa00591 | Affiliated Target |
|
| Class: Metabolism => Lipid metabolism | Pathway Hierarchy | ||
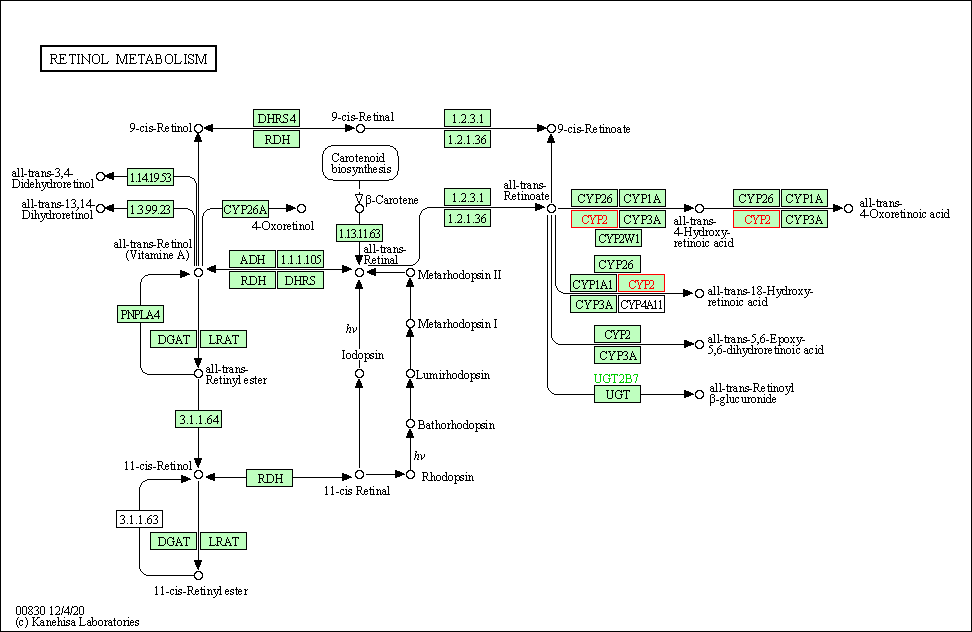
| Retinol metabolism | hsa00830 | Affiliated Target |
|
| Class: Metabolism => Metabolism of cofactors and vitamins | Pathway Hierarchy | ||
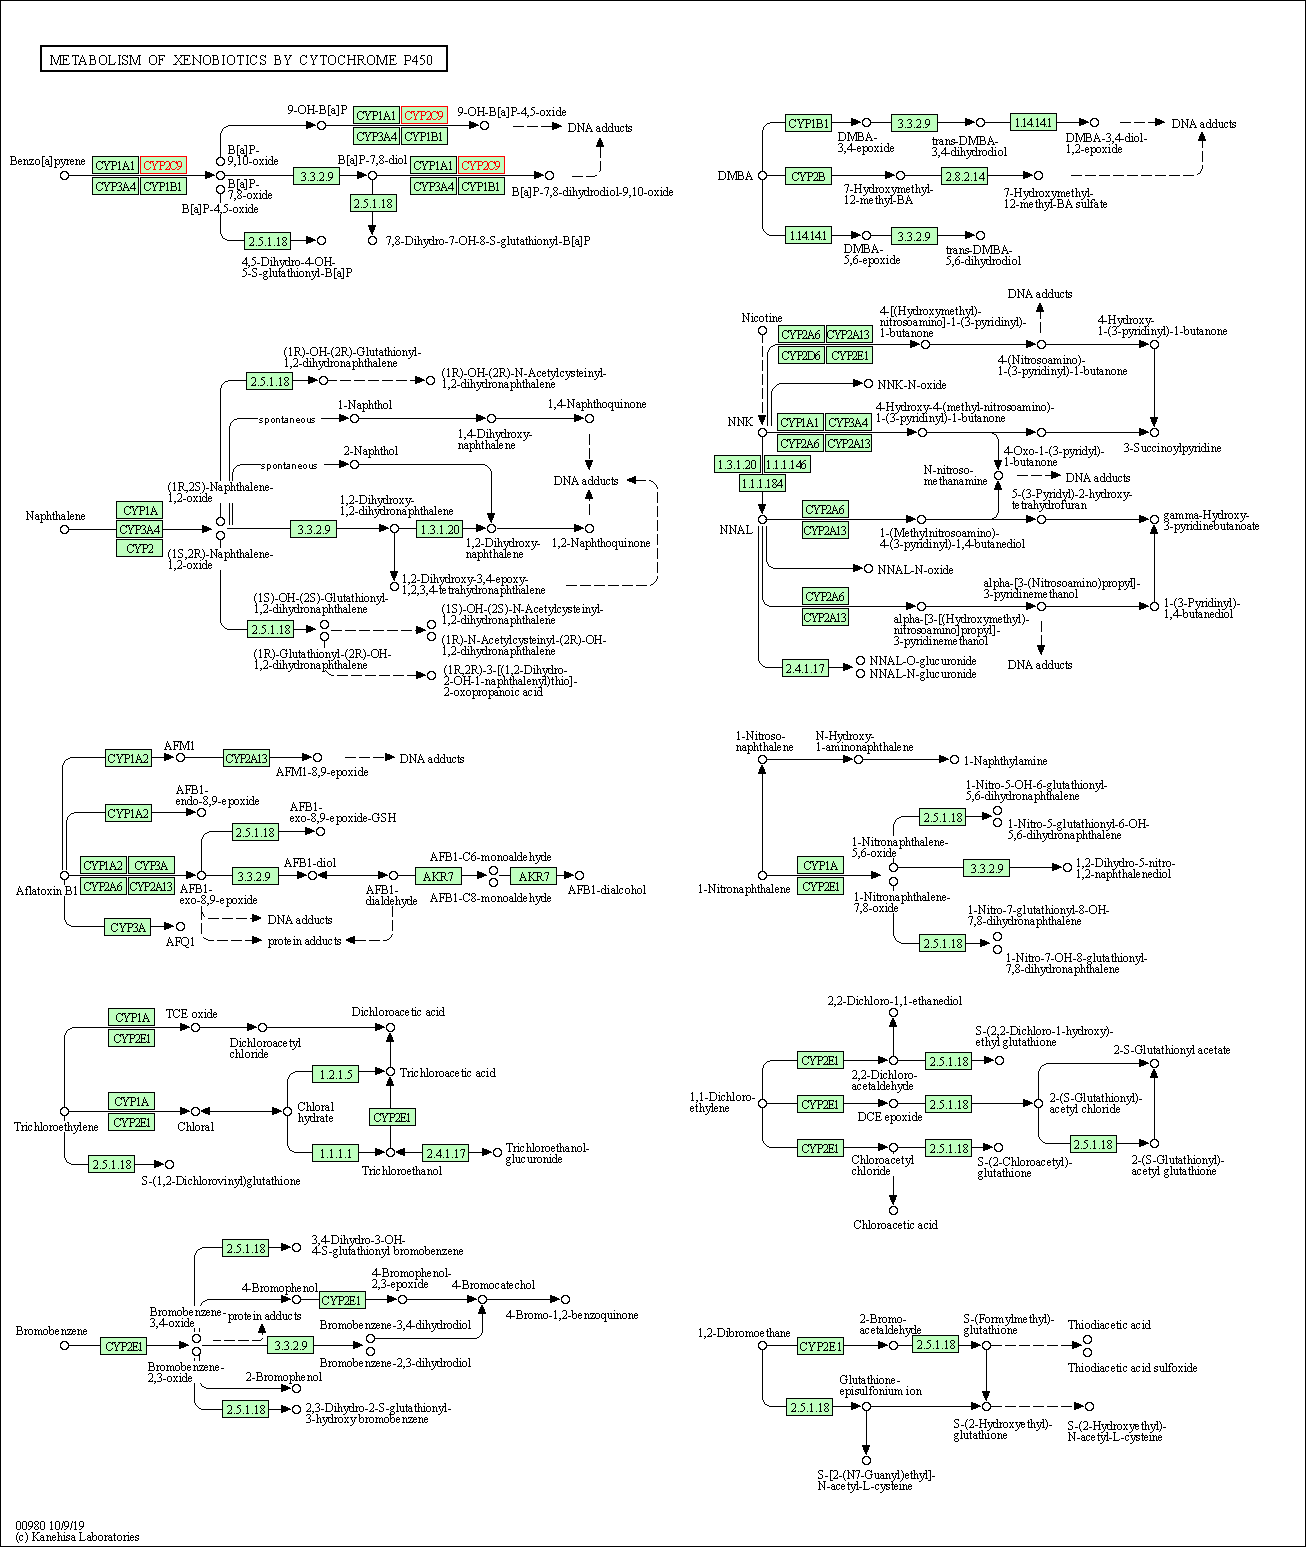
| Metabolism of xenobiotics by cytochrome P450 | hsa00980 | Affiliated Target |
|
| Class: Metabolism => Xenobiotics biodegradation and metabolism | Pathway Hierarchy | ||
| Drug metabolism - cytochrome P450 | hsa00982 | Affiliated Target |
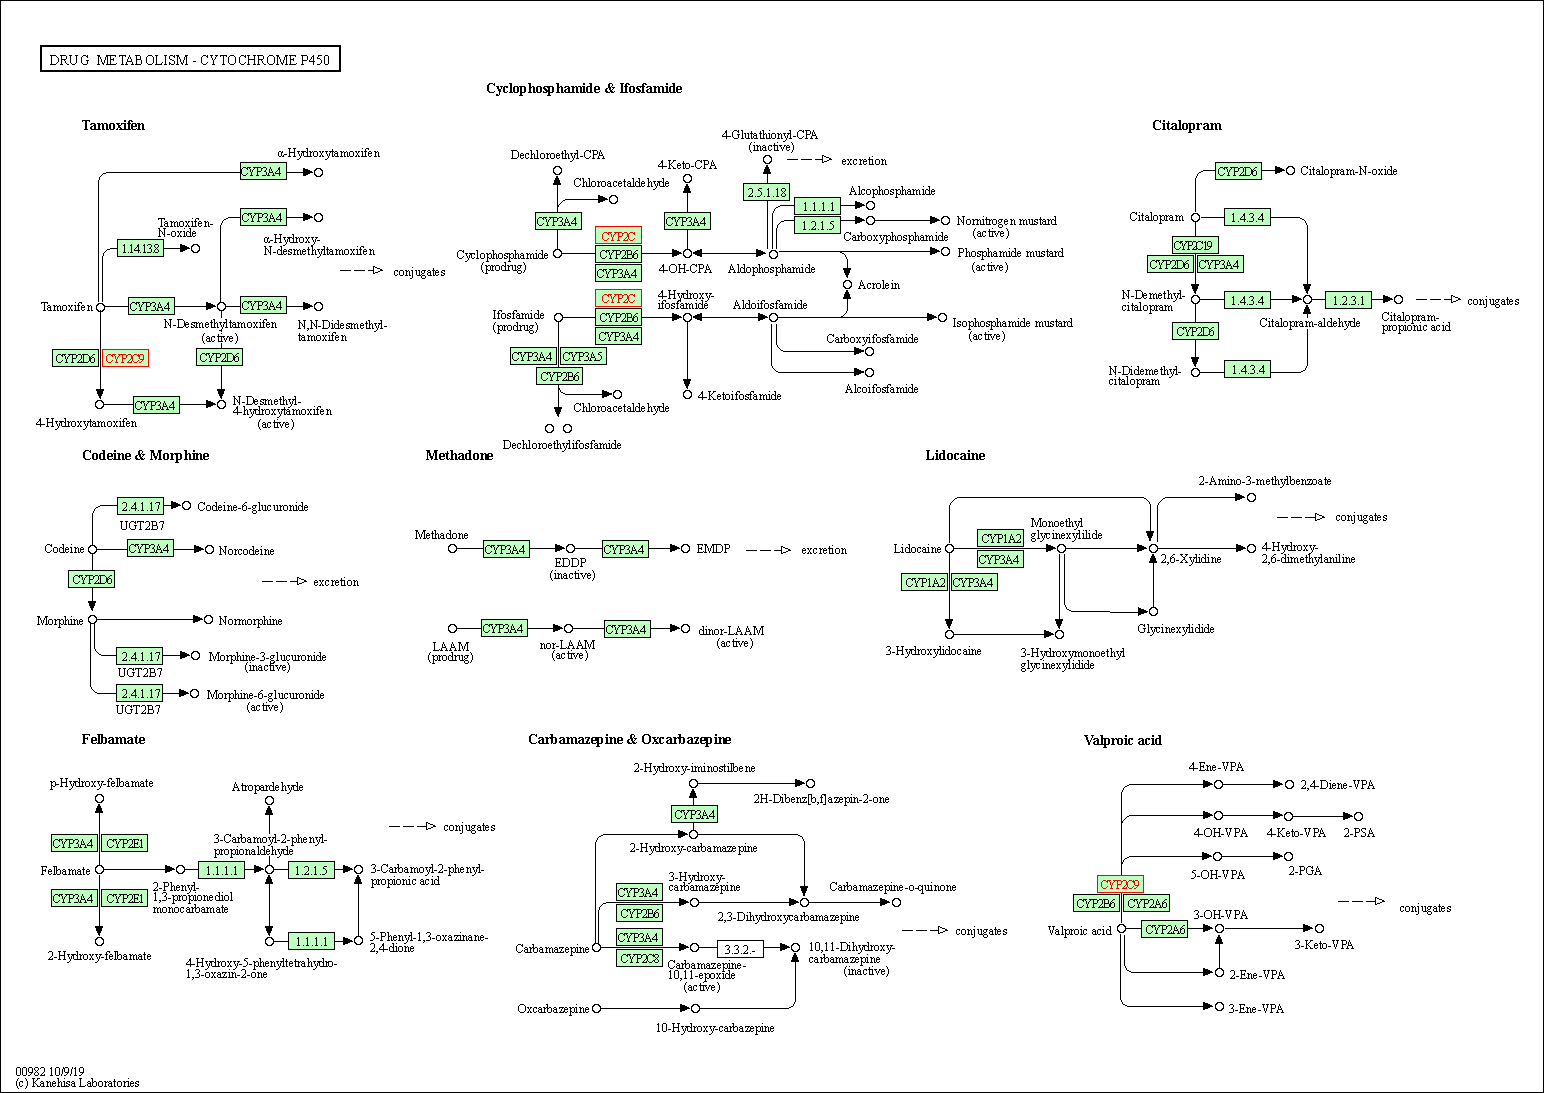
|
| Class: Metabolism => Xenobiotics biodegradation and metabolism | Pathway Hierarchy | ||
| Serotonergic synapse | hsa04726 | Affiliated Target |
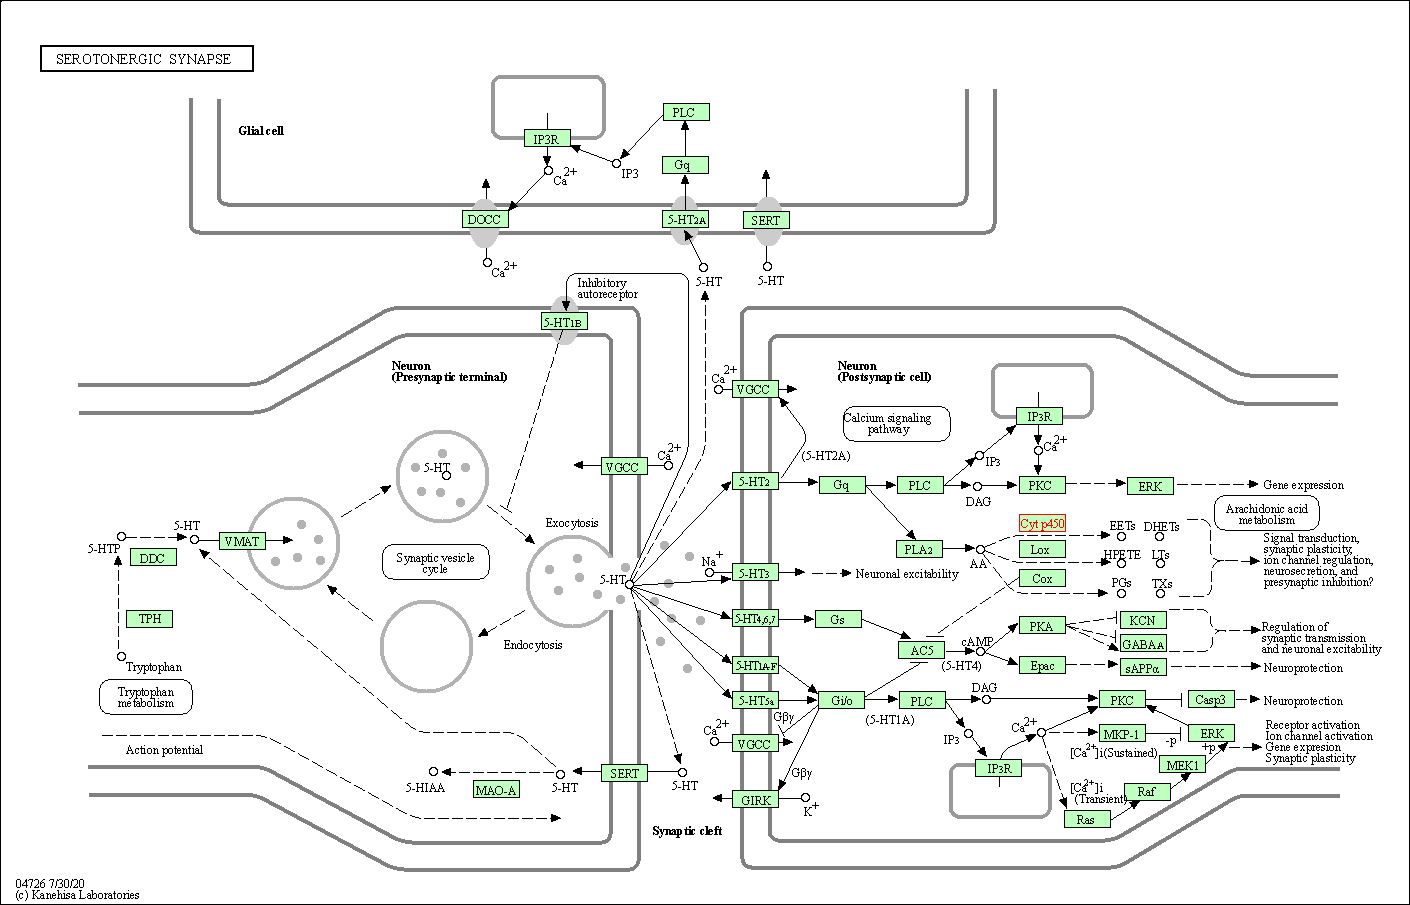
|
| Class: Organismal Systems => Nervous system | Pathway Hierarchy | ||
| Click to Show/Hide the Information of Affiliated Human Pathways | |||
| Degree | 8 | Degree centrality | 8.59E-04 | Betweenness centrality | 6.59E-04 |
|---|---|---|---|---|---|
| Closeness centrality | 1.71E-01 | Radiality | 1.27E+01 | Clustering coefficient | 3.57E-02 |
| Neighborhood connectivity | 6.38E+00 | Topological coefficient | 2.16E-01 | Eccentricity | 12 |
| Download | Click to Download the Full PPI Network of This Target | ||||
| Chemical Structure based Activity Landscape of Target | Top |
|---|---|
| Target Poor or Non Binders | Top | |||||
|---|---|---|---|---|---|---|
| Target Poor or Non Binders | ||||||
| Target Regulators | Top | |||||
|---|---|---|---|---|---|---|
| Target-regulating microRNAs | ||||||
| References | Top | |||||
|---|---|---|---|---|---|---|
| REF 1 | Identification of amino acid substitutions that confer a high affinity for sulfaphenazole binding and a high catalytic efficiency for warfarin meta... Biochemistry. 1998 Nov 17;37(46):16270-9. | |||||
| REF 2 | Drugs@FDA. U.S. Food and Drug Administration. U.S. Department of Health & Human Services. 2015 | |||||
| REF 3 | The structure of human cytochrome P450 2C9 complexed with flurbiprofen at 2.0-A resolution. J Biol Chem. 2004 Aug 20;279(34):35630-7. | |||||
| REF 4 | Structural Basis of Single-Nucleotide Polymorphisms in Cytochrome P450 2C9. Biochemistry. 2017 Oct 17;56(41):5476-5480. | |||||
If You Find Any Error in Data or Bug in Web Service, Please Kindly Report It to Dr. Zhou and Dr. Zhang.

