Target Information
| Target General Information | Top | |||||
|---|---|---|---|---|---|---|
| Target ID |
T73712
(Former ID: TTDR00634)
|
|||||
| Target Name |
Fatty acid-binding protein 1 (FABP1)
|
|||||
| Synonyms |
L-FABP; FABP1; 14-kDa fatty-acid binding protein; 14 kDa selenium-binding protein
Click to Show/Hide
|
|||||
| Gene Name |
FABP1
|
|||||
| Target Type |
Successful target
|
[1] | ||||
| Disease | [+] 1 Target-related Diseases | + | ||||
| 1 | Cardiovascular disease [ICD-11: BA00-BE2Z] | |||||
| Function |
Binds free fatty acids andtheir coenzyme A derivatives, bilirubin, and some other small molecules in the cytoplasm. May be involved in intracellular lipid transport.
Click to Show/Hide
|
|||||
| UniProt ID | ||||||
| Sequence |
MSFSGKYQLQSQENFEAFMKAIGLPEELIQKGKDIKGVSEIVQNGKHFKFTITAGSKVIQ
NEFTVGEECELETMTGEKVKTVVQLEGDNKLVTTFKNIKSVTELNGDIITNTMTLGDIVF KRISKRI Click to Show/Hide
|
|||||
| 3D Structure | Click to Show 3D Structure of This Target | PDB | ||||
| HIT2.0 ID | T19XSL | |||||
| Drugs and Modes of Action | Top | |||||
|---|---|---|---|---|---|---|
| Approved Drug(s) | [+] 1 Approved Drugs | + | ||||
| 1 | FENOFIBRIC ACID | Drug Info | Approved | Cardiovascular disease | [2] | |
| Discontinued Drug(s) | [+] 1 Discontinued Drugs | + | ||||
| 1 | INDOPROFEN | Drug Info | Withdrawn from market | Gout | [3] | |
| Mode of Action | [+] 1 Modes of Action | + | ||||
| Inhibitor | [+] 4 Inhibitor drugs | + | ||||
| 1 | FENOFIBRIC ACID | Drug Info | [1] | |||
| 2 | INDOPROFEN | Drug Info | [1] | |||
| 3 | 1-anilinonaphthalene-8-sulfonic acid | Drug Info | [1] | |||
| 4 | OLEIC ACID | Drug Info | [1] | |||
| Cell-based Target Expression Variations | Top | |||||
|---|---|---|---|---|---|---|
| Cell-based Target Expression Variations | ||||||
| Drug Binding Sites of Target | Top | |||||
|---|---|---|---|---|---|---|
| Ligand Name: Marinol | Ligand Info | |||||
| Structure Description | Human liver FABP1 bound to tetrahydrocannabinol | PDB:6MP4 | ||||
| Method | X-ray diffraction | Resolution | 2.50 Å | Mutation | No | [4] |
| PDB Sequence |
GTENLYFQSM
1 SFSGKYQLQS11 QENFEAFMKA21 IGLPEELIQK31 GKDIKGVSEI41 VQNGKHFKFT 51 ITAGSKVIQN61 EFTVGEECEL71 ETMTGEKVKT81 VVQLEGDNKL91 VTTFKNIKSV 101 TELNGDIITN111 TMTLGDIVFK121 RISKRI
|
|||||
|
|
PHE18
3.494
MET19
3.944
ILE22
4.280
PHE50
3.583
ILE52
3.503
ALA54
3.494
ILE59
4.553
ASN61
4.049
PHE63
3.896
LEU71
4.255
GLU72
2.807
THR73
3.787
|
|||||
| Ligand Name: Oleic acid | Ligand Info | |||||
| Structure Description | Human L-FABP in complex with oleate | PDB:2LKK | ||||
| Method | Solution NMR | Resolution | N.A. | Mutation | No | [5] |
| PDB Sequence |
SFSGKYQLQS
11 QENFEAFMKA21 IGLPEELIQK31 GKDIKGVSEI41 VQNGKHFKFT51 ITAGSKVIQN 61 EFTVGEECEL71 ETMTGEKVKT81 VVQLEGDNKL91 VTTFKNIKSV101 TELNGDIITN 111 TMTLGDIVFK121 RISKRI
|
|||||
|
|
TYR7
3.449
LEU9
3.315
GLN12
4.173
PHE15
2.276
PHE18
2.641
MET19
2.229
ILE22
4.047
LEU24
2.795
GLU27
4.548
LEU28
2.284
ILE29
3.293
LYS31
1.561
GLY32
2.554
ILE35
4.113
SER39
1.377
GLU40
4.535
ILE41
2.409
PHE50
2.498
ILE52
2.248
THR53
4.097
ALA54
2.299
GLY55
2.255
SER56
1.361
LYS57
2.980
ILE59
2.804
PHE63
2.486
LEU71
2.328
GLU72
2.594
THR73
2.290
MET74
2.381
THR75
4.102
THR81
3.422
VAL83
2.899
LEU91
4.079
THR93
3.133
PHE95
2.384
ILE98
3.999
SER100
3.270
THR102
2.174
ILE109
2.364
THR110
4.798
ASN111
2.415
MET113
2.376
PHE120
2.331
ARG122
1.753
ILE123
4.657
SER124
1.361
|
|||||
| Click to View More Binding Site Information of This Target with Different Ligands | ||||||
| Different Human System Profiles of Target | Top |
|---|---|
|
Human Similarity Proteins
of target is determined by comparing the sequence similarity of all human proteins with the target based on BLAST. The similarity proteins for a target are defined as the proteins with E-value < 0.005 and outside the protein families of the target.
A target that has fewer human similarity proteins outside its family is commonly regarded to possess a greater capacity to avoid undesired interactions and thus increase the possibility of finding successful drugs
(Brief Bioinform, 21: 649-662, 2020).
Human Tissue Distribution
of target is determined from a proteomics study that quantified more than 12,000 genes across 32 normal human tissues. Tissue Specificity (TS) score was used to define the enrichment of target across tissues.
The distribution of targets among different tissues or organs need to be taken into consideration when assessing the target druggability, as it is generally accepted that the wider the target distribution, the greater the concern over potential adverse effects
(Nat Rev Drug Discov, 20: 64-81, 2021).
Human Pathway Affiliation
of target is determined by the life-essential pathways provided on KEGG database. The target-affiliated pathways were defined based on the following two criteria (a) the pathways of the studied target should be life-essential for both healthy individuals and patients, and (b) the studied target should occupy an upstream position in the pathways and therefore had the ability to regulate biological function.
Targets involved in a fewer pathways have greater likelihood to be successfully developed, while those associated with more human pathways increase the chance of undesirable interferences with other human processes
(Pharmacol Rev, 58: 259-279, 2006).
Biological Network Descriptors
of target is determined based on a human protein-protein interactions (PPI) network consisting of 9,309 proteins and 52,713 PPIs, which were with a high confidence score of ≥ 0.95 collected from STRING database.
The network properties of targets based on protein-protein interactions (PPIs) have been widely adopted for the assessment of target’s druggability. Proteins with high node degree tend to have a high impact on network function through multiple interactions, while proteins with high betweenness centrality are regarded to be central for communication in interaction networks and regulate the flow of signaling information
(Front Pharmacol, 9, 1245, 2018;
Curr Opin Struct Biol. 44:134-142, 2017).
Human Similarity Proteins
Human Tissue Distribution
Human Pathway Affiliation
Biological Network Descriptors
|
|
|
Note:
If a protein has TS (tissue specficity) scores at least in one tissue >= 2.5, this protein is called tissue-enriched (including tissue-enriched-but-not-specific and tissue-specific). In the plots, the vertical lines are at thresholds 2.5 and 4.
|


| KEGG Pathway | Pathway ID | Affiliated Target | Pathway Map |
|---|---|---|---|
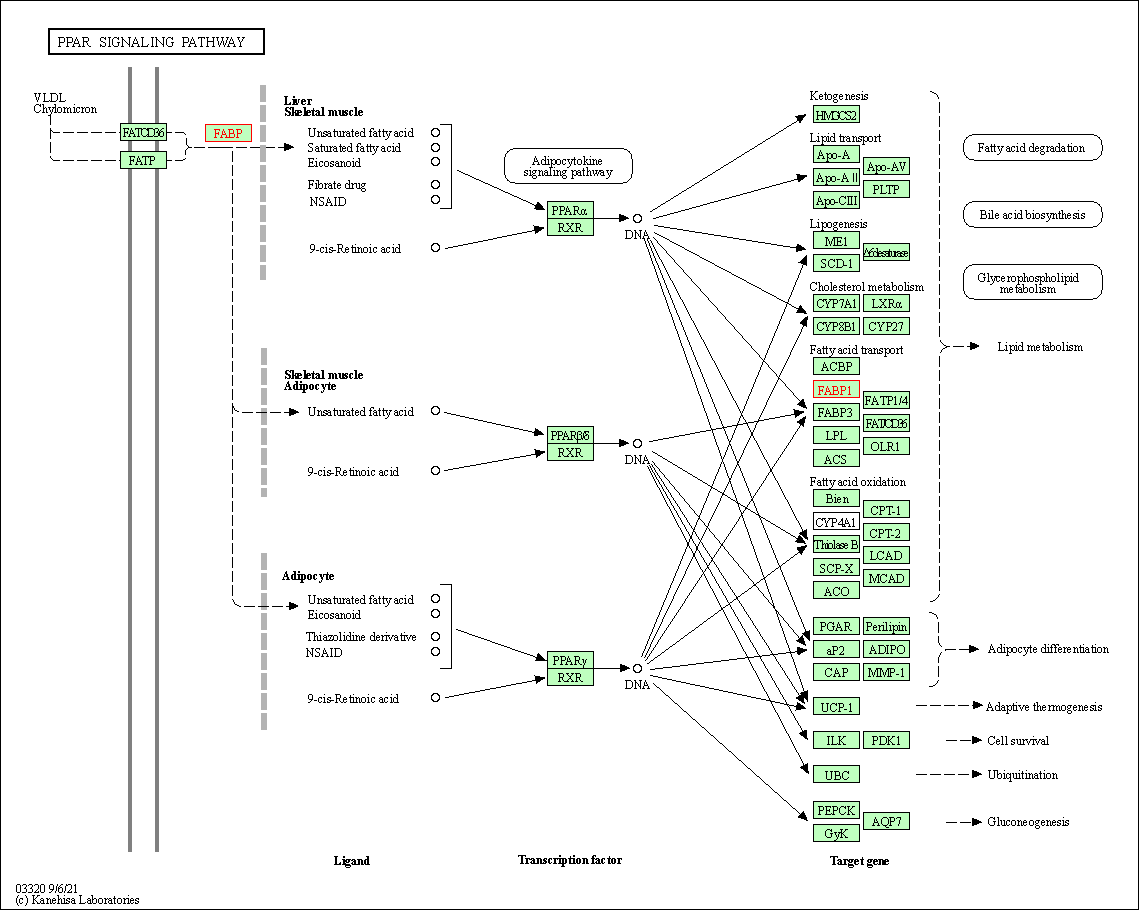
| PPAR signaling pathway | hsa03320 | Affiliated Target |

|
| Class: Organismal Systems => Endocrine system | Pathway Hierarchy | ||
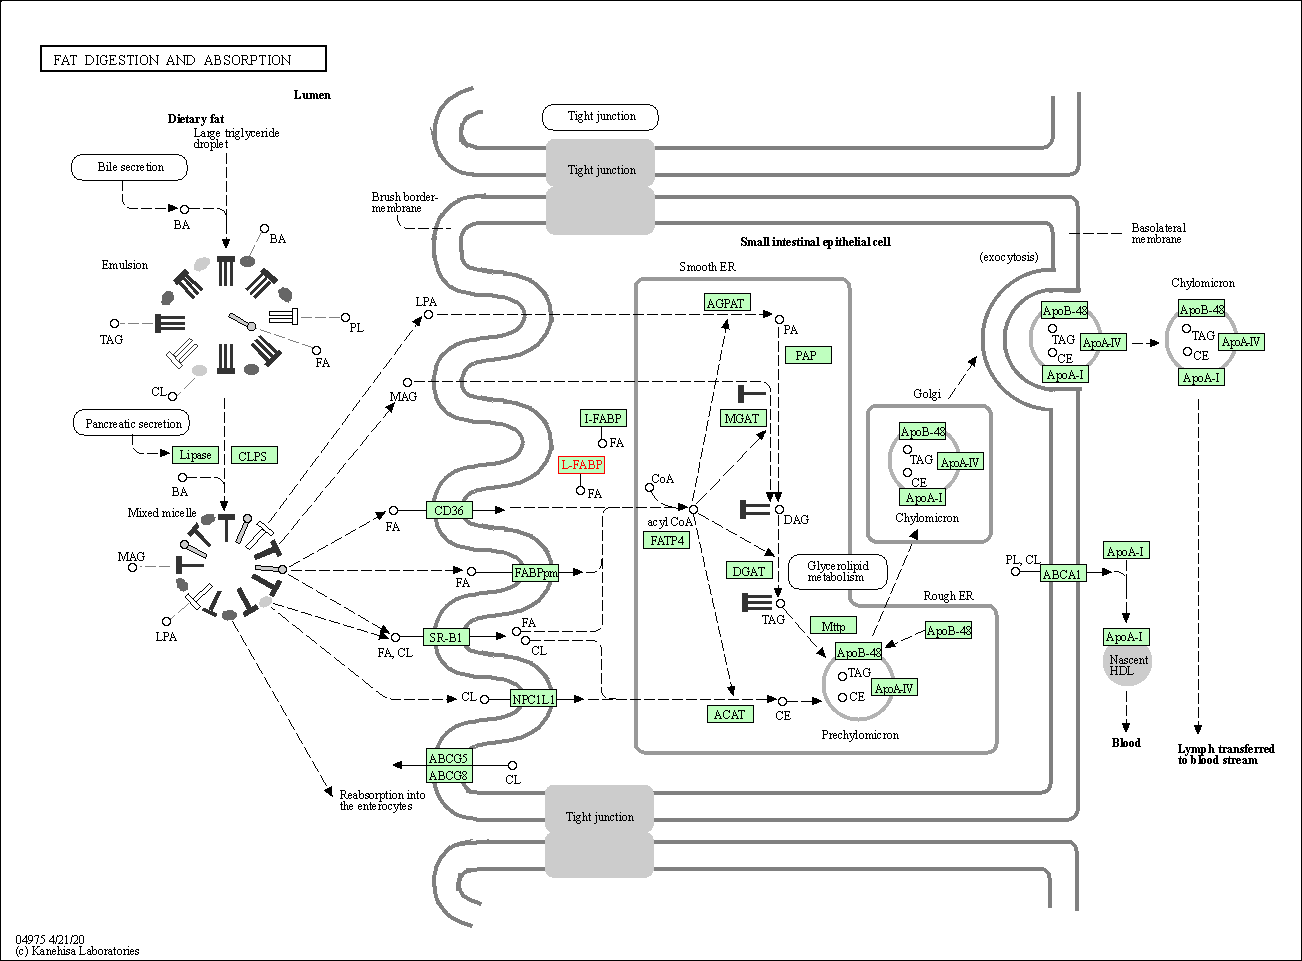
| Fat digestion and absorption | hsa04975 | Affiliated Target |

|
| Class: Organismal Systems => Digestive system | Pathway Hierarchy | ||
| Degree | 7 | Degree centrality | 7.52E-04 | Betweenness centrality | 1.79E-04 |
|---|---|---|---|---|---|
| Closeness centrality | 2.07E-01 | Radiality | 1.36E+01 | Clustering coefficient | 5.24E-01 |
| Neighborhood connectivity | 2.93E+01 | Topological coefficient | 2.22E-01 | Eccentricity | 11 |
| Download | Click to Download the Full PPI Network of This Target | ||||
| Drug Property Profile of Target | Top | |
|---|---|---|
| (1) Molecular Weight (mw) based Drug Clustering | (2) Octanol/Water Partition Coefficient (xlogp) based Drug Clustering | |
|
|
||
| (3) Hydrogen Bond Donor Count (hbonddonor) based Drug Clustering | (4) Hydrogen Bond Acceptor Count (hbondacc) based Drug Clustering | |
|
|
||
| (5) Rotatable Bond Count (rotbonds) based Drug Clustering | (6) Topological Polar Surface Area (polararea) based Drug Clustering | |
|
|
||
| "RO5" indicates the cutoff set by lipinski's rule of five; "D123AB" colored in GREEN denotes the no violation of any cutoff in lipinski's rule of five; "D123AB" colored in PURPLE refers to the violation of only one cutoff in lipinski's rule of five; "D123AB" colored in BLACK represents the violation of more than one cutoffs in lipinski's rule of five | ||
| Co-Targets | Top | |||||
|---|---|---|---|---|---|---|
| Co-Targets | ||||||
| Target Affiliated Biological Pathways | Top | |||||
|---|---|---|---|---|---|---|
| KEGG Pathway | [+] 2 KEGG Pathways | + | ||||
| 1 | PPAR signaling pathway | |||||
| 2 | Fat digestion and absorption | |||||
| Reactome | [+] 3 Reactome Pathways | + | ||||
| 1 | Hormone-sensitive lipase (HSL)-mediated triacylglycerol hydrolysis | |||||
| 2 | PPARA activates gene expression | |||||
| 3 | Regulation of lipid metabolism by Peroxisome proliferator-activated receptor alpha (PPARalpha) | |||||
| WikiPathways | [+] 4 WikiPathways | + | ||||
| 1 | Nuclear Receptors Meta-Pathway | |||||
| 2 | PPAR Alpha Pathway | |||||
| 3 | Selenium Metabolism and Selenoproteins | |||||
| 4 | Regulation of Lipid Metabolism by Peroxisome proliferator-activated receptor alpha (PPARalpha) | |||||
| Target-Related Models and Studies | Top | |||||
|---|---|---|---|---|---|---|
| Target Validation | ||||||
| References | Top | |||||
|---|---|---|---|---|---|---|
| REF 1 | Characterization of the drug binding specificity of rat liver fatty acid binding protein. J Med Chem. 2008 Jul 10;51(13):3755-64. | |||||
| REF 2 | URL: http://www.guidetopharmacology.org Nucleic Acids Res. 2015 Oct 12. pii: gkv1037. The IUPHAR/BPS Guide to PHARMACOLOGY in 2016: towards curated quantitative interactions between 1300 protein targets and 6000 ligands. (Ligand id: 2662). | |||||
| REF 3 | Drugs@FDA. U.S. Food and Drug Administration. U.S. Department of Health & Human Services. 2015 | |||||
| REF 4 | Liver fatty acid-binding protein regulates THC metabolism by facilitating intracellular hepatic transport | |||||
| REF 5 | Solution structure and backbone dynamics of human liver fatty acid binding protein: fatty acid binding revisited. Biophys J. 2012 Jun 6;102(11):2585-94. | |||||
If You Find Any Error in Data or Bug in Web Service, Please Kindly Report It to Dr. Zhou and Dr. Zhang.

