Target Information
| Target General Information | Top | |||||
|---|---|---|---|---|---|---|
| Target ID |
T65889
(Former ID: TTDI02110)
|
|||||
| Target Name |
Pyruvate kinase M2 (PKM)
|
|||||
| Synonyms |
p58; Tumor M2-PK; Thyroid hormone-binding protein 1; THBP1; Pyruvate kinase muscle isozyme; Pyruvate kinase isozymes M1/M2; Pyruvate kinase PKM; Pyruvate kinase 2/3; PKM2; PK3; PK2; Opa-interacting protein 3; OIP3; OIP-3; Cytosolic thyroid hormone-binding protein; CTHBP
Click to Show/Hide
|
|||||
| Gene Name |
PKM
|
|||||
| Target Type |
Clinical trial target
|
[1] | ||||
| Disease | [+] 1 Target-related Diseases | + | ||||
| 1 | Renal cell carcinoma [ICD-11: 2C90] | |||||
| Function |
Stimulates POU5F1-mediated transcriptional activation. Plays a general role in caspase independent cell death of tumor cells. The ratio between the highly active tetrameric form and nearly inactive dimeric form determines whether glucose carbons are channeled to biosynthetic processes or used for glycolytic ATP production. The transition between the 2 forms contributes to the control of glycolysis and is important for tumor cell proliferation and survival. Promotes in a STAT1-dependent manner, the expression of the immune checkpoint protein CD274 in ARNTL/BMAL1-deficient macrophages. Glycolytic enzyme that catalyzes the transfer of a phosphoryl group from phosphoenolpyruvate (PEP) to ADP, generating ATP.
Click to Show/Hide
|
|||||
| BioChemical Class |
Kinase
|
|||||
| UniProt ID | ||||||
| EC Number |
EC 2.7.1.40
|
|||||
| Sequence |
MSKPHSEAGTAFIQTQQLHAAMADTFLEHMCRLDIDSPPITARNTGIICTIGPASRSVET
LKEMIKSGMNVARLNFSHGTHEYHAETIKNVRTATESFASDPILYRPVAVALDTKGPEIR TGLIKGSGTAEVELKKGATLKITLDNAYMEKCDENILWLDYKNICKVVEVGSKIYVDDGL ISLQVKQKGADFLVTEVENGGSLGSKKGVNLPGAAVDLPAVSEKDIQDLKFGVEQDVDMV FASFIRKASDVHEVRKVLGEKGKNIKIISKIENHEGVRRFDEILEASDGIMVARGDLGIE IPAEKVFLAQKMMIGRCNRAGKPVICATQMLESMIKKPRPTRAEGSDVANAVLDGADCIM LSGETAKGDYPLEAVRMQHLIAREAEAAIYHLQLFEELRRLAPITSDPTEATAVGAVEAS FKCCSGAIIVLTKSGRSAHQVARYRPRAPIIAVTRNPQTARQAHLYRGIFPVLCKDPVQE AWAEDVDLRVNFAMNVGKARGFFKKGDVVIVLTGWRPGSGFTNTMRVVPVP Click to Show/Hide
|
|||||
| 3D Structure | Click to Show 3D Structure of This Target | PDB | ||||
| HIT2.0 ID | T85NRC | |||||
| Drugs and Modes of Action | Top | |||||
|---|---|---|---|---|---|---|
| Clinical Trial Drug(s) | [+] 2 Clinical Trial Drugs | + | ||||
| 1 | CAP-232 | Drug Info | Phase 2a | Renal cell carcinoma | [2] | |
| 2 | TP-1454 | Drug Info | Phase 1 | Solid tumour/cancer | [3] | |
| Mode of Action | [+] 2 Modes of Action | + | ||||
| Modulator | [+] 1 Modulator drugs | + | ||||
| 1 | CAP-232 | Drug Info | [1] | |||
| Activator | [+] 1 Activator drugs | + | ||||
| 1 | TP-1454 | Drug Info | [4] | |||
| Cell-based Target Expression Variations | Top | |||||
|---|---|---|---|---|---|---|
| Cell-based Target Expression Variations | ||||||
| Drug Binding Sites of Target | Top | |||||
|---|---|---|---|---|---|---|
| Ligand Name: Pyruvic acid | Ligand Info | |||||
| Structure Description | Crystal structure of PKM2 mutant | PDB:4YJ5 | ||||
| Method | X-ray diffraction | Resolution | 2.41 Å | Mutation | Yes | [5] |
| PDB Sequence |
QTQQLHAAMA
23 DTFLEHMCRL33 DIDSPPITAR43 NTGIICTIGP53 ASRSVETLKE63 MIKSGMNVAR 73 LNFSHGTHEY83 HAETIKNVRT93 ATESFASDPI103 LYRPVAVALD113 TKGPEIRTGL 123 IKGSGTAEVE133 LKKGATLKIT143 LDNAYMEKCD153 ENILWLDYKN163 ICKVVEVGSK 173 IYVDDGLISL183 QVKQKGADFL193 VTEVENGGSL203 GSKKGVNLPG213 AAVDLPAVSE 223 KDIQDLKFGV233 EQDVDMVFAS243 FIRKASDVHE253 VRKVLGEKGK263 NIKIISKIEN 273 HEGVRRFDEI283 LEASDGIMVA293 RGDLGIEIPA303 EKVFLAQKMM313 IGRCNRAGKP 323 VICATQMLES333 MIKKPRPTRA343 EGSDVANAVL353 DGADCIMLSG363 ETAKGDYPLE 373 AVRMQHLIAR383 EAEAAIYYLQ393 LFEELRRLAP403 ITSDPTEATA413 VGAVEASFKC 423 CSGAIIVLTK433 SGRSAHQVAR443 YRPRAPIIAV453 TRNPQTARQA463 HLYRGIFPVL 473 CKDPVQEAWA483 EDVDLRVNFA493 MNVGKARGFF503 KKGDVVIVLT513 GWRPGSGFTN 523 TMRVVPVP
|
|||||
|
|
||||||
| Click to View More Binding Site Information of This Target and Ligand Pair | ||||||
| Ligand Name: L-phenylalanine | Ligand Info | |||||
| Structure Description | Crystal structure of M2 PYK in complex with Phenyalanine. | PDB:6GG4 | ||||
| Method | X-ray diffraction | Resolution | 2.46 Å | Mutation | No | [6] |
| PDB Sequence |
ADTFLEHMCR
32 LDIDSPPITA42 RNTGIICTIG52 PASRSVETLK62 EMIKSGMNVA72 RLNFSHGTHE 82 YHAETIKNVR92 TATESFASDP102 ILYRPVAVAL112 DTKGPEIRTG122 LIKGSGTAEV 132 ELKKGATLKI142 TLDNAYMEKC152 DENILWLDYK162 NICKVVEVGS172 KIYVDDGLIS 182 LQVKQKGADF192 LVTEVENGGS202 LGSKKGVNLP212 GAAVDLPAVS222 EKDIQDLKFG 232 VEQDVDMVFA242 SFIRKASDVH252 EVRKVLGEKG262 KNIKIISKIE272 NHEGVRRFDE 282 ILEASDGIMV292 ARGDLGIEIP302 AEKVFLAQKM312 MIGRCNRAGK322 PVICATQMLE 332 SMIKKPRPTR342 AEGSDVANAV352 LDGADCIMLS362 GETAKGDYPL372 EAVRMQHLIA 382 REAEAAIYHL392 QLFEELRRLA402 PITSDPTEAT412 AVGAVEASFK422 CCSGAIIVLT 432 KSGRSAHQVA442 RYRPRAPIIA452 VTRNPQTARQ462 AHLYRGIFPV472 LKDPVQEAWA 483 EDVDLRVNFA493 MNVGKARGFF503 KKGDVVIVLT513 GWRPGSGFTN523 TMRVVPVP |
|||||
|
|
||||||
| Click to View More Binding Site Information of This Target and Ligand Pair | ||||||
| Click to View More Binding Site Information of This Target with Different Ligands | ||||||
| Different Human System Profiles of Target | Top |
|---|---|
|
Human Similarity Proteins
of target is determined by comparing the sequence similarity of all human proteins with the target based on BLAST. The similarity proteins for a target are defined as the proteins with E-value < 0.005 and outside the protein families of the target.
A target that has fewer human similarity proteins outside its family is commonly regarded to possess a greater capacity to avoid undesired interactions and thus increase the possibility of finding successful drugs
(Brief Bioinform, 21: 649-662, 2020).
Human Tissue Distribution
of target is determined from a proteomics study that quantified more than 12,000 genes across 32 normal human tissues. Tissue Specificity (TS) score was used to define the enrichment of target across tissues.
The distribution of targets among different tissues or organs need to be taken into consideration when assessing the target druggability, as it is generally accepted that the wider the target distribution, the greater the concern over potential adverse effects
(Nat Rev Drug Discov, 20: 64-81, 2021).
Human Pathway Affiliation
of target is determined by the life-essential pathways provided on KEGG database. The target-affiliated pathways were defined based on the following two criteria (a) the pathways of the studied target should be life-essential for both healthy individuals and patients, and (b) the studied target should occupy an upstream position in the pathways and therefore had the ability to regulate biological function.
Targets involved in a fewer pathways have greater likelihood to be successfully developed, while those associated with more human pathways increase the chance of undesirable interferences with other human processes
(Pharmacol Rev, 58: 259-279, 2006).
Biological Network Descriptors
of target is determined based on a human protein-protein interactions (PPI) network consisting of 9,309 proteins and 52,713 PPIs, which were with a high confidence score of ≥ 0.95 collected from STRING database.
The network properties of targets based on protein-protein interactions (PPIs) have been widely adopted for the assessment of target’s druggability. Proteins with high node degree tend to have a high impact on network function through multiple interactions, while proteins with high betweenness centrality are regarded to be central for communication in interaction networks and regulate the flow of signaling information
(Front Pharmacol, 9, 1245, 2018;
Curr Opin Struct Biol. 44:134-142, 2017).
Human Similarity Proteins
Human Tissue Distribution
Human Pathway Affiliation
Biological Network Descriptors
|
|
|
There is no similarity protein (E value < 0.005) for this target
|
|
Note:
If a protein has TS (tissue specficity) scores at least in one tissue >= 2.5, this protein is called tissue-enriched (including tissue-enriched-but-not-specific and tissue-specific). In the plots, the vertical lines are at thresholds 2.5 and 4.
|


| KEGG Pathway | Pathway ID | Affiliated Target | Pathway Map |
|---|---|---|---|
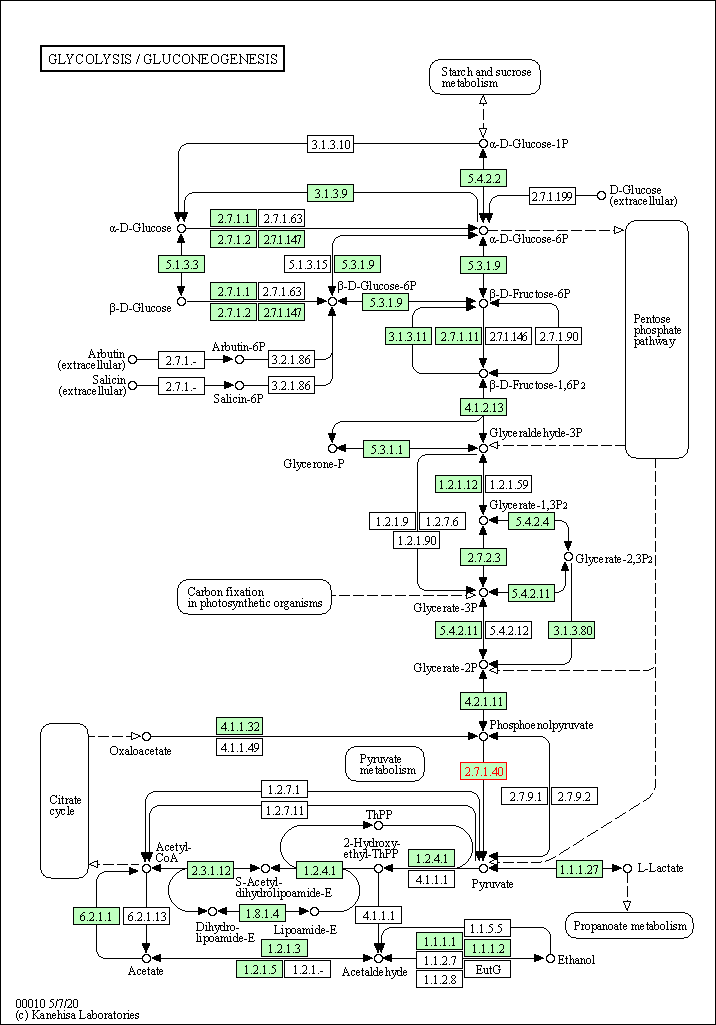
| Glycolysis / Gluconeogenesis | hsa00010 | Affiliated Target |

|
| Class: Metabolism => Carbohydrate metabolism | Pathway Hierarchy | ||
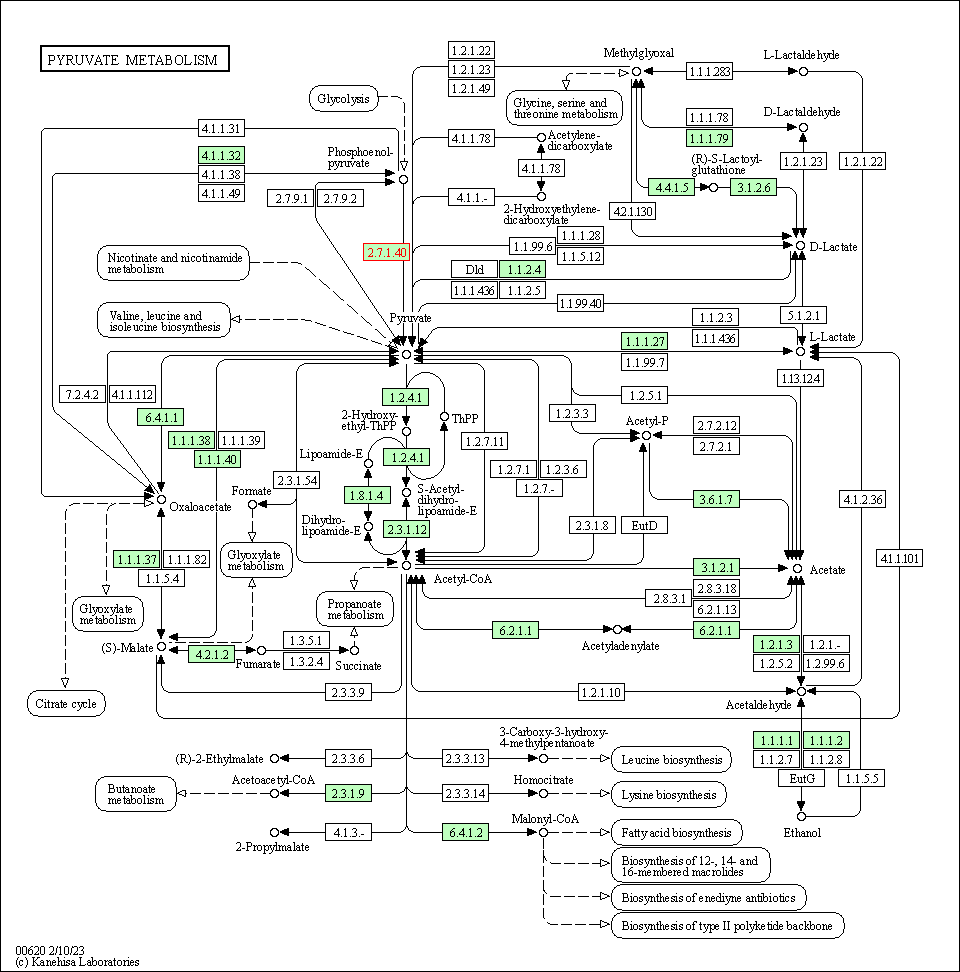
| Pyruvate metabolism | hsa00620 | Affiliated Target |

|
| Class: Metabolism => Carbohydrate metabolism | Pathway Hierarchy | ||
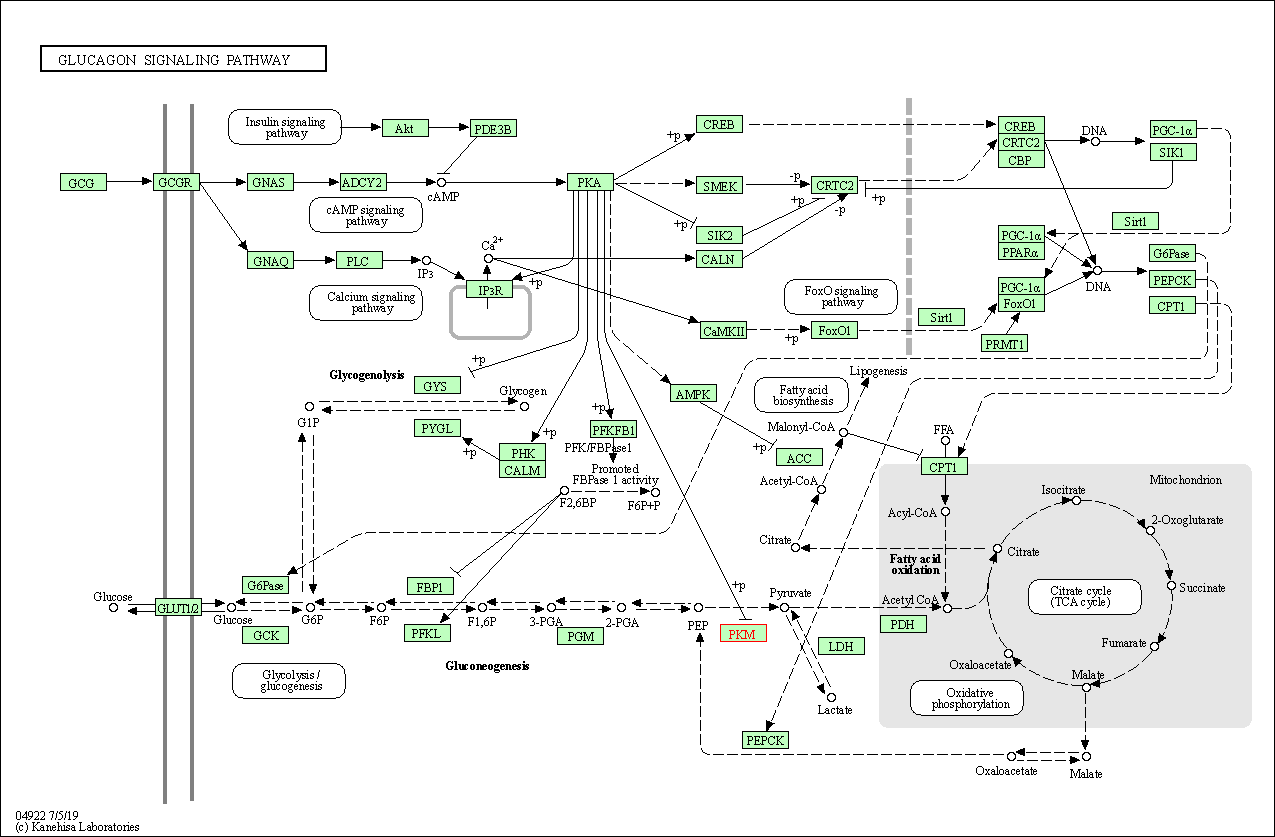
| Glucagon signaling pathway | hsa04922 | Affiliated Target |

|
| Class: Organismal Systems => Endocrine system | Pathway Hierarchy | ||
| Degree | 29 | Degree centrality | 3.12E-03 | Betweenness centrality | 6.80E-03 |
|---|---|---|---|---|---|
| Closeness centrality | 2.46E-01 | Radiality | 1.43E+01 | Clustering coefficient | 1.06E-01 |
| Neighborhood connectivity | 2.42E+01 | Topological coefficient | 5.12E-02 | Eccentricity | 12 |
| Download | Click to Download the Full PPI Network of This Target | ||||
| Chemical Structure based Activity Landscape of Target | Top |
|---|---|
| Target Poor or Non Binders | Top | |||||
|---|---|---|---|---|---|---|
| Target Poor or Non Binders | ||||||
| Target Regulators | Top | |||||
|---|---|---|---|---|---|---|
| Target-regulating microRNAs | ||||||
| Target-interacting Proteins | ||||||
| References | Top | |||||
|---|---|---|---|---|---|---|
| REF 1 | Interpreting expression profiles of cancers by genome-wide survey of breadth of expression in normal tissues. Genomics 2005 Aug;86(2):127-41. | |||||
| REF 2 | ClinicalTrials.gov (NCT00735332) Efficacy Study of TLN-232 in Patients With Recurring Metastatic Melanoma. U.S. National Institutes of Health. | |||||
| REF 3 | ClinicalTrials.gov (NCT04328740) Phase 1 Study of Oral TP-1454. U.S. National Institutes of Health. | |||||
| REF 4 | Clinical pipeline report, company report or official report of Sumitomo Dainippon Pharma. | |||||
| REF 5 | Mutations in the PKM2 exon-10 region are associated with reduced allostery and increased nuclear translocation. doi:10.1038/s42003-019-0343-4. | |||||
| REF 6 | An allostatic mechanism for M2 pyruvate kinase as an amino-acid sensor. Biochem J. 2018 May 31;475(10):1821-1837. | |||||
If You Find Any Error in Data or Bug in Web Service, Please Kindly Report It to Dr. Zhou and Dr. Zhang.

