Target Information
| Target General Information | Top | |||||
|---|---|---|---|---|---|---|
| Target ID |
T54771
(Former ID: TTDC00260)
|
|||||
| Target Name |
Sodium/glucose cotransporter 1 (SGLT1)
|
|||||
| Synonyms |
Solute carrier family 5 member 1; Na(+)/glucose cotransporter 1; NAGT; High affinity sodium-glucose cotransporter
Click to Show/Hide
|
|||||
| Gene Name |
SLC5A1
|
|||||
| Target Type |
Clinical trial target
|
[1] | ||||
| Disease | [+] 3 Target-related Diseases | + | ||||
| 1 | Diabetes mellitus [ICD-11: 5A10] | |||||
| 2 | Heart failure [ICD-11: BD10-BD1Z] | |||||
| 3 | Type 2 diabetes mellitus [ICD-11: 5A11] | |||||
| Function |
Efficient substrate transport in mammalian kidney is provided by the concerted action of a low affinity high capacity and a high affinity low capacity Na(+)/glucose cotransporter arranged in series along kidney proximal tubules. Actively transports glucose into cells by Na(+) cotransport with a Na(+) to glucose coupling ratio of 2:1.
Click to Show/Hide
|
|||||
| BioChemical Class |
Solute:sodium symporter
|
|||||
| UniProt ID | ||||||
| Sequence |
MDSSTWSPKTTAVTRPVETHELIRNAADISIIVIYFVVVMAVGLWAMFSTNRGTVGGFFL
AGRSMVWWPIGASLFASNIGSGHFVGLAGTGAASGIAIGGFEWNALVLVVVLGWLFVPIY IKAGVVTMPEYLRKRFGGQRIQVYLSLLSLLLYIFTKISADIFSGAIFINLALGLNLYLA IFLLLAITALYTITGGLAAVIYTDTLQTVIMLVGSLILTGFAFHEVGGYDAFMEKYMKAI PTIVSDGNTTFQEKCYTPRADSFHIFRDPLTGDLPWPGFIFGMSILTLWYWCTDQVIVQR CLSAKNMSHVKGGCILCGYLKLMPMFIMVMPGMISRILYTEKIACVVPSECEKYCGTKVG CTNIAYPTLVVELMPNGLRGLMLSVMLASLMSSLTSIFNSASTLFTMDIYAKVRKRASEK ELMIAGRLFILVLIGISIAWVPIVQSAQSGQLFDYIQSITSYLGPPIAAVFLLAIFWKRV NEPGAFWGLILGLLIGISRMITEFAYGTGSCMEPSNCPTIICGVHYLYFAIILFAISFIT IVVISLLTKPIPDVHLYRLCWSLRNSKEERIDLDAEEENIQEGPKETIEIETQVPEKKKG IFRRAYDLFCGLEQHGAPKMTEEEEKAMKMKMTDTSEKPLWRTVLNVNGIILVTVAVFCH AYFA Click to Show/Hide
|
|||||
| 3D Structure | Click to Show 3D Structure of This Target | AlphaFold | ||||
| HIT2.0 ID | T86J48 | |||||
| Drugs and Modes of Action | Top | |||||
|---|---|---|---|---|---|---|
| Clinical Trial Drug(s) | [+] 5 Clinical Trial Drugs | + | ||||
| 1 | LIK-066 | Drug Info | Phase 2 | Type-2 diabetes | [2], [3], [4] | |
| 2 | YG1699 | Drug Info | Phase 2 | Type-1 diabetes | [5] | |
| 3 | 1614235 + 2330672 | Drug Info | Phase 1 | Type-2 diabetes | [6] | |
| 4 | GSK1614235 | Drug Info | Phase 1 | Type-2 diabetes | [7] | |
| 5 | LX2761 | Drug Info | Phase 1 | Type 2 diabetes | [8] | |
| Discontinued Drug(s) | [+] 1 Discontinued Drugs | + | ||||
| 1 | T-1095 | Drug Info | Discontinued in Phase 2 | Diabetic complication | [9] | |
| Mode of Action | [+] 3 Modes of Action | + | ||||
| Inhibitor | [+] 21 Inhibitor drugs | + | ||||
| 1 | LIK-066 | Drug Info | [10] | |||
| 2 | YG1699 | Drug Info | [5] | |||
| 3 | LX2761 | Drug Info | [8] | |||
| 4 | 10-methoxy-N(1)-methylburnamine-17-O-veratrate | Drug Info | [13] | |||
| 5 | Acerogenin A | Drug Info | [14] | |||
| 6 | ACEROGENIN B | Drug Info | [14] | |||
| 7 | Alstiphyllanine D | Drug Info | [13] | |||
| 8 | Alstiphyllanine E | Drug Info | [13] | |||
| 9 | Alstiphyllanine F | Drug Info | [13] | |||
| 10 | Burnamine-17-O-3',4',5'-trimethoxybenzoate | Drug Info | [13] | |||
| 11 | KURAIDIN | Drug Info | [15] | |||
| 12 | KURARINONE | Drug Info | [15] | |||
| 13 | Kushenol N | Drug Info | [15] | |||
| 14 | O-spiroketal glucoside | Drug Info | [16] | |||
| 15 | Phlorizin | Drug Info | [17] | |||
| 16 | QCP | Drug Info | [18] | |||
| 17 | QCPac | Drug Info | [18] | |||
| 18 | QNEQCPQVSac | Drug Info | [18] | |||
| 19 | QSPac | Drug Info | [18] | |||
| 20 | sergliflozin | Drug Info | [19] | |||
| 21 | Sophoraflavanone G | Drug Info | [15] | |||
| Modulator | [+] 2 Modulator drugs | + | ||||
| 1 | 1614235 + 2330672 | Drug Info | [10] | |||
| 2 | T-1095 | Drug Info | [12] | |||
| Blocker | [+] 1 Blocker drugs | + | ||||
| 1 | GSK1614235 | Drug Info | [11] | |||
| Cell-based Target Expression Variations | Top | |||||
|---|---|---|---|---|---|---|
| Cell-based Target Expression Variations | ||||||
| Drug Binding Sites of Target | Top | |||||
|---|---|---|---|---|---|---|
| Ligand Name: LX2761 | Ligand Info | |||||
| Structure Description | Structure of human SGLT1-MAP17 complex bound with LX2761 | PDB:7WMV | ||||
| Method | Electron microscopy | Resolution | 3.20 Å | Mutation | No | [20] |
| PDB Sequence |
ETHELIRNAA
27 DISIIVIYFV37 VVMAVGLWAM47 FSTNRGTVGG57 FFLAGRSMVW67 WPIGASLFAS 77 NIGSGHFVGL87 AGTGAASGIA97 IGGFEWNALV107 LVVVLGWLFV117 PIYIKAGVVT 127 MPEYLRKRFG137 GQRIQVYLSL147 LSLLLYIFTK157 ISADIFSGAI167 FINLALGLNL 177 YLAIFLLLAI187 TALYTITGGL197 AAVIYTDTLQ207 TVIMLVGSLI217 LTGFAFHEVG 227 GYDAFMEKYM237 KAIPTIVSDG247 NTTFQEKCYT257 PRADSFHIFR267 DPLTGDLPWP 277 GFIFGMSILT287 LWYWCTDQVI297 VQRCLSAKNM307 SHVKGGCILC317 GYLKLMPMFI 327 MVMPGMISRI337 LYTEKIACVV347 PSECEKYCGT357 KVGCTNIAYP367 TLVVELMPNG 377 LRGLMLSVML387 ASLMSSLTSI397 FNSASTLFTM407 DIYAKVRKRA417 SEKELMIAGR 427 LFILVLIGIS437 IAWVPIVQSA447 QSGQLFDYIQ457 SITSYLGPPI467 AAVFLLAIFW 477 KRVNEPGAFW487 GLILGLLIGI497 SRMITEFAYG507 TGSCMEPSNC517 PTIICGVHYL 527 YFAIILFAIS537 FITIVVISLL547 TKPIPDVHLY557 RLCWSLRNSK567 EERIDLDATE 622 EEEKAMKMKM632 TDTSEKPLWR642 TVLNVNGIIL652 VTVAVFCHAY662 FA |
|||||
|
|
ASN78
2.930
ILE79
4.988
GLY82
4.437
HIS83
2.607
GLY86
4.323
LEU87
3.163
THR90
3.489
ILE98
3.357
PHE101
3.336
GLU102
3.129
ALA105
3.282
ALA160
4.778
ASP273
3.994
|
|||||
| Ligand Name: Cholesterol | Ligand Info | |||||
| Structure Description | CryoEM structure of SGLT1 at 3.4 A resolution | PDB:7SL8 | ||||
| Method | Electron microscopy | Resolution | 3.40 Å | Mutation | No | [21] |
| PDB Sequence |
HELIRNAADI
29 SVIVIYFLLV39 MAVGLWSMFK49 RSMVWWPIGA72 SLFASNIGSG82 HFIGLAGTGA 92 ASGLAVGGFE102 WNALVLLLVL112 GWVFVPIYIK122 AGVVTMPEYL132 RKRFGGQRIQ 142 VYLSVLSLFL152 YIFTKISVDI162 FSGAIFINLA172 LGWNLYLSII182 LLLAITALYT 192 ITGGLAAVIY202 TDTLQTLIML212 IGALILMGFA222 FHEVGGYDAF232 MEKYMKAIPT 242 IVSDGNTTFQ252 EKCYTPRADS262 FHIFRDPLTG272 DLPWPGFIFG282 LTILALWYWC 292 TDQVIVQRCL302 AAKNMSHVKG312 GCILAGYLKL322 LPMFIMVMPG332 MISRILFPDK 342 VACVVPSECE352 KYCGTKVGCT362 NIAYPTLVVE372 LMPNGLRGLM382 LAVMLAALMS 392 SLTSIFNSAS402 TLFTMDIYAK412 VRKRASEKEL422 MIVGRLFVLF432 LVVVSIAWIP 442 IVQSAQSGQL452 FDYIQSVSSY462 LAPPVAAVFL472 LAIFWKRVNE482 QGAFWGLILG 492 LLLGLSRLIL502 EFAYGTGSCM512 EPSNCPTIIC522 GVHYLYFAII532 LFAISGIVTV 542 VVSLLTKPIP552 DVHLYRLCWS562 LRNSKEERIM630 KMTDTSEKPL640 WRTVLNINAI 650 LLLAVAIFCW660 GYFASNSLEV670 LF
|
|||||
|
|
||||||
| Click to View More Binding Site Information of This Target with Different Ligands | ||||||
| Different Human System Profiles of Target | Top |
|---|---|
|
Human Similarity Proteins
of target is determined by comparing the sequence similarity of all human proteins with the target based on BLAST. The similarity proteins for a target are defined as the proteins with E-value < 0.005 and outside the protein families of the target.
A target that has fewer human similarity proteins outside its family is commonly regarded to possess a greater capacity to avoid undesired interactions and thus increase the possibility of finding successful drugs
(Brief Bioinform, 21: 649-662, 2020).
Human Tissue Distribution
of target is determined from a proteomics study that quantified more than 12,000 genes across 32 normal human tissues. Tissue Specificity (TS) score was used to define the enrichment of target across tissues.
The distribution of targets among different tissues or organs need to be taken into consideration when assessing the target druggability, as it is generally accepted that the wider the target distribution, the greater the concern over potential adverse effects
(Nat Rev Drug Discov, 20: 64-81, 2021).
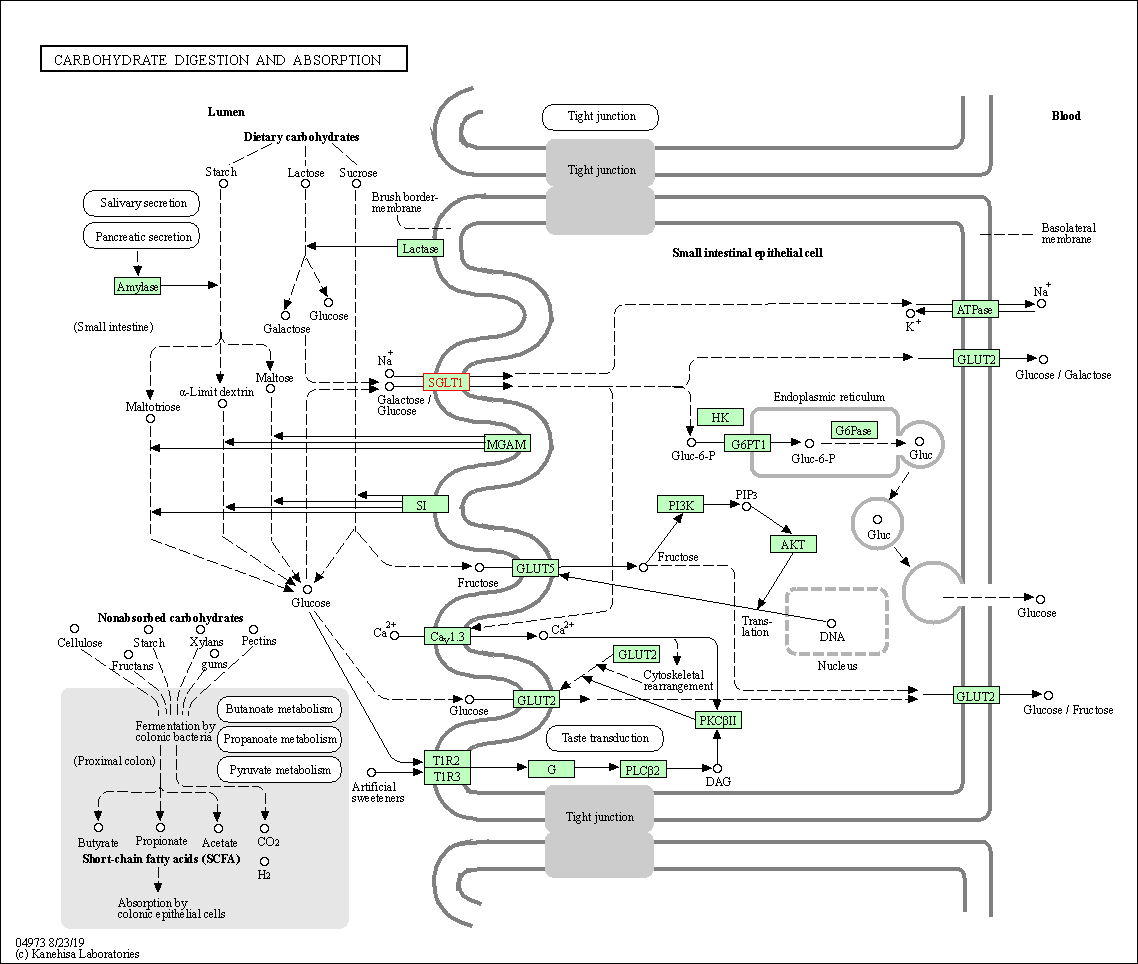
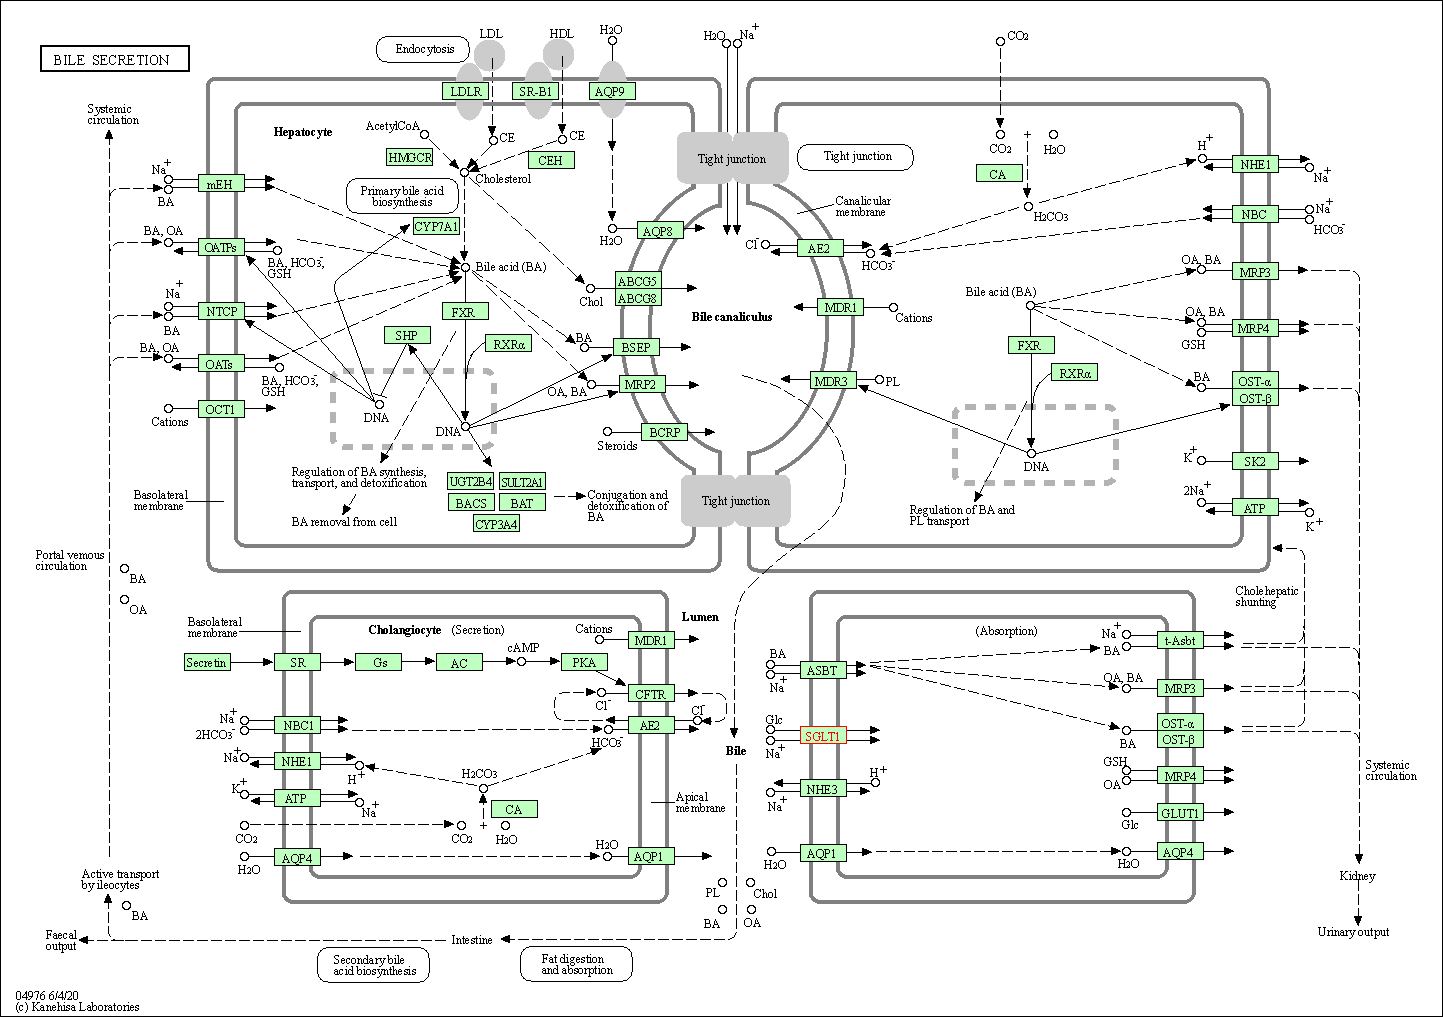
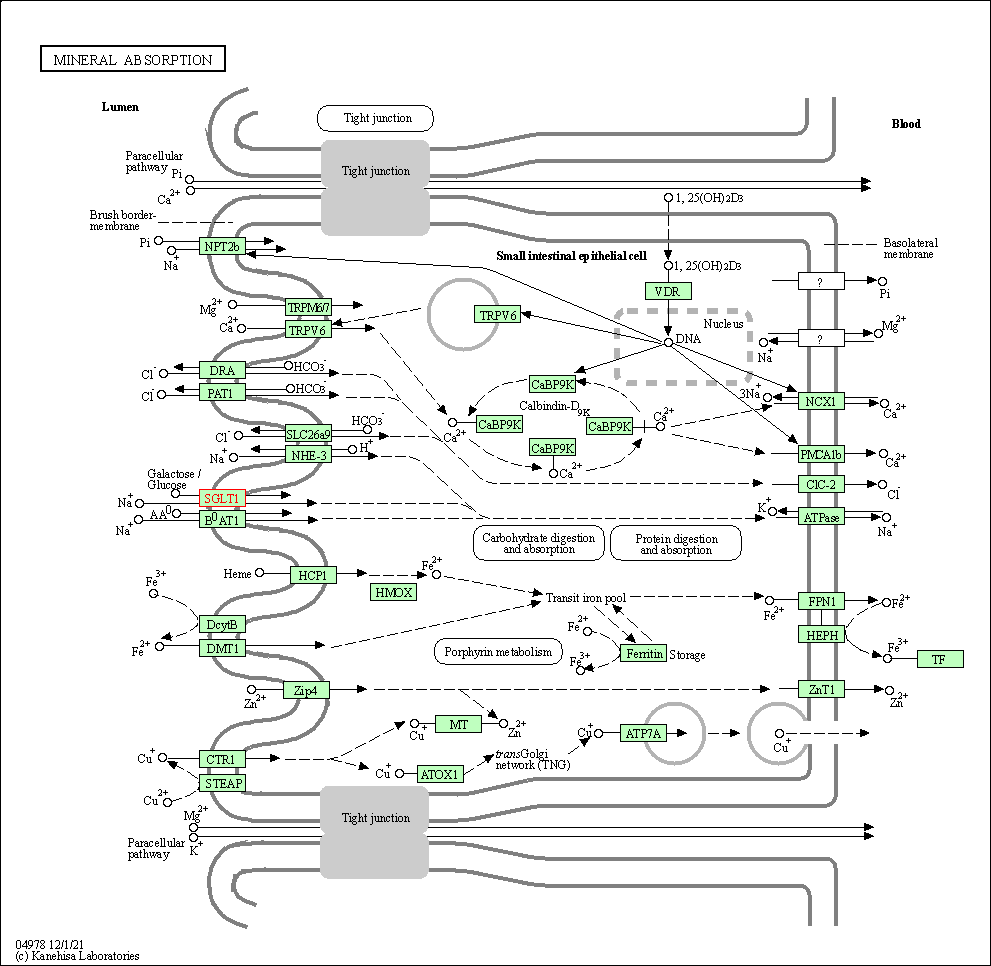
Human Pathway Affiliation
of target is determined by the life-essential pathways provided on KEGG database. The target-affiliated pathways were defined based on the following two criteria (a) the pathways of the studied target should be life-essential for both healthy individuals and patients, and (b) the studied target should occupy an upstream position in the pathways and therefore had the ability to regulate biological function.
Targets involved in a fewer pathways have greater likelihood to be successfully developed, while those associated with more human pathways increase the chance of undesirable interferences with other human processes
(Pharmacol Rev, 58: 259-279, 2006).
Biological Network Descriptors
of target is determined based on a human protein-protein interactions (PPI) network consisting of 9,309 proteins and 52,713 PPIs, which were with a high confidence score of ≥ 0.95 collected from STRING database.
The network properties of targets based on protein-protein interactions (PPIs) have been widely adopted for the assessment of target’s druggability. Proteins with high node degree tend to have a high impact on network function through multiple interactions, while proteins with high betweenness centrality are regarded to be central for communication in interaction networks and regulate the flow of signaling information
(Front Pharmacol, 9, 1245, 2018;
Curr Opin Struct Biol. 44:134-142, 2017).
Human Similarity Proteins
Human Tissue Distribution
Human Pathway Affiliation
Biological Network Descriptors
|
|
|
There is no similarity protein (E value < 0.005) for this target
|
|
Note:
If a protein has TS (tissue specficity) scores at least in one tissue >= 2.5, this protein is called tissue-enriched (including tissue-enriched-but-not-specific and tissue-specific). In the plots, the vertical lines are at thresholds 2.5 and 4.
|


| KEGG Pathway | Pathway ID | Affiliated Target | Pathway Map |
|---|---|---|---|
| Carbohydrate digestion and absorption | hsa04973 | Affiliated Target |

|
| Class: Organismal Systems => Digestive system | Pathway Hierarchy | ||
| Bile secretion | hsa04976 | Affiliated Target |

|
| Class: Organismal Systems => Digestive system | Pathway Hierarchy | ||
| Mineral absorption | hsa04978 | Affiliated Target |

|
| Class: Organismal Systems => Digestive system | Pathway Hierarchy | ||
| Degree | 1 | Degree centrality | 1.07E-04 | Betweenness centrality | 0.00E+00 |
|---|---|---|---|---|---|
| Closeness centrality | 2.17E-01 | Radiality | 1.38E+01 | Clustering coefficient | 0.00E+00 |
| Neighborhood connectivity | 1.37E+02 | Topological coefficient | 1.00E+00 | Eccentricity | 12 |
| Download | Click to Download the Full PPI Network of This Target | ||||
| Chemical Structure based Activity Landscape of Target | Top |
|---|---|
| Drug Property Profile of Target | Top | |
|---|---|---|
| (1) Molecular Weight (mw) based Drug Clustering | (2) Octanol/Water Partition Coefficient (xlogp) based Drug Clustering | |
|
|
||
| (3) Hydrogen Bond Donor Count (hbonddonor) based Drug Clustering | (4) Hydrogen Bond Acceptor Count (hbondacc) based Drug Clustering | |
|
|
||
| (5) Rotatable Bond Count (rotbonds) based Drug Clustering | (6) Topological Polar Surface Area (polararea) based Drug Clustering | |
|
|
||
| "RO5" indicates the cutoff set by lipinski's rule of five; "D123AB" colored in GREEN denotes the no violation of any cutoff in lipinski's rule of five; "D123AB" colored in PURPLE refers to the violation of only one cutoff in lipinski's rule of five; "D123AB" colored in BLACK represents the violation of more than one cutoffs in lipinski's rule of five | ||
| Co-Targets | Top | |||||
|---|---|---|---|---|---|---|
| Co-Targets | ||||||
| Target Poor or Non Binders | Top | |||||
|---|---|---|---|---|---|---|
| Target Poor or Non Binders | ||||||
| Target Profiles in Patients | Top | |||||
|---|---|---|---|---|---|---|
| Target Expression Profile (TEP) |
||||||
| Target Affiliated Biological Pathways | Top | |||||
|---|---|---|---|---|---|---|
| KEGG Pathway | [+] 3 KEGG Pathways | + | ||||
| 1 | Carbohydrate digestion and absorption | |||||
| 2 | Bile secretion | |||||
| 3 | Mineral absorption | |||||
| Pathwhiz Pathway | [+] 2 Pathwhiz Pathways | + | ||||
| 1 | Lactose Degradation | |||||
| 2 | Trehalose Degradation | |||||
| Reactome | [+] 3 Reactome Pathways | + | ||||
| 1 | Hexose transport | |||||
| 2 | Na+-dependent glucose transporters | |||||
| 3 | Inositol transporters | |||||
| WikiPathways | [+] 3 WikiPathways | + | ||||
| 1 | NRF2 pathway | |||||
| 2 | Transport of glucose and other sugars, bile salts and organic acids, metal ions and amine compounds | |||||
| 3 | Metabolism of carbohydrates | |||||
| Target-Related Models and Studies | Top | |||||
|---|---|---|---|---|---|---|
| Target Validation | ||||||
| References | Top | |||||
|---|---|---|---|---|---|---|
| REF 1 | LX4211, a dual SGLT1/SGLT2 inhibitor, improved glycemic control in patients with type 2 diabetes in a randomized, placebo-controlled trial. Clin Pharmacol Ther. 2012 Aug;92(2):158-69. | |||||
| REF 2 | ClinicalTrials.gov (NCT01824264) Dose-finding Study of LIK066 Compared With Placebo or Sitagliptin to Evaluate Change in HbA1c in Patients With Diabetes. U.S. National Institutes of Health. | |||||
| REF 3 | Clinical pipeline report, company report or official report of the Pharmaceutical Research and Manufacturers of America (PhRMA) | |||||
| REF 4 | Clinical pipeline report, company report or official report of the Pharmaceutical Research and Manufacturers of America (PhRMA) | |||||
| REF 5 | ClinicalTrials.gov (NCT04956263) A Comparison of Postprandial Glucose After a Mixed Meal Tolerance Test, and the Metabolic Effects of Insulin Withdrawal in a Crossover Study of the Dual Systemic SGLT1 and SGLT2 Inhibitor YG1699, and the Selective SGLT2 Inhibitor Dapagliflozin in Subjects With Type 1 Diabetes. U.S.National Institutes of Health. | |||||
| REF 6 | Trusted, scientifically sound profiles of drug programs, clinical trials, safety reports, and company deals, written by scientists. Springer. 2015. Adis Insight (drug id 800037723) | |||||
| REF 7 | ClinicalTrials.gov (NCT01607385) A Study to Evaluate the Safety, Tolerability, Pharmacokinetic a Single Day of Dosing With GSK1614235.. U.S. National Institutes of Health. | |||||
| REF 8 | Clinical pipeline report, company report or official report of Lexicon Pharmaceuticals. | |||||
| REF 9 | Trusted, scientifically sound profiles of drug programs, clinical trials, safety reports, and company deals, written by scientists. Springer. 2015. Adis Insight (drug id 800011538) | |||||
| REF 10 | URL: http://www.guidetopharmacology.org Nucleic Acids Res. 2015 Oct 12. pii: gkv1037. The IUPHAR/BPS Guide to PHARMACOLOGY in 2016: towards curated quantitative interactions between 1300 protein targets and 6000 ligands. (Target id: 915). | |||||
| REF 11 | Clinical pipeline report, company report or official report of GlaxoSmithKline (2009). | |||||
| REF 12 | T-1095, an inhibitor of renal Na+-glucose cotransporters, may provide a novel approach to treating diabetes. Diabetes. 1999 Sep;48(9):1794-800. | |||||
| REF 13 | Alstiphyllanines E-H, picraline and ajmaline-type alkaloids from Alstonia macrophylla inhibiting sodium glucose cotransporter. Bioorg Med Chem. 2010 Mar 15;18(6):2152-2158. | |||||
| REF 14 | Cyclic diarylheptanoids as Na+-glucose cotransporter (SGLT) inhibitors from Acer nikoense. Bioorg Med Chem Lett. 2010 Feb 1;20(3):1070-4. | |||||
| REF 15 | Na+-glucose cotransporter (SGLT) inhibitory flavonoids from the roots of Sophora flavescens. Bioorg Med Chem. 2007 May 15;15(10):3445-9. | |||||
| REF 16 | ortho-Substituted C-aryl glucosides as highly potent and selective renal sodium-dependent glucose co-transporter 2 (SGLT2) inhibitors. Bioorg Med Chem. 2010 Jun 15;18(12):4422-32. | |||||
| REF 17 | J Biol Chem. 1988 Jan 5;263(1):187-92.High affinity phlorizin binding to the LLC-PK1 cells exhibits a sodium:phlorizin stoichiometry of 2:1. | |||||
| REF 18 | Tripeptides of RS1 (RSC1A1) inhibit a monosaccharide-dependent exocytotic pathway of Na+-D-glucose cotransporter SGLT1 with high affinity. J Biol Chem. 2007 Sep 28;282(39):28501-13. | |||||
| REF 19 | Sergliflozin, a novel selective inhibitor of low-affinity sodium glucose cotransporter (SGLT2), validates the critical role of SGLT2 in renal gluco... J Pharmacol Exp Ther. 2007 Jan;320(1):323-30. | |||||
| REF 20 | Structural mechanism of SGLT1 inhibitors. Nat Commun. 2022 Oct 28;13(1):6440. | |||||
| REF 21 | Structure and mechanism of the SGLT family of glucose transporters. Nature. 2022 Jan;601(7892):274-279. | |||||
If You Find Any Error in Data or Bug in Web Service, Please Kindly Report It to Dr. Zhou and Dr. Zhang.

